

Abstract
We have studied the structural properties of monounsaturated diacylphosphatidylcholine lipid bilayers (i.e., diCn:1PC, where n = 14, 16, 18, 20, 22, and 24 is the number of acyl chain carbons). High-resolution x-ray scattering data were analyzed in conjunction with contrast-varied neutron scattering data using a technique we recently developed. Analyses of the data show that the manner by which bilayer thickness increases with increasing n in monounsaturated diacylphosphatidylcholines is dependent on the double bond's position. For commonly available monounsaturated diacylphosphatidylcholines, this results in the nonlinear behavior of both bilayer thickness and lipid area, whereas for diC18:1PC bilayers, lipid area assumes a maximum value. It is worthwhile to note that compared to previous data, our results indicate that lipid areas are smaller by ∼10%. This observation highlights the need to revisit lipid areas, as they are often used in comparisons with molecular dynamics simulations. Moreover, simulators are encouraged to compare their results not only to x-ray scattering data, but to neutron data as well.
Introduction
The complex dynamics exhibited by biological membranes—characteristic of amphiphilic systems—are highly dependent on the membrane's structure. It should therefore not come as a surprise that accurate structural data regarding the various membrane components are important in determining specific membrane functions. One such datum is a lipid's lateral area, which is commonly understood to influence lipid-lipid and lipid-protein interactions, and which plays a central role in the parameterization of the force fields used in molecular dynamics (MD) simulations (1).
Despite their importance, published lipid areas have been relatively scarce and, for the most part, inconsistent (2). Noteworthy are the discrepancies between lipid areas as determined by x-ray and neutron scattering—arguably two of the most widely used experimental techniques in structural biology (3). In both cases, lipid areas are calculated from bilayer thickness and volumetric information, but the two techniques happen to be sensitive to different bilayer “thicknesses”. The thickness best resolved by x-rays is the distance between the peaks in the electron density (ED) profile, which corresponds to the distance between lipid headgroups (i.e., phosphates), DHH. On the other hand, the high contrast between the protonated lipid and the deuterated water in neutron scattering experiments defines the overall Luzzati thickness of the bilayer, DB. The often underappreciated advantage of DB is that lipid area can be obtained directly from accurately measured lipid volumes, VL (i.e., A = 2VL/DB), making neutron scattering a preferred technique for determining this property. Despite this advantage, due to the lower quality of neutron data in the higher q scattering region, previously accepted lipid areas were almost exclusively determined using x-ray scattering experiments (2,4–7) rather than from neutron scattering experiments (8–10).
Almost two decades ago, the joint refinement of x-ray and neutron diffraction data to obtain bilayer structural information was introduced by Wiener and White (11). Even though the analysis was applied to partially dehydrated bilayers, these studies illustrated the challenges faced by the diffraction method from aligned stacks of bilayers. The main drawback of the Wiener and White (11) method was the extensive number of parameters needed to fit the data. Recently, we developed a different model for calculating scattering density profiles (SDPs) in which we decreased the number of parameters necessary to fit the data to nearly half that for the original composition-space model (13), and which we use in simultaneous analyses of x-ray and neutron scattering data (12). By appropriately parsing a lipid molecule and simultaneously analyzing the different “contrast” data (i.e., x-ray and different-deuteration neutron scattering data), we have shown that the precise structure of fully hydrated fluid bilayers can be determined.
The inconsistencies in lipid areas have also been highlighted by the disparate results arising from MD simulations using different force fields. For example, MD simulations based on CHARMM potentials are performed at nonzero surface tension to make them better agree with x-ray scattering data (14), whereas simulations using a combination of GROMOS and OPLS potentials do not seem to require this additional “tweaking” (15). Since MD force fields are considered to be “well tuned” if they are able to reproduce experimental data (16), much more work needs to be done to reconcile simulation and experiment, even in the simplest case of single-component membranes.
In this study, we report on the effects of acyl chain length and double-bond position on the structure of fully hydrated, fluid phosphatidylcholine bilayers containing one double bond per acyl chain (diCn:1PC, where n = 14, 16, 18, 20, 22, and 24 is the number of acyl chain carbons). Under biologically relevant conditions, these lipids form highly disordered structures that closely mimic biological membranes. Our bilayer description is based on volume probability distributions to which we apply the principle of spatial conservation. We also report on several different bilayer thicknesses. For example, the hydrophobic thickness is important when considering the hydrophobic matching of proteins with membranes, whereas the steric thickness determines the interaction between membranes and biomacromolecules. The thickness best resolved by x-rays is DHH, whereas neutron scattering best provides DB. In conjunction with volumetric information, these thicknesses are then used to determine the lateral area/lipid, A, parallel to the membrane surface. We emphasize that our model only assumes the functional forms of the probability distributions and does not assume numerical values for the parameters that are, and should be, different for different lipid bilayers. The experimental trends observed are reproduced, with coarse-grained simulations revealing changes to bilayer properties through a subtle interplay between acyl chain length and position of the double bond.
Materials and Methods
Synthetic 1,2-dimyristoleoyl-sn-glycero-3-phosphatidylcholine (9-cis, diC14:1PC), 1,2-dipalmitoleoyl-sn-glycero-3-phosphatidylcholine (9-cis, diC16:1PC), 1,2-dioleoyl-sn-glycero-3-phosphatidylcholine (9-cis, diC18:1PC), 1,2-dieicosenoyl-sn-glycero-3-phosphatidylcholine (11-cis, diC20:1PC), 1,2-dierucoyl-sn-glycero-3-phosphatidylcholine (13-cis, diC22:1PC), and 1,2-dinervonoyl-sn-glycero-3-phosphatidylcholine (15-cis, diC24:1PC) were purchased from Avanti Polar Lipids (Alabaster, AL) and used without further purification. Unilamellar vesicles (ULVs) 600 Å in diameter were prepared as in a previous study (17). Samples used in neutron contrast variation experiments were first dispersed in D2O and, after extrusion, diluted with 18 MΩ-cm water (Millipore, Billerica, MA) or D2O to the desired external contrast condition (i.e., 100%, 70%, and 50% D2O). The total lipid concentration for all ULV samples was ∼20 mg/ml, which guarantees sufficient water between ULVs, and the practical elimination of interparticle interactions (17).
Small-angle x-ray scattering
X-ray data were taken at the Cornell High Energy Synchrotron Source G-1 station. A 1.234-Å wavelength (λ) x-ray beam of dimensions 0.3 × 0.3 mm2 was detected using a 1024 × 1024 pixel array FLICAM charge-coupled device, with 69.78 μm linear dimension pixels. The sample-to-detector distance was 418.6 mm, as determined using silver behenate. Samples were contained in 1.5-mm quartz capillaries placed in a temperature-controlled, multiposition sample holder. Two-dimensional images were “dezingered” using two consecutive 10-s exposures, and were corrected using calibration files supplied by the Cornell High Energy Synchrotron Source. Data sets were normalized using the incident beam intensity as measured by an ion chamber, and background resulting from water and air scatter was subtracted according to a procedure described previously (17).
Small-angle neutron scattering
Small-angle neutron scattering (SANS) measurements were performed on the PAXE spectrometer located at the end of the G5 cold neutron guide at the Orphée reactor (Laboratoire Léon Brillouin, Gif-sur-Yvette, France). Experiments were carried out at sample-to-detector distances of 1.77 and 5.07 m using a λ of 6 Å. This resulted in a total scattering vector (q = 4π/λ sin(θ/2), where θ is the scattering angle) of 0.03 < q < 0.2 Å−1. Data were collected using a 64 × 64 mm2 two-dimensional 3He position-sensitive detector with a 1 × 1 mm2 spatial resolution. Samples were taken up in standard 2-mm pathlength quartz cuvettes, or 1-mm cuvettes in the case of contrast variation. The sample temperature was set and controlled electronically at 30.0 ± 0.1°C. Data acquisition time was from 30 min to 1 h per sample, and intensities were normalized for sample transmission. Background subtraction was performed using a blank sample reference in accordance with the procedure described previously (17).
Experimental form factors F(q) were obtained from the measured scattered intensities I(q) for both neutrons and x rays, using
| (1) |
where PLC(q) is the Lorentz correction, which for ULVs is equal to q2, whereas PTS(q) describes their “sphericity” and “polydispersity” (18). Despite its complicated form, for ULVs with a mean radius of 300 Å and a polydispersity of 75 Å, PTS is constant over the entire q range (i.e., q > 0.03 Å−1). Thus, the measured intensities multiplied by q2 are directly proportional to the square of the form factors.
Structural model of bilayer
The SDP model is graphically shown in Fig. 1. Briefly, the component groups are chosen on the assumption that each group has the same functional form for all of the different contrast conditions. For example, carbonyl and glycerol groups are described by a single Gaussian (CG), the phosphate and part of the choline (CH2CH2N) by another Gaussian (PCN), and the remaining choline (3xCH3) by yet another Gaussian (CholCH3). In effect, three Gaussians are used to describe the lipid headgroup. The error function represents the total hydrocarbon region (i.e., sum of CH2, CH, and CH3 groups). The CH and CH3 groups are each described by a single Gaussian, which are then subtracted from the error function to obtain the CH2 distribution. The water distribution is not defined by any particular function, rather it is calculated based on the “complementarity” requirement, whereby all of the probabilities add up to 1. In this way, the model satisfies the spatial conservation principle while capturing all of the features of the different SDPs (12).
Figure 1.
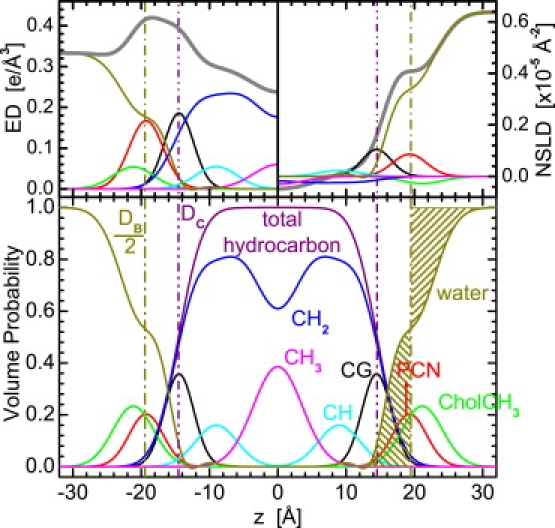
SDP model representation of a lipid bilayer (diC18:1PC). (Upper) Electron densities (left) and neutron scattering-length densities (right) of the various component distributions in a lipid bilayer, including the total scattering density (heavy gray lines). (Lower) Volume probability distributions, with the total probability equal to 1 at each point across the bilayer. The concept of the Gibbs dividing surface is shown for the water distribution, whose mean position is defined by the equality of the two shaded areas.
From Fig. 1, it is obvious that neutrons and x rays are sensitive to different parts of the bilayer. For example, in the case of x rays, the electron-dense phosphate groups contrast very well with the less electron-dense hydrocarbon region. Thus, x-ray data are well suited for the refinement of the lipid headgroup and hydrocarbon chains. On the other hand, the high neutron-scattering-length density (NSLD) of D2O, which is often used in neutron experiments instead of H2O, permits neutron scattering to accurately determine the total bilayer thickness and, as a result, lipid area.
Previous models have divided the lipid bilayer into four or five structural components consisting of the terminal methyl groups, methylene groups (with an occasional separation of a double bond), and the combined carbonyl/glycerol and phosphate/choline groups (14,19). However, as discussed in a previous work (12), such models are only valid for fitting x-ray data, or neutron data, from bilayers with deuterated cholines. We find that although the SDP model is frugal with regard to the number of parameters, it is still capable of simultaneously describing both NSLD and ED profiles. Although the SDP model is designed to obtain structure from x-ray and neutron scattering data, the primary description is in terms of neither ED nor NSLD. Instead, it is described by volume probability distributions, which should satisfy the spatial conservation principle whereby volume is conserved. Compared to previous models based on global spatial conservation (20), the novel feature of the SDP model is that it imposes spatial conservation locally. Therefore, the volume probabilities of the component groups in the SDP model sum up to unity at each point, z, along the bilayer normal. In contrast, for models where spatial conservation was not rigorously incorporated, deviations of up to ∼15% were required to fit the data (14,21).
Determination of lipid area, A
The detailed determination of area/lipid, A, is explained in a previous article (12). A follows from the volume probability, which gives the Gibbs dividing surfaces for the water (i.e., DB/2) and hydrocarbon chain (i.e., DC) regions shown in Fig. 1. For example, the mean position of the water distribution is defined by the equality of the integrated water probabilities to the left of the Gibbs dividing surface and the integrated deficit of water probabilities to its right (Fig. 1, shaded areas). In other words, it is the position that would correspond to the edge of the distribution if it were represented by a simple box model, making it equivalent to Luzzati's division of two component systems consisting of water and lipid. The criterion of the dividing surface is written as
| (2) |
where D/2 is a point beyond which the water probability PW(z) = 1. From this, DB can be expressed in the form (12)
| (3) |
The latter integral is equivalent to the integrated deficit of the lipid probability, which is equal to (D/2 − VL/A). Equation 3 then yields the first of two equalities, where lipid area is (12)
| (4) |
The second equality in Eq. 4 follows from the equivalent derivation applied to the dividing surface between the hydrocarbon and headgroup regions.
Even though the experimentally obtained F(qz) contains information about the bilayer's structure in the z direction (along the bilayer normal), Eq. 4 also allows for the evaluation of structure in the lateral direction, namely A. It should be emphasized that although the latter part of this equation has been widely used in previous models, in the case of neutron scattering, the first equality has important implications. For protonated lipid bilayers dispersed in D2O, neutrons are particularly sensitive to the overall bilayer thickness, DB. Equation 4 thus directly yields lipid area when VL is known.
It is important to note that A becomes the central parameter in the SDP model for all of the lipid component distributions. This enables the calculation of absolute scattering intensities (model), which in turn allows for the arbitrary scaled experimental data to be put on an absolute scale (12).
MD simulations
The recently developed MARTINI coarse-grained model (22) describes small groups of atoms as beads, allowing for simulation times in the range of microseconds while practically retaining atomic-resolution detail. The model reproduces a variety of structural, dynamic, and thermodynamic membrane properties on a semiquantitative basis. In this study, MD simulations using GROMACS (23) were performed for monounsaturated diacylphosphatidylcholine bilayers with varying hydrocarbon chain lengths. The system details were chosen to match the experimental conditions as closely as possible, taking into account the relative position of the double bonds. The bead compositions used were c1-c1-c3, c1-c1-c3-c1, c1-c1-c3-c1-c1, c1-c1-c1-c3-c1-c1, and c1-c1-c1-c1-c3-c1-c1, corresponding roughly to diC12:1PC, diC16:1PC, diC20:1PC, diC24:1PC, and diC28:1PC, respectively. Every bead represents four methylene groups, and c3 is the position of the unsaturated bead. Additional simulations were performed using lipids with the position of the double bond fixed with respect to either the headgroup or methyl terminus. Tension-free bilayer patches containing 128 lipids and excess water (40 waters/lipid) were simulated at T = 298 K over time periods of several microseconds for each lipid. Standard simulation parameters were used as described in Marrink et al. (22).
Results and Discussion
The SDP model with only one set of parameters was used to simultaneously fit up to four data sets obtained under different contrast conditions. Besides x-ray and neutron data from protonated bilayers dispersed in 100% D2O, other contrast conditions include neutron scattering experiments performed with bilayers dispersed in 70% and 50% D2O solutions in the case of diC14:1PC, diC18:1PC, and diC22:1PC bilayers. Fig. 2 shows all of the experimental data together with the best-fit results.
Figure 2.
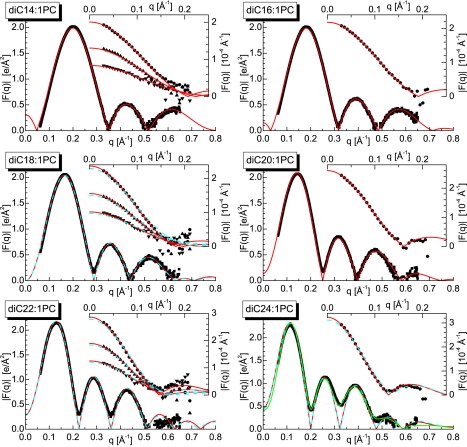
Unconstrained area fits to x-ray and neutron scattering form factors, F(q), for the various diCn:1PC bilayers at 30°C using the SDP model (solid red lines) and the fits using the areas/lipid from Lewis and Engelman (5) (blue dashed lines). The lower portions of the graphs display results of x-ray scattering experiments, whereas the upper portions present neutron scattering data. For some lipids (i.e., n = 14, 18, and 22), 100% D2O measurements were complemented with 70% and 50% D2O measurements. The graph for diC24:1PC x-ray data shows the results of two different fits corresponding to symmetric (minima = 0) and asymmetric profiles of ED distributions.
Fits to the x-ray form factors are shown in Fig. 2 and are in very good agreement over the entire q range (q < 0.65 Å−1). Such high-quality data typically result in high-resolution profiles revealing detailed structural features. In contrast, the figure shows neutron scattering data restricted to the low-q region (q < 0.2 Å−1), typical for SANS data from liquid crystalline bilayers in solution. Nevertheless, these low-q region data reflect the large scattering contrast between the lipid bilayer and the solvent, and contain robust information regarding the distribution of water and bilayer thickness. It is no surprise that the most intense scattering occurs from fully protonated bilayers in 100% D2O, whereas the least intense scattering is observed from bilayers dispersed in 50% D2O.
The x-ray data shown in Fig. 2 contain at least three distinct scattering lobes over the measured q range. These lobes shift to lower (thickening) or higher (thinning) q values, depending on the thickness of the bilayer. The same effect is also seen in neutron scattering data, although only the beginnings of the second lobe were observed, and then only for the longer-chain lipids. Despite their lower resolution, neutron data proved to be most important for determining lipid area (12). The sensitivity of the SDP model to various contrast scattering data is summarized in the Supporting Material.
X-ray scattering data from diC24:1PC bilayers reveal an interesting feature (Fig. 2). The minima between the lobes do not decay to zero intensity as they do for the other bilayers. We have previously observed something similar while studying charged lipid systems (17). We concluded that this “lift off” of the scattering minima indicates an asymmetric bilayer, most likely caused by bilayer curvature. We have also conclusively shown that similar-sized neutral, single-species lipid ULV bilayers are not affected by curvature. Nevertheless, it is possible that bilayers are more susceptible to this effect as their thickness increases. As a result, we have carefully analyzed the x-ray data shown in Fig. 2 (diC24:1PC) with a modified SDP model, allowing for the possibility of an asymmetric bilayer. Although one might fret over the manner in which the background was subtracted, the best fits to the data strongly suggest that it was robustly done. The use of the asymmetric model improved the best fit considerably (see Fig. 2), and the calculated ED profile shown in Fig. 3 reveals a substantial deviation from a symmetric bilayer.
Figure 3.
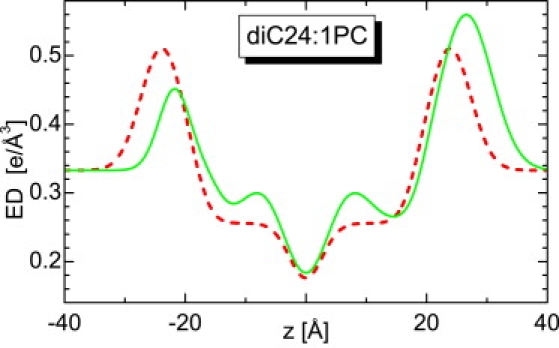
Comparison of symmetric and asymmetric ED profiles as obtained from fitting the SDP and modified SDP models to diC24:1PC x-ray scattering data.
Bilayer asymmetry mainly affects distributions in the polar headgroup, i.e., the region of high electron density. As a result, x-ray scattering form factors are quite sensitive to this structural feature. On the other hand, as was discussed, neutron scattering is mostly sensitive to the distribution of water and is rather insensitive to intrabilayer structure. As expected, the fitting analysis allowing for asymmetric bilayers did not change the neutron result. Since the overall bilayer parameters (A and DB) are not affected by bilayer asymmetry, we also evaluate A and DB for diC24:1PC bilayers.
Lipid bilayers, especially fully hydrated fluid-phase bilayers, are highly disordered systems that are best described by broad distributions rather than sharp δ functions (2). However, structural parameters averaged over the entire sample can be well defined. Here, we adopt the concept of the Gibbs dividing surface (as explained in the Materials and Methods section) to define these parameters. One of the important structural parameters when considering the hydrophobic matching of lipids and proteins is the hydrocarbon chain thickness, DC. The SDP model defines DC at the center of the error function, i.e., the hydrocarbon chain distribution (see Fig. 1). Another important parameter is the total bilayer thickness, DB, which we define as the Gibbs dividing surface for the water region (i.e., DB/2). As mentioned, and carefully explained previously (12), DB is robustly determined by neutron scattering and leads to the determination of A (i.e., A = 2VL/DB), assuming that lipid volume is already known (24). On the other hand, x-ray scattering is highly sensitive to electron-dense lipid headgroups, providing the head-to-head distance, DHH. All four parameters that describe the overall bilayer structure are shown in Table 1 (see the Supporting Material for more complete details).
Table 1.
Head-to-head distance, hydrocarbon thickness, bilayer thickness, and lateral area for the monounsaturated diacylphosphatidylcholines studied at 30°C
| DHH (Å) | DC (Å) | DB (Å) | A (Å2) | ALE (Å2) | |
|---|---|---|---|---|---|
| diC14:1PC | 29.6 | 11.7 | 33.7 | 64.2 | |
| diC16:1PC | 32.1 | 13.1 | 36.2 | 65.8 | |
| diC18:1PC | 36.8 | 14.5 | 38.9 | 66.9 | 73.0 ± 2.7 |
| diC20:1PC | 38.9 | 16.3 | 42.5 | 66.6 | |
| diC22:1PC | 45.5 | 18.2 | 46.4 | 65.7 | 70.1 ± 2.0 |
| diC24:1PC | 47.9 | 20.8 | 52.2 | 62.7 | 66.0 ± 1.9 |
Area uncertainty was estimated at ±1 Å2, leading to a thickness uncertainty of ∼2%. DHH, head-to-head distance; DC, hydrocarbon thickness; DB, bilayer thickness; A, lateral area; ALE, temperature-corrected area, from Lewis and Engelman (5).
In a pioneering work, Lewis and Engelman (5) studied three of the lipids described in this study (i.e., n = 18, 22, and 24) using small-angle x-ray scattering (SAXS) and paucilamellar vesicles. Compared to the Lewis and Engelman data, we find our DB values to be ∼2 Å larger (though they follow a similar trend), whereas our lipid areas are smaller by as much as 6 Å2 (Table 1, last column). A recent x-ray study (4) supported the Lewis and Engelman results for n = 18 and 22 bilayers, whereas recent neutron scattering data have suggested much smaller areas (25,26). It has been thought that this inconsistency between SANS and SAXS data was a result of the rudimentary models used to analyze SANS data. However, recently it was discovered (12) that although SAXS is more suitably applied to determine the internal structure of lipid bilayers, it can underestimate DB and A by as much as 10%, and that such estimation is thus a task better suited to SANS measurements. Consistent with previous findings, Fig. 2 shows that form factors calculated using previously reported areas (5) agree well when compared to appropriate x-ray scattering data (i.e., form factors), but not so well when compared to neutron scattering data. It is noteworthy that by combining both techniques in one analysis, the various bilayer parameters can be more accurately determined.
Fig. 4 shows the dependency of the bilayer structural parameters on hydrocarbon chain length, n. Both the hydrocarbon chain thickness, DC, and the overall bilayer thickness, DB, increase with n, exhibiting a small, but not negligible, deviation from linear behavior. Perhaps a more surprising result is how lipid area changes as a function of n (Fig. 4, lower). It increases first and then decreases with a maximum near n = 18. Although surprising at first, this behavior is consistent with the accepted notion that the volume of the individual lipid components is independent of the number and position of double bonds, and of the length of the acyl chains, and that the total volume is in fact linearly dependent on the number of carbons (24,27). As lipid volume is the direct result of lipid area and bilayer thickness, it follows that if bilayer thickness increases nonlinearly, the changes in area with changes in n will also be nonlinear.
Figure 4.
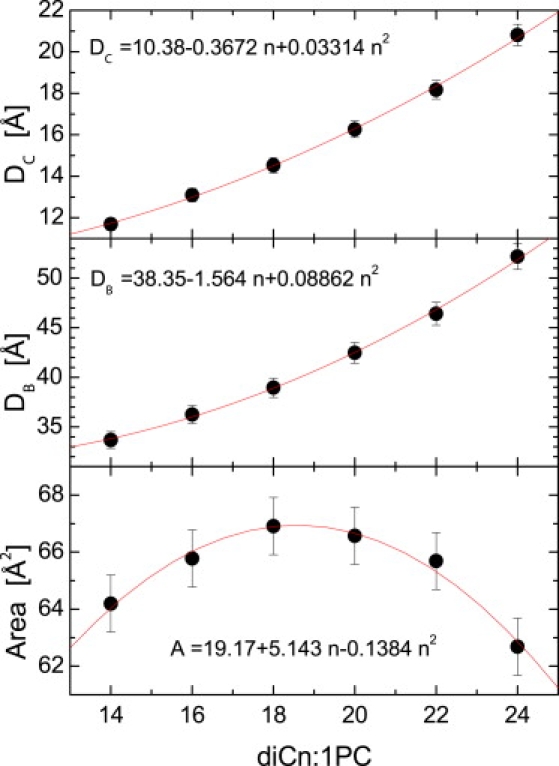
Bilayer structural parameters obtained through the simultaneous analysis of x-ray and neutron scattering data. Structural parameters of hydrocarbon thickness, DC, overall bilayer thickness, DB, and area/lipid, A, are plotted as a function of chain length, n. Data were fitted with a quadratic function.
The nonlinear behavior of bilayer thickness and lipid area can be explained in terms of double bond position. For bilayers of n = 14, 16, and 18, the double bond is at the 9-cis position, whereas for n = 20, 22, and 24 bilayers, the double bond is at the 11-cis, 13-cis, and 15-cis positions, respectively. As discussed by Karlovská et al. (28), increased hydrocarbon chain length results in increased van der Waals attraction, which in turn leads to an ordering of the hydrocarbon chains that effectively reduces the area/lipid. However, lipid chain disorder also depends on double bond position, and it presumably has the largest effect when the double bond is located in the middle of the hydrocarbon chain (29). Of considerable importance, this indicates that lipid area, the result of a fine balance between intrabilayer forces, is a good indicator of the lateral interactions within the bilayer.
We have compared our experimental results to those obtained from MD simulations. Bilayer simulations based on the MARTINI model (22) reproduced the nonmonotonic trend of lipid area dependence and qualitatively predicted the same effect of double bond position on lipid area. The black solid circles in Fig. 5 are the results for six lipids similar to those used in the experiment. However, due to the coarse-grained nature of the MARTINI model, the mapping between total number of carbons is somewhat arbitrary (i.e., an n = 20 hydrocarbon chain can also be an n = 18 hydrocarbon chain). As a result, we focused on the relative changes caused by the position of the double bond. It is clear that A increases with increasing chain length when the double bond's distance from the lipid headgroup remains constant (e.g., n = 12–20 in Fig. 5), in good agreement with our experimental results. For long chain lipids (n = 20–28 in Fig. 5), the distance of the double bond from the bilayer center was fixed, resulting in a decrease in lipid area as a function of increasing hydrocarbon chain length. Although this effect is not as pronounced as that observed experimentally, the softened behavior is most likely due to an underestimation of the enthalpic attraction between the tails in the coarse-grained simulations. Nevertheless, overall, these data support our experimental findings.
Figure 5.

Area/lipid obtained from coarse-grained MD simulations. The bead compositions were chosen to match the experimental conditions as closely as possible, taking into account the relative position of the double bonds. Results displayed with black solid dots roughly correspond to systems of diC12:1PC, diC16:1PC, diC20:1PC, diC24:1PC, and diC28:1PC. Green plus signs represent lipids with the double bond position fixed at the third bead from the headgroup; cyan crosses show results from simulations where the double bond was fixed with respect to the methyl terminus (ω6 position). Dashed arrows indicate points where double bonds were shifted away from the lipid headgroup region, toward the bilayer center. All points are labeled with the double bond position.
Additional simulations were performed to directly confirm the influence of the double bond's position, which was shown experimentally to be an important parameter (30). In simulations of n = 20, 24, and 28 bilayers, the double bond was shifted away from the lipid headgroup (Fig. 5, dashed arrows). This movement of the double bond resulted in a smaller area/lipid due to less disorder within the hydrocarbon chain region. It is obvious that changes in area follow a nonmonotonic trend, which levels off as the double bond gets closer to the headgroup. Qualitatively, the same results were observed by Martinez-Seara et al. (29,31). Further, when the double bond position was kept at a fixed distance from the headgroup (9-cis), the simulations showed an increase in area over the entire range of chain lengths, n = 12–28 (Fig. 5, green plus signs). On the other hand, lipid area decreased over the range n = 16–28 when the double bond position was fixed, with respect to the methyl terminus, at the ω6 position (Fig. 5, cyan crosses). This nonunique response of lipid area to the changes in acyl chain length confirms the importance of the double bond position, and suggests that much more work needs to be done to achieve a better understanding of the highly complex behavior of biological membranes.
Conclusions
In conclusion, recent developments in structural biophysics have allowed for the more precise determination of biomembrane properties. Through the simultaneous analysis of high-resolution x-ray and neutron scattering data, we were able to obtain robust bilayer structural parameters for a series of monounsaturated diacylphosphatidylcholines. Our experimental results show that as a function of increasing hydrocarbon chain length, bilayer thickness exhibits a nonlinear behavior. Of particular interest, area/lipid, in the case of commonly available monounsaturated diacylphosphatidylcholines, assumes a maximum for bilayers of length n = 18. This observation was corroborated with MD simulations that show the double bond's influence. With increasing n, the fine balance between attractive and repulsive intrabilayer forces results in an increase in area when the double bond's distance is fixed relative to the lipid's headgroup, whereas it decreases when the double bond is fixed relative to the bilayer center.
The results presented here can be used to better understand membrane-protein interactions that are known to depend on bilayer thickness and area/lipid. Perhaps more important, these results should serve as the foundation for the fine-tuning of the force fields used in various MD simulations, for which accurately known lipid areas are central. Finally, we encourage MD simulators not only to compare their simulation results with x-ray scattering data, but also to include neutron data, which are more sensitive to DB and, consequently, A.
Supporting Material
Two tables are available at http://www.biophysj.org/biophysj/supplemental/S0006-3495(09)01242-9.
Supporting Material
Acknowledgments
We thank Dr. Arthur Woll for assistance with the SAXS setup at the Cornell High Energy Synchrotron Source G-line (supported by the National Science Foundation and National Institutes of Health/National Institute of General Medical Sciences via National Science Foundation award DMR-0225180) and Dr. José Teixeira for help with SANS experiments at the Laboratoire Léon Brillouin PAXE spectrometer (supported by the European Commission Framework Programme 6 via contract RII3-CT-2003-505925).
This work was supported by the Joint Institute for Nuclear Research in Dubna project 07-4-1069-09/2011 and by the Scientific Grant Agency of Slovak Republic grant VEGA 1/0295/08.
References
- 1.Klauda J.B., Brooks B.R., MacKerell A.D., Venable R.M., Pastor R.W. An ab initio study on the torsional surface of alkanes and its effect on molecular simulations of alkanes and a DPPC bilayer. J. Phys. Chem. B. 2005;109:5300–5311. doi: 10.1021/jp0468096. [DOI] [PubMed] [Google Scholar]
- 2.Nagle J.F., Tristram-Nagle S. Structure of lipid bilayers. Biochim. Biophys. Acta. 2000;1469:159–195. doi: 10.1016/s0304-4157(00)00016-2. [DOI] [PMC free article] [PubMed] [Google Scholar]
- 3.Kučerka N., Nieh M.P., Pencer J., Harroun T., Katsaras J. The study of liposomes, lamellae and membranes using neutrons and x-rays. Curr. Opin. Colloid Interface Sci. 2007;12:17–22. [Google Scholar]
- 4.Kučerka N., Tristram-Nagle S., Nagle J.F. Structure of fully hydrated fluid phase lipid bilayers with monounsaturated chains. J. Membr. Biol. 2005;208:193–202. doi: 10.1007/s00232-005-7006-8. [DOI] [PubMed] [Google Scholar]
- 5.Lewis B.A., Engelman D.M. Lipid bilayer thickness varies linearly with acyl chain length in fluid phosphatidylcholine vesicles. J. Mol. Biol. 1983;166:211–217. doi: 10.1016/s0022-2836(83)80007-2. [DOI] [PubMed] [Google Scholar]
- 6.McIntosh T.J., Simon S.A. Area per molecule and distribution of water in fully hydrated dilauroylphosphatidylethanolamine bilayers. Biochemistry. 1986;25:4948–4952. doi: 10.1021/bi00365a034. [DOI] [PubMed] [Google Scholar]
- 7.Pabst G., Rappolt M., Amenitsch H., Laggner P. Structural information from multilamellar liposomes at full hydration: full q-range fitting with high quality x-ray data. Phys. Rev. E. 2000;62:4000–4009. doi: 10.1103/physreve.62.4000. [DOI] [PubMed] [Google Scholar]
- 8.Balgavý P., Dubničková M., Kučerka N., Kiselev M.A., Yaradaikin S.P. Bilayer thickness and lipid interface area in unilamellar extruded 1,2-diacylphosphatidylcholine liposomes: a small-angle neutron scattering study. Biochim. Biophys. Acta. 2001;1512:40–52. doi: 10.1016/s0005-2736(01)00298-x. [DOI] [PubMed] [Google Scholar]
- 9.Gordeliy V.I., Kiselev M.A. Definition of lipid membrane structural parameters from neutronographic experiments with the help of the strip function model. Biophys. J. 1995;69:1424–1428. doi: 10.1016/S0006-3495(95)80011-1. [DOI] [PMC free article] [PubMed] [Google Scholar]
- 10.King G.I., White S.H. Determining bilayer hydrocarbon thickness from neutron diffraction measurements using strip-function models. Biophys. J. 1986;49:1047–1054. doi: 10.1016/S0006-3495(86)83733-X. [DOI] [PMC free article] [PubMed] [Google Scholar]
- 11.Wiener M.C., White S.H. Fluid bilayer structure determination by the combined use of x-ray and neutron diffraction. I. Fluid bilayer models and the limits of resolution. Biophys. J. 1991;59:162–173. doi: 10.1016/S0006-3495(91)82208-1. [DOI] [PMC free article] [PubMed] [Google Scholar]
- 12.Kučerka N., Nagle J.F., Sachs J.N., Feller S.E., Pencer J. Lipid bilayer structure determined by the simultaneous analysis of neutron and x-ray scattering data. Biophys. J. 2008;95:2356–2367. doi: 10.1529/biophysj.108.132662. [DOI] [PMC free article] [PubMed] [Google Scholar]
- 13.Wiener M.C., White S.H. Fluid bilayer structure determination by the combined use of x-ray and neutron diffraction. II. ”Composition-space” refinement method. Biophys. J. 1991;59:174–185. doi: 10.1016/S0006-3495(91)82209-3. [DOI] [PMC free article] [PubMed] [Google Scholar]
- 14.Klauda J.B., Kučerka N., Brooks B.R., Pastor R.W., Nagle J.F. Simulation-based methods for interpreting x-ray data from lipid bilayers. Biophys. J. 2006;90:2796–2807. doi: 10.1529/biophysj.105.075697. [DOI] [PMC free article] [PubMed] [Google Scholar]
- 15.Anezo C., de Vries A.H., Holtje H.D., Tieleman D.P., Marrink S.J. Methodological issues in lipid bilayer simulations. J. Phys. Chem. B. 2003;107:9424–9433. [Google Scholar]
- 16.Sachs J.N., Petrache H.I., Woolf T.B. Interpretation of small angle x-ray measurements guided by molecular dynamics simulations of lipid bilayers. Chem. Phys. Lipids. 2003;126:211–223. doi: 10.1016/j.chemphyslip.2003.08.001. [DOI] [PubMed] [Google Scholar]
- 17.Kučerka N., Pencer J., Sachs J.N., Nagle J.F., Katsaras J. Curvature effect on the structure of phospholipid bilayers. Langmuir. 2007;23:1292–1299. doi: 10.1021/la062455t. [DOI] [PMC free article] [PubMed] [Google Scholar]
- 18.Pencer J., Krueger S., Adams C.P., Katsaras J. Method of separated form factors for polydisperse vesicles. J. Appl. Cryst. 2006;39:293–303. [Google Scholar]
- 19.Wiener M.C., Suter R.M., Nagle J.F. Structure of the fully hydrated gel phase of dipalmitoylphosphatidylcholine. Biophys. J. 1989;55:315–325. doi: 10.1016/S0006-3495(89)82807-3. [DOI] [PMC free article] [PubMed] [Google Scholar]
- 20.Nagle J.F., Wiener M.C. Relations for lipid bilayers. Connection of electron density profiles to other structural quantities. Biophys. J. 1989;55:309–313. doi: 10.1016/S0006-3495(89)82806-1. [DOI] [PMC free article] [PubMed] [Google Scholar]
- 21.Wiener M.C., White S.H. Structure of a fluid dioleoylphosphatidylcholine bilayer determined by joint refinement of x-ray and neutron diffraction data. III. Complete structure. Biophys. J. 1992;61:434–447. doi: 10.1016/S0006-3495(92)81849-0. [DOI] [PMC free article] [PubMed] [Google Scholar]
- 22.Marrink S.J., Risselada H.J., Yefimov S., Tieleman D.P., de Vries A.H. The MARTINI force field: coarse grained model for biomolecular simulations. J. Phys. Chem. B. 2007;111:7812–7824. doi: 10.1021/jp071097f. [DOI] [PubMed] [Google Scholar]
- 23.Van Der Spoel D., Lindahl E., Hess B., Groenhof G., Mark A.E. GROMACS: fast, flexible, and free. J. Comput. Chem. 2005;26:1701–1718. doi: 10.1002/jcc.20291. [DOI] [PubMed] [Google Scholar]
- 24.Uhríková D., Rybár P., Hianik T., Balgavý P. Component volumes of unsaturated phosphatidylcholines in fluid bilayers: a densitometric study. Chem. Phys. Lipids. 2007;145:97–105. doi: 10.1016/j.chemphyslip.2006.11.004. [DOI] [PubMed] [Google Scholar]
- 25.Gallová J., Uhríková D., Kučerka N., Teixeira J., Balgavý P. Hydrophobic thickness, lipid surface area and polar region hydration in monounsaturated diacylphosphatidylcholine bilayers: SANS study of effects of cholesterol and β-sitosterol in unilamellar vesicles. Biochim. Biophys. Acta. 2008;1778:2627–2632. doi: 10.1016/j.bbamem.2008.08.009. [DOI] [PubMed] [Google Scholar]
- 26.Kučerka N., Pencer J., Nieh M.P., Katsaras J. Influence of cholesterol on the bilayer properties of monounsaturated phosphatidylcholine unilamellar vesicles. Eur. Phys. J. E. 2007;23:247–254. doi: 10.1140/epje/i2007-10202-8. [DOI] [PubMed] [Google Scholar]
- 27.Koenig B.W., Gawrisch K. Specific volumes of unsaturated phosphatidylcholines in the liquid crystalline lamellar phase. Biochim. Biophys. Acta. 2005;1715:65–70. doi: 10.1016/j.bbamem.2005.07.006. [DOI] [PubMed] [Google Scholar]
- 28.Karlovská J., Uhríková D., Kučerka N., Teixeira J., Devínsky F. Influence of N-dodecyl-N, N-dimethylamine N-oxide on the activity of sarcoplasmic reticulum Ca2+-transporting ATPase reconstituted into diacylphosphatidylcholine vesicles: effects of bilayer physical parameters. Biophys. Chem. 2006;119:69–77. doi: 10.1016/j.bpc.2005.09.007. [DOI] [PubMed] [Google Scholar]
- 29.Martinez-Seara H., Rog T., Pasenkiewicz-Gierula M., Vattulainen I., Karttunen M. Effect of double bond position on lipid bilayer properties: insight through atomistic simulations. J. Phys. Chem. B. 2007;111:11162–11168. doi: 10.1021/jp071894d. [DOI] [PubMed] [Google Scholar]
- 30.Huang C.H. Mixed-chain phospholipids: structures and chain-melting behavior. Lipids. 2001;36:1077–1097. doi: 10.1007/s11745-001-0818-1. [DOI] [PubMed] [Google Scholar]
- 31.Martinez-Seara H., Rog T., Karttunen M., Reigada R., Vattulainen I. Influence of cis double-bond parametrization on lipid membrane properties: how seemingly insignificant details in force-field change even qualitative trends. J. Chem. Phys. 2008;129:105103. doi: 10.1063/1.2976443. [DOI] [PubMed] [Google Scholar]
Associated Data
This section collects any data citations, data availability statements, or supplementary materials included in this article.