

Abstract
Atomic force microscopy has recently provided highly precise measurements of mechanical properties of various viruses. However, molecular details underlying viral mechanics remain unresolved. Here we report atomic force microscopy nanoindentation experiments on T=4 hepatitis B virus (HBV) capsids combined with coarse-grained molecular dynamics simulations, which permit interpretation of experimental results at the molecular level. The force response of the indented capsid recorded in simulations agrees with experimental observations. In both experiment and simulation, irreversible capsid deformation is observed for deep indentations. Simulations show the irreversibility to be due to local bending and shifting of capsid proteins, rather than their global rearrangement. These results emphasize the viability of large capsid deformations without significant changes of the mutual positions of HBV capsid proteins, in contrast to the stiffer capsids of other viruses, which exhibit more extensive contacts between their capsid proteins than seen in the case of HBV.
Introduction
Viral capsids are protein shells assembled around the genetic material of viruses. The mechanics of capsids and their protein components plays a key role in the replication cycle of viruses, since a capsid should be stable to protect the virus from a hostile environment outside of host cells, but also needs to disassemble or otherwise release the viral genome at the onset of the infection process. Recently, mechanical properties of several viruses have been elucidated through atomic force microscopy (AFM) nanoindentation experiments (1–3) (Fig. 1 a), where the force response of a capsid to an AFM indentation is recorded in the form of a force-indentation (FZ) curve. Such AFM studies are performed in vitro and, therefore, do not directly capture the viral mechanics during the infection process. However, their results will likely improve our understanding of viral infection mechanisms (see, e.g., (4,5)), because mechanical properties probed by the AFM reflect interactions between individual capsid proteins, and these interactions also determine the structural changes of the capsid during the infection process. From AFM studies (1,4–12) it became clear that the observed FZ curve is specific to each virus, and may be different also for the same virus, depending on capsid isoform and whether the capsid is empty or not. Even for similarly sized viruses, such as MVM (8,9) and CCMV (6), the observed forces for the same indentation differ severalfold. Thus, capsid mechanical properties are determined by their molecular organization, rather than overall shape and size. However, molecular details underlying the observed capsid mechanics remain mostly unresolved.
Figure 1.
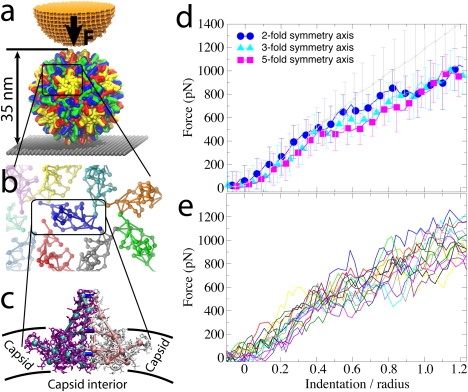
Experiments and CG simulations of AFM nanoindentations of the HBV T=4 capsid. (a) The capsid, composed of 240 identical protein units that form 120 homodimers, is attached to a surface (gray) and squeezed by the AFM tip (orange). (b) Arrangement of dimers (SBCG models) on the capsid surface, demonstrating their loose packing. (c) Within a dimer, the monomers (purple, white) are connected via extensive surface contacts. To model these contacts in the CG model, the monomers (cyan, pink) are connected by additional bonds (blue). (d) Force-indentation curves for the first round of AFM pushing, Zmax = 1.25R, averaged over all simulations for each pushing direction (color), and over all nanoindentation experiments (gray). Error bars are RMSD values. (e) Force-indentation curves for individual simulations with Zmax = 1.25R, each shown by a different color (data are averaged over 150-ns time windows).
Computational modeling, with its high spatial and temporal resolution, holds a great promise to correlate the molecular-level features of viruses with the observed force responses, but, due to the size of the viruses that is too large for all-atom simulations, and their organization that is too complex for simple physical modeling, simulating AFM nanoindentation experiments is extremely difficult. A recent all-atom simulation (13) provided a complete molecular picture of nanoindentation of the Southern Bean Mosaic virus capsid, but, to make the simulation computationally feasible, an unrealistically small indentation probe was employed over a timescale of only 1 ns (vs. ∼0.1 s in experiments). As a result, the observed forces of the capsid response to the load were extremely high, and a potential comparison with experiment would be challenging. Modeling AFM nanoindentation of a virus using finite-element simulations of a continuum material model produced many important insights (4,6,7,14–16) (see also (17–23)), but has been limited as the parameters of the simulated material require tuning to match experimental data. Furthermore, individual protein units are not resolved, and as a result specific molecular mechanisms behind the observed force response cannot be revealed. Because of these difficulties, the continuous material approach has not been able to describe irreversible capsid deformations, which commonly occur if the AFM nanoindentation is deep enough.
Here we show that the stated problems can be overcome through molecular dynamics (MD) simulations using the shape-based coarse-grained (SBCG) description (24–27) that is intermediate between atomistic and continuum descriptions (Fig. 1, a–c). We perform AFM experiments and SBCG simulations (Fig. 1, d and e) on the empty capsid of the human hepatitis B virus (HBV), in its T=4 form, for which a crystal structure is available (28) (average radius R = 145 Å). Previous AFM experiments on HBV (11) showed that, for low forces, the indentation is reversible. However, for higher indentations, irreversible deformations occur; and with SBCG simulations, we have been able to clarify the molecular mechanism behind this irreversibility, as described below.
Methods
AFM experiments are performed as described earlier (11). They consist of measurements in liquid with a Nanotec Electrónica AFM (Tres Cantos, Madrid, Spain) operated in jumping mode using rectangular Olympus cantilevers (Melville, NY) with a spring constant of 0.052 ± 0.002 (SD) N/m. Capsids are immobilized on hydrophobic glass coverslips (1).
For simulations, on average, 150 protein atoms are represented by one CG bead (Fig. 1, b and c). The SBCG model is constructed for one monomer of the T=4 HBV capsid protein (28), employing the topology-representing map algorithm (24,29) to distribute 15 CG beads according to the protein shape (Fig. 1 c). All atoms from the protein crystal structure that are closer to a given bead than to any other bead constitute the all-atom domain, or Voronoi cell, of that bead. The mass and charge of the Voronoi cell are assigned to the bead. Two beads are connected by a bond if a direct peptide bond exists between the respective two Voronoi cells (Fig. 1 c). The model is replicated to represent all 240 monomers (Fig. 1, a and b). In the T=4 capsid, monomers are connected into dimers through interactions between the monomers' hydrophobic surfaces. An additional disulfide bond occurs between two monomers within a dimer (involving the residue Cys61 from each of the two monomers) in the native virus, the bond being actually not essential for either dimer or capsid formation (28); in the AFM experiments, we use a mutant where the corresponding cysteine groups are replaced by alanines. The interface between two monomers within a dimer provides many specific interactions to maintain the monomers connected even without the disulfide bond. Therefore, such pairs of monomers are modeled in the SBCG representation as being connected by three intermonomer bonds (Fig. 1 c).
The total model potential V includes harmonic bond and angle terms for bonded beads, as well as Lennard-Jones (LJ) and Coulomb potentials for beads that are not bonded,
| (1) |
where Ri and θk are the distance and angle for bond i and angle k, Ki and Mk are the force constants, Li and Θk are the equilibrium bond length and angle, rmn is the distance between beads m and n, εmn and σmn are the LJ parameters, qm is the charge of the mth bead, and the sum over m and n runs over all pairs of CG beads (m ≠ n). The constant ɛ0 is the vacuum dielectric permittivity; ɛ is a relative dielectric constant. The protein bond and angle parameters are tuned to reproduce the monomer stiffness observed in an all-atom simulation, while the LJ parameters are tuned so that the spherical shape, diameter, and thickness of the capsid are reproduced in a CG simulation of a complete capsid without the AFM tip and substrate. With the present choice of parameters, we find that the Coulomb term in Eq. 1 amounts only to a few percent of nonbonded energy, which is dominated by the LJ contributions.
Dynamics of the coarse-grained system follows the classical equations of motion, described by the Langevin equation (24,26). Simulations are performed using the MD program NAMD (30). Graphics and analysis of simulations are realized with VMD (31).
The choice of the model described is determined mainly by two issues: the feasibility of simulations, and accessibility of the desired length and timescales. Since SBCG modeling employs the MD approach, with the same potential form (Eq. 1) as used for all-atom MD, SBCG simulations can be carried out efficiently using available MD software, such as NAMD (30). This pertains also to the accessibility of the desired length and timescales: the efficiency and robustness of NAMD are necessary to reach those scales. On the other hand, one has to choose the level of coarse-graining that permits fast computations and at the same time keeps enough molecular detail. In the case of the SBCG model, shapes of individual proteins are resolved, which gives a rather high level of detail, compared, e.g., to the continuous material approach. More detailed coarse-graining, such as the residue-based coarse-graining in which every amino acid is represented by 1–2 beads, can be employed as well (26), but would slow down the computations significantly.
SBCG model of the capsid
The T=4 hepatitis B virus (HBV) capsid is converted to the shape-based coarse-grained (SBCG) representation. The input all-atom structure is the HBV capsid protein monomer obtained from PDB entry 1QGT (28). The protein form used for the AFM experiments is the same as that used for obtaining the PDB structure (28) (protein sequence truncated at residue 149), and, thus, the SBCG model built using the 1QGT structure suits the comparison with our AFM experiments well.
The four independent copies of the capsid protein in the T=4 HBV capsid are found in different orientations, but overall in very similar conformations. A single SBCG model of the capsid monomer is replicated to conform to the orientations of the other three independent monomers, and the resulting asymmetric subunit is replicated 60 times to construct the full SBCG capsid. Each SBCG monomer consists of 15 beads, named A1, A2, …, A15. All other interactions within the capsid are nonbonded.
To neutralize the total charge of the capsid, 1440 ions are added to the system, being placed randomly within 20 Å from the capsid. As the total capsid charge is negative, each ion carries a charge of + 1|e| and a mass of 1150 Da, representing nine ions of mixed nature (such as both Na+ and Cl−) with their first hydration shells.
Parameterization of the model is described in detail in Supporting Methods in the Supporting Material. The parameterization is based on reproducing as much known information about the HBV T=4 capsid as possible, without employing the new AFM indentation results. Such information is, unfortunately, relatively scarce, as only the static structure of the capsid is known (28). An all-atom simulation of a capsid protein is therefore employed to extend the available information; stiffness of the protein obtained from this simulation is used to tune the bonded SBCG parameters. Nonbonded interactions are then tuned to match the known size and shape of the capsid.
SBCG model of the substrate and the AFM tip
Once the empty capsid has been parameterized, we introduce SBCG models for the substrate and the AFM tips (see Fig. 1 a), both modeled using a single bead type. Each bead carries zero charge and a mass of 2 kDa. The mass of the heaviest protein beads is close to 2 kDa, therefore, this value was chosen for the mass of the substrate and tip beads, to make the coarse-graining level similar to that of the protein. In both the substrate and AFM tip, the beads are arranged in a cubic lattice, 15 Å apart from each other (which is close to the average distance between beads in the protein model). The substrate and AFM tip materials are hydrophobic, while the HBV capsid surface is generally hydrophilic, but possesses some hydrophobic residues as well. Therefore, interactions between the substrate and AFM tip beads with any capsid bead are described by the LJ parameters σmn = 11 Å and ɛmn = 1 kcal/mol (compare to kBT ≈ 0.6 kcal/mol), which allows for weak nonspecific anchoring of the capsid on the substrate surface. Note that no parameter is further tuned in the subsequent nanoindentation simulations. Rather, all parameters are chosen based on simulations of the capsid on its own, and remain fixed after that. Thus, the results we obtain for the force-indentation curve are not tuned to match the experiment, but instead they are obtained independently, and the good agreement with experiment (see Results and Discussion) should be ascribed to the adequacy of the SBCG model.
Simulation details
The motion of the beads is described by classical mechanics with the Langevin equation of motion (24,26),
| (2) |
where r is the position of the bead, F is the force acting on the bead from other beads in the system, γ is a damping coefficient, g(t) is a three-dimensional vector, with each component being an independent univariate Gaussian random process, and χ is related to the frictional forces through the fluctuation-dissipation theorem,
with m being the bead's mass. This approach allows one to maintain a constant temperature of the system in a simulation, and at the same time the fluctuating and frictional forces in the Langevin equation represent the solvent viscosity and effect of the Brownian motion. Since χ is fixed through the fluctuation-dissipation theorem, the frictional and fluctuating forces are accounted for by the single parameter, γ. For the coarse-graining level of 150 atoms per CG bead, our previous work (26) showed that γ = 2 ps−1 gives good agreement with the experimental diffusion rates of a protein. Accordingly, γ = 2 ps−1 is used in this study.
The integration time step is Δt = 150 fs, and all times reported are actual simulation times (Δt times number of integration steps). Simulations are performed at T = 300 K.
The cutoff distance for nonbonded interactions is 20 Å. This distance is chosen to be smaller than the cutoff for choosing interacting pairs of beads, = 24 Å, because some bead pairs with specific interactions assigned occur at distances above, but close to, 24 Å in the native capsid structure. With the cutoff distance for simulations set to 24 Å, thermal fluctuations would bring many beads that are originally >24 Å apart, within the interaction range, and the specific interactions assigned to such bead pairs would drive the pairs toward the minima of their interactions, which are typically at 20 Å or below. This would result in distortions of the structure. Choosing a smaller cutoff distance for simulations, such as 20 Å, largely allows one to avoid such problems.
The beads of the substrate are fixed at their initial positions. The AFM tip is constrained in the x-y plane to remain on the same axis as initially positioned; this axis is parallel to the z direction and runs through the center of the capsid. In the z dimension, the tip is free to move, while a harmonic force is applied to the center-of-mass of the tip in this dimension, to result in the constant velocity pushing, referred to as steered molecular dynamics (SMD) (32,33). The SMD force constant is 5 kcal/(mol Å2), and the usual pushing velocity is 23 Å/μs, although simulations with faster and slower pushing have been performed as well (see Supporting Material).
Averaging of data
In simulations, the force-indentation (i.e., FZ) curves are obtained as data sets of simultaneous measurement of the position of the AFM tip center-of-mass and of the force experienced by the AFM tip as a whole. The position can be translated then into an indentation depth: computing the distance between the AFM tip center-of-mass and its bottom surface, one finds the position of the bottom surface and compares it with the initial capsid height, thereby obtaining the indentation depth. Since the shape of the AFM tip remains essentially the same during the simulations, the distance between its center-of-mass and bottom surface is constant within a few Å. The raw data are taken every 1.5 ns. An example of raw FZ curves from simulations is shown in Fig. S4. For the sake of clarity, the individual simulated FZ curves shown in all other figures are averaged over time windows of 150 ns.
To aggregate data from multiple simulations or experiments, both position and force of the FZ curves are averaged at each time step over experiments or simulations, resulting in the plots that can be seen in Fig. 1 d and Fig. 2. An analogous procedure is performed for energies, such as in Figs. 3 and 4. The error bars are the corresponding root mean-square deviations (RMSD).
Figure 2.
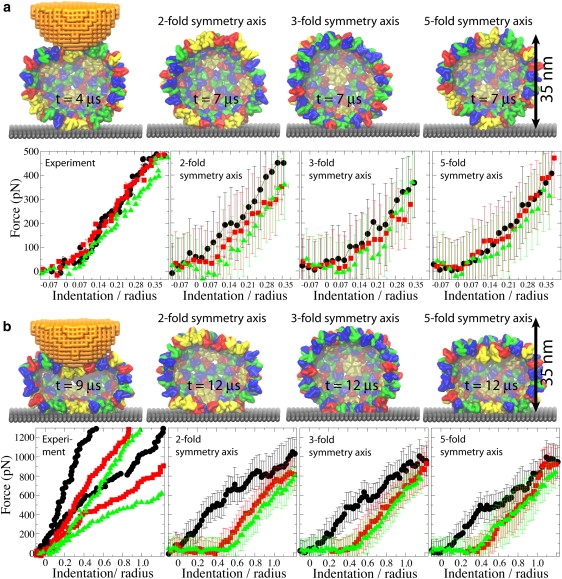
Three rounds of repeated pushing. (a) Pushing with Zmax = 0.35R. (b) Pushing with Zmax = 1.25R. The images of the capsid on the left show conformations at the time of the maximum indentation; the remaining images show the capsid structure during relaxation, for each of the pushing directions. (FZ curves) First round, black; second round, red; and third round, green. The experimental curves show indentations of individual capsids. In the left plot in panel b, results of two independent experiments are shown. The curves labeled as two-, three-, and fivefold symmetry axis, are the simulated curves averaged over all simulations for each pushing direction.
Figure 3.
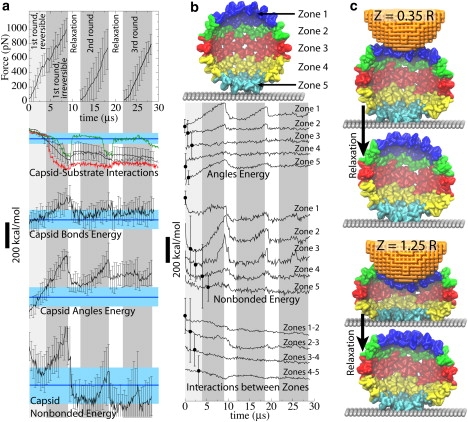
Contributing factors for the observed force-indentation profiles. (a) Force is plotted versus time for three repeated rounds of pushing. Energies for various interactions in the system are all drawn to scale (bar, 200 kcal/mol). (Black) Average over all simulations with Zmax = 1.25R (error bars are the averaging RMSDs). (Blue) The value of the average over all simulations with Zmax = 0.35R and over time t > 4 μs (light blue shade, RMSD). (Green and red) Capsid-substrate interaction energy from two individual simulations. (b) The capsid is divided into five zones heightwise. Contributions from each zone to the angle and nonbonded energies are shown, averaged over all simulations; average deviations from the mean are shown as error bars, one for each curve. In panels a and b, the periods of pushing and relaxation are highlighted in gray and white (the initial pushing with indentation ≤0.35R is highlighted by light gray). (c) Examples of deformations of each zone in individual simulations, at the point of maximum indentation and after relaxation.
Figure 4.
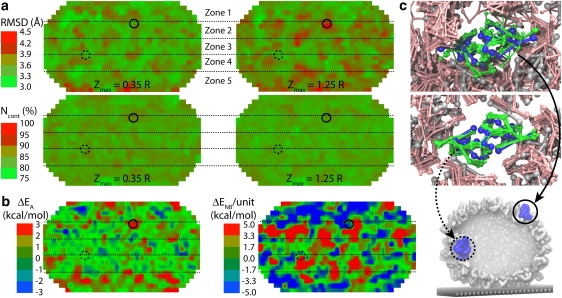
Maps of capsid deformation. The bottom of each map corresponds to the contact with the substrate; the AFM tip is at the top. Each quantity shown is for individual capsid monomers, averaged over all simulations (systems with different pushing directions were aligned with respect to initial positions of the AFM tip and substrate). (a) RMSD and number of native contacts, Ncont, of each monomer for simulations with the maximum indentations Zmax = 0.35R and 1.25R. (b) Difference between monomer energy averaged over all simulations with Zmax = 1.25R and that averaged over all simulations with Zmax = 0.35R, for angle conformational energy (ΔEA) and nonbonded LJ energy (ΔENB). (c) Examples of protein units that are relatively strongly (top) and weakly (middle) deformed in one of the simulations. Initial structures for chosen dimers and for the rest of the capsid are in blue and gray; snapshots from a number of frames (during relaxation after the first pushing, Zmax = 1.25R) are in green and pink. The whole capsid is shown at the bottom. Locations of the two dimers are shown in the maps in panels a and b by solid and dashed circles. Locations of the five zones (Fig. 3) are shown by dotted lines.
Results and Discussion
We perform simulations with maximum indentation Zmax = 0.35R, or 50 Å, and Zmax = 1.25R, or 180 Å (180 Å is the outer capsid radius). For both Zmax = 0.35R and Zmax = 1.25R, we carry out five simulations pushing the capsid along its fivefold symmetry axis, five along the threefold, and five along the twofold axis. Three repeated rounds of pushing are done in each simulation. Simulations are performed using steered MD (SMD) (32), where the AFM tip is moved with a constant velocity (23 Å/μs) along the vertical axis (Fig. 1 a; see also Fig. S4). The indentation of 1.25R is reached within 8 μs, vs. ∼0.1 s in experiment.
Force response of the HBV capsid to AFM nanoindentations
Fig. 1 d shows averaged FZ curves. The data show a remarkable agreement between simulation and experiment, which is near perfect (within <0.5 of RMSD) for indentations of up to ∼0.4R, and for larger indentations the experimental and simulated curves remain within a factor of 1.5 from each other (and within the experimental RMSD). Individual simulated FZ curves are shown in Fig. 1 e.
The error bars (RMSD) of the force for the experimental curve in Fig. 1 d are larger than for the simulated curves. The same is observed for RMSD of the indentation depth (omitted for clarity in the figure), which measures typically a few Å in simulations and ∼20 Å in the experiment. These differences are likely due to some amount of biological variation of the studied capsids, including differences in capsid structure, and to physical variation of the substrate surface and the AFM tips. The simulations are more uniform as they use an ideal capsid structure, the same substrate and tip, and the pushing is focused precisely on the capsid center. Furthermore, simulations employ faster pushing than in experiment, which induces indentations of the capsid in each trial to follow approximately the same path, because there is not enough time for fluctuations of the structure to lead to significantly different capsid conformations.
The close agreement between the simulated and experimental FZ curves is observed despite the difference in the pushing speed, and despite the fact that the tuning of the SBCG model was based solely on reproducing spherical shape and size of a free capsid. This tuning, although reasonable, leaves the predictive power of the SBCG model to be limited. Indeed, as the capsid is deformed further away from its native shape, a larger discrepancy between simulated and experimental FZ curves is observed (Fig. 1 d). Nevertheless, our results show that our relatively simple model, which captures key capsid geometry and interactions between the capsomers, allows one to obtain quantitative results on mechanical properties of capsids. Previous studies of capsids (24) employing the SBCG model also agreed with experiments and all-atom simulations (34).
For simulations with three rounds of pushing performed, one observes reversible behavior of the force response for Zmax = 0.35R (see Fig. 2 a, Fig. S5 and Fig. S7, and Movie S1), whereas for Zmax = 1.25R the capsid deformation is clearly irreversible (see Fig. 2 b, Fig. S6 and Fig. S8, and Movie S2). This result agrees with experiments, which show that the HBV capsid deforms reversibly if the indentation is stopped at Zmax = 0.35R to 0.55R (11), and irreversibly for larger indentations.
In the reversible regime (Zmax = 0.35R), the simulated and FZ curves overlap within the simulation RMSD (see also Fig. 1 d). The simulated FZ curves for the first, second, and third pushing round are, at most, separated by 200 pN, but most of the time they are much closer. The experimental curves (as well as simulated curves for the fivefold symmetry axis) are within, at most, 100 pN from each other. These separations between the curves from different rounds are also well within the simulation RMSD in all cases. In experiments, the curve for the third round runs below that from the first round. SBCG simulations reproduce this effect and shed light on its origin. Fig. 2 a demonstrates that even for Zmax = 0.35R, after the AFM tip is removed, the capsid deformation is not eliminated completely.
For Zmax = 1.25R, the capsid height remains reduced by 0.4R after the load is removed (Fig. 2 b). In both simulation and experiment, the force response reduces from one round to the next, so that at Z = 1.25R it is ∼100−200 pN smaller than in the first round. The largest discrepancy between simulation and experiment is observed for such irreversible indentations: while the simulated curves show that the capsid height remains reduced after the AFM tip retracts, experimental curves indicate nearly full capsid height recovery in each round. Most likely, this is due to the difference in the relaxation time between the pushing cycles, which is ∼1 s in experiment and only a few microseconds in simulation. However, on closer inspection, a capsid deformation persisting after tip retraction is evident in the experiment as well, where we find that after five pushing cycles the capsid height decreases by ∼10%.
The simulated FZ curves for indentations along each of the three symmetry axes of the virus diverge when indentations are between 0.4R and 1.0R, with the maximum difference being ∼200 pN at Z ∼0.6R (Fig. 1 d and Fig. 2). The curve for the twofold symmetry axis lies above the others, while that for the fivefold symmetry axis lies below the others, and the one for the threefold symmetry axis lies in between. The curve for the fivefold symmetry axis also exhibits a characteristic plateau between indentations of 0.4R and 0.7R (Fig. 1 d).
Molecular-level interactions during AFM nanoindentations
The indentation of HBV capsids becomes irreversible at Zmax > 0.35R–0.55R, and average FZ curves (Fig. 1 d) exhibit a nonlinearity arising at the same indentation level (finishing at 0.8R–1.0R). Considering a straight line connecting the origin of the plot with the FZ curve at large indentations (e.g., 1.25R), the nonlinearity in both experiment and simulation corresponds to forces lying above this line, i.e., the FZ curve is slightly convex. Contributions of various factors toward this effect are analyzed in Fig. 3. Energies of bonded, angle, and nonbonded interactions (see Eq. 1) within the capsid, as well as capsid-substrate interaction, are shown. The energies averaged over all simulations with Zmax = 0.35R remain well within their RMSD level during the periods of indentation and relaxation (see Supporting Results and Fig. S9 in the Supporting Material). Thus, their time averages are drawn as blue lines (average) with light blue shades (RMSD) in Fig. 3 a, characterizing the state of a reversibly deformed capsid. Deviations of black curves (Zmax = 1.25R) from the reference given by the blue lines characterizes the difference between the reversible and irreversible deformations. To analyze the contributions from different parts of the capsid, we divide the capsid into a number of zones heightwise (Fig. 3, b and c; each zone has approximately the same number of monomers).
During the reversible pushing, the analyzed energies change smoothly; the nonbonded energy is even reduced as some favorable contacts between capsomers are established. In the analysis, a significant rise is observed in the nonbonded energy (which corresponds mostly to interactions between different monomers), followed by the angle energy (monomer bending), while the bonded energy (monomer stretching) does not change as much. This happens as the AFM tip bends the upper set of capsomers (Zone 1) and touches Zone 2, resulting in a significantly larger area of the capsid-tip interaction than before and leading to a nonlinear increase of the force, in agreement with the continuum material simulation of a similarly shaped CCMV capsid (16). Another prominent change occurs in the capsid-substrate interactions. Examples from individual simulations (red and green curves in Fig. 3 a) show that the capsid-substrate energy experiences sudden jumps. This happens as Zone 4, which originally does not touch the substrate, makes contacts with the latter. The two bottom snapshots in Fig. 3 c show a simulation in which Zone 4 touched the substrate at indentations close to 1.25R, and then separated from the substrate during relaxation, leading to the capsid-substrate interaction profile highlighted in green in Fig. 3 a. In some of the simulations, Zone 4 remains attached to the substrate after the relaxation, resulting in a curve such as the red one in Fig. 3 a.
The angles, nonbonded and capsid-substrate interaction energies demonstrate irreversible behavior: they do not return to their initial values (or to Zmax = 0.35R averages) during the relaxation, while the bonded energy does. Thus, the FZ curve nonlinearity and the origin of the irreversible deformation should be ascribed to establishing more contacts between capsid and substrate, as well as to bending and shifting of monomers due to more extensive contacts with the AFM tip. Passing the indentation of ∼1.0R, one does not observe significant changes in the distribution of capsid-tip or capsid-substrate contacts, and the FZ curves become linear again.
Deformations and corresponding changes in interaction energies are distributed nonuniformly across the capsid (Fig. 3 b). Capsid poles (Zones 1 and 5) exhibit the most changes in angle energy (monomer bending), as they are deformed by direct contacts with the AFM tip and the substrate (Fig. 3 c). The nonbonded energy changes, corresponding to the monomer rearrangement, are most prominent in Zones 2 and 3, i.e., near the equator of the capsid. Energy of interactions between zones does not vary significantly, showing that the force response is mainly caused by bending and local shifting of monomers, rather than large-scale rearrangements of the capsid structure.
Maps characterizing behavior of individual capsid monomers are shown in Fig. 4. The properties analyzed are computed for each monomer and averaged over all simulations for the 1-μs time period at the end of the first relaxation. The surface of the capsid is projected on a plane using Kavrayskiy's cartographic mapping (35), so that the upper and lower parts of the map correspond to the capsid poles facing the AFM tip and the substrate, respectively. For simulations with indentations along different directions, the simulated systems are rotated for the mapping so that the initial position of the AFM tip and the substrate are aligned. With enough sampling, one expects that the maps should become uniform in the longitudinal direction. This is not the case for our limited sampling set of 15 simulations, but one can already notice uniformity of the mapped features along that direction.
The average RMSD of the monomer structure (Fig. 4 a) ranges from 2.9 Å to 4.7 Å, a maximum change of >50%. For simulations with Zmax = 0.35R, the RMSD map is relatively uniform, with a few hot spots, whereas for simulations with Zmax = 1.25R, prominent hot spots arise corresponding to strong deformation (bending) of monomers. This change is most obvious for polar regions (Zones 1 and 5), which contact the AFM tip and the substrate from the start, but it also propagates to Zones 2 and 3, which contact the tip and the substrate after the indentation is sufficiently deep. In contrast, one observes a uniform map for the fraction of native contacts Ncont, which is defined for each monomer as the number of CG beads from other monomers that are within the radius of 20 Å from the first monomer, taken as a ratio to the same number for the original capsid structure (20 Å is the cutoff radius for the nonbonded interactions in our CG simulations, see Methods). Ncont averaged over all simulations is found to be in the same narrow range, 75–89%, for both Zmax = 0.35R and 1.25R. The Ncont maps for the two cases are quite similar and relatively featureless. This means that the arrangement of monomers is almost unaffected by the indentation, i.e., the local structure of the capsid remains the same, even though the capsid is strongly deformed globally.
We also map the change ΔE in the energy of each monomer between the Zmax = 1.25R and Zmax = 0.35R cases (Fig. 4 b), for the angle and nonbonded interactions (ΔEA and ΔENB). Global energy changes observed in Fig. 3 a, when divided by the total number of monomers, 240, set a natural scale for per-monomer energy changes (1.1 kcal/mol for ΔEA and 1.7 kcal/mol for ΔENB). The maps are plotted in the range of ±3 such units; the actual variation is −4.7 to 4.3 kcal/mol for ΔEA and −17.5 to 15.5 kcal/mol for ΔENB (the thermal energy is kBT ≈ 0.6 kcal/mol). The maps in Fig. 4 b show changes between the Zmax = 1.25R and Zmax = 0.35R cases, especially in Zones 1 and 5, and to a lesser extent for ΔEA in Zones 2 and 4. The equatorial Zone 3 remains relatively unaffected in many indentation trials. Interestingly, ΔENB is mainly negative in Zones 1 and 5, and mostly positive in Zones 2 and 4. This observation shows that direct interactions with the AFM tip and substrate at Zones 1 and 5 during irreversible deformation displace capsid proteins toward a slightly more favorable arrangement than during the reversible indentation, whereas protein shifting in Zones 2 and 4, caused by the propagation of strain from the poles brings about some relatively unfavorable clashes between neighboring proteins in case of Zmax = 1.25R.
The maps in Fig. 4, a and b, show that the irreversibility of the deformation for Zmax = 1.25R is caused by strong changes in nonbonded interaction energy and in angle (monomer bending) energy, but, although the monomer bending (RMSD) is clearly affected by the strong deformation, the mutual arrangement of monomers, characterized by Ncont, hardly changes at all. This is also obvious from visual analysis of the snapshots from simulations, illustrated in Fig. 4 c. The dimer at the top of Fig. 4 c exhibits large-scale bending and is mobile, while the one at the bottom is moving less, which is reflected in the RMSD maps. However, the position and orientation of these dimers, with respect to surrounding capsomers, are not significantly affected, and the shifting and sliding observed amounts to only a 10–20% change in Ncont. Thus, the origin of the indentation irreversibility is the local bending and slight rearrangement of capsomers, and not their stretching, sliding, or global rearrangements of the capsid structure.
Conclusion
Our combined experimental and computational study provides a high-resolution picture of the capsid deformation in AFM nanoindentations. To our knowledge, this study is the first to reproduce irreversible deformation of capsids using a computational approach. The simulated force response is in qualitative agreement with experiments for both reversible and irreversible deformation. These results are obtained without tuning the material properties of the model to match experimental force-indentation (FZ curves). The SBCG approach distinguishes molecular detail at the level of individual proteins and reveals that the experimentally observed nonlinearity in the FZ curve is due to capsid-substrate interactions, monomer bending, and slight shifting of capsid proteins with respect to each other. Likewise, the irreversibility of deep indentations is seen to originate from small, local changes of capsid proteins arrangement and protein bending (but not stretching), rather than from global rearrangement. Thus, the SBCG MD approach, systematically parameterized based on the atomic-level equilibrium structure of the capsid, is a powerful tool for molecular-level studies of viral mechanics.
The HBV T=4 capsid is a relatively small, spherical, and homogeneous virus shell, with loose protein packing (28) (Fig. 1). Capsids of many other viruses exhibit a capsomer organization with extensive protein-protein contacts, which greatly affect the mechanical stability of the capsids (24,34). For instance, examination of capsid structures for MVM (36) and bacteriophages ϕ29 (37) and λ (38), which have been studied by AFM nanoindentations (1,8,10), shows that these capsids exhibit much more extensive protein-protein contacts than in the case of HBV. Our study suggests that these differences in capsid protein organization underlie the differences in Young's moduli of various viral capsids, as recorded in AFM experiments. Young's modulus is a geometry-independent parameter that characterizes the stiffness of the capsid material (3), and its value is <0.5 GPa for HBV and CCMV (6,11), and ≥1.0 GPa for MVM and bacteriophages λ and ϕ29 capsids (1,8,10). Thus, the HBV capsid, as well as the similarly loosely packed CCMV capsid, are less stiff than the capsids of the other three viruses. Furthermore, the λ and ϕ29 capsids break at indentations of 20–25% of their radius and show material fatigue under repeated small indentations (10). In contrast, irreversible deformations arise at ∼60% of R for HBV, and HBV capsids do not show signs of fatigue after tens of shallow indentations (11).
Our results show that large-scale deformations of the HBV capsid occur without disruptions of local capsomer order, i.e., without capsid failure, and that slight changes in this order and bending of capsomers can produce significant effects, such as locking the capsid in a deformed conformation. For viruses such as MVM and bacteriophages λ and ϕ29, the deformation scenario should be different, as the capsomers are interlocked with each other, leading to a stiffer capsid and more local deformations upon force application than in the case of HBV. The tight interlocking is also difficult to restore once it is broken, resulting in a stiff, but relatively brittle capsid and in capsid failure upon strong deformation; the weak surface contacts of HBV capsomers make the HBV capsid rather more plastic and allow the capsid geometry to undergo smooth transitions.
Supporting Material
Two movies and nine figures are available at http://www.biophysj.org/biophysj/supplemental/S0006-3495(09)01298-3.
Supporting Material
Acknowledgments
This work was supported through National Institutes of Health grant No. P41-RR005969 (to K.S.), and by the Nederlandse Organisatie voor Wetenschappelijk Onderzoek through a Chemische Wetenschappen-Excellent Chemisch Onderzoek (CW-ECHO) grant (to G.J.L.W.) and a Rubicon grant (to W.H.R.). A.A. was supported by the L. S. Edelheit fellowship. The authors acknowledge supercomputer time provided by National Science Foundation (Large Resources Allocation Committee grant No. MCA93S028) and through the University of Illinois.
References
- 1.Ivanovska I.L., de Pablo P.J., Ibarra B., Sgalari G., MacKintosh F.C. Bacteriophage capsids: tough nanoshells with complex elastic properties. Proc. Natl. Acad. Sci. USA. 2004;101:7600–7605. doi: 10.1073/pnas.0308198101. [DOI] [PMC free article] [PubMed] [Google Scholar]
- 2.Roos W.H., Ivanovska I.L., Evilevitch A., Wuite G.J.L. Viral capsids: mechanical characteristics, genome packaging and delivery mechanisms. Cell. Mol. Life Sci. 2007;64:1484–1497. doi: 10.1007/s00018-007-6451-1. [DOI] [PMC free article] [PubMed] [Google Scholar]
- 3.Roos W.H., Wuite G.J.L. Nanoindentation studies reveal material properties of viruses. Adv. Mater. 2009;21:1187–1192. [Google Scholar]
- 4.Kol N., Shi Y., Tsvitov M., Barlam D., Shneck R.Z. A stiffness switch in human immunodeficiency virus. Biophys. J. 2007;92:1777–1783. doi: 10.1529/biophysj.106.093914. [DOI] [PMC free article] [PubMed] [Google Scholar]
- 5.Liashkovich I., Hafezi W., Kühn J.E., Oberleithner H., Kramer A. Exceptional mechanical and structural stability of HSV-1 unveiled with fluid atomic force microscopy. J. Cell Sci. 2008;121:2287–2292. doi: 10.1242/jcs.032284. [DOI] [PubMed] [Google Scholar]
- 6.Michel J.P., Ivanovska I.L., Gibbons M.M., Klug W.S., Knobler C.M. Nanoindentation studies of full and empty viral capsids and the effects of capsid protein mutations on elasticity and strength. Proc. Natl. Acad. Sci. USA. 2006;103:6184–6189. doi: 10.1073/pnas.0601744103. [DOI] [PMC free article] [PubMed] [Google Scholar]
- 7.Kol N., Gladnikoff M., Barlam D., Shneck R.Z., Rein A. Mechanical properties of Murine Leukemia virus particles: effect of maturation. Biophys. J. 2006;91:767–774. doi: 10.1529/biophysj.105.079657. [DOI] [PMC free article] [PubMed] [Google Scholar]
- 8.Carrasco C., Carreira A., Schaap I.A.T., Serena P.A., Gomez-Herrero J. DNA-mediated anisotropic mechanical reinforcement of a virus. Proc. Natl. Acad. Sci. USA. 2006;103:13706–13711. doi: 10.1073/pnas.0601881103. [DOI] [PMC free article] [PubMed] [Google Scholar]
- 9.Carrasco C., Castellanos M., de Pablo P.J., Mateu M.G. Manipulation of the mechanical properties of a virus by protein engineering. Proc. Natl. Acad. Sci. USA. 2008;105:4150–4155. doi: 10.1073/pnas.0708017105. [DOI] [PMC free article] [PubMed] [Google Scholar]
- 10.Ivanovska I., Wuite G., Jönsson B., Evilevitch A. Internal DNA pressure modifies stability of WT phage. Proc. Natl. Acad. Sci. USA. 2007;104:9603–9608. doi: 10.1073/pnas.0703166104. [DOI] [PMC free article] [PubMed] [Google Scholar]
- 11.Uetrecht C., Versluis C., Watts N.R., Roos W.H., Wuite G.J.L. High-resolution mass spectrometry of viral assemblies: molecular composition and stability of dimorphic Hepatitis B virus capsids. Proc. Natl. Acad. Sci. USA. 2008;105:9216–9220. doi: 10.1073/pnas.0800406105. [DOI] [PMC free article] [PubMed] [Google Scholar]
- 12.Roos W.H., Radtke K., Kniesmeijer E., Geertsema H., Sodeik B. Scaffold expulsion and genome packaging trigger stabilization of Herpes Simplex virus capsids. Proc. Natl. Acad. Sci. USA. 2009;106:9673–9678. doi: 10.1073/pnas.0901514106. [DOI] [PMC free article] [PubMed] [Google Scholar]
- 13.Zink M., Grubmüller H. Mechanical properties of the icosahedral shell of Southern Bean Mosaic virus: a molecular dynamics study. Biophys. J. 2009;96:135–163. doi: 10.1016/j.bpj.2008.11.028. [DOI] [PMC free article] [PubMed] [Google Scholar]
- 14.Klug W.S., Bruinsma R.F., Michel J.P., Knobler C.M., Ivanovska I.L. Failure of viral shells. Phys. Rev. Lett. 2006;97:228101. doi: 10.1103/PhysRevLett.97.228101. [DOI] [PubMed] [Google Scholar]
- 15.Gibbons M.M., Klug W.S. Nonlinear finite-element analysis of nanoindentation of viral capsids. Phys. Rev. E Stat. Nonlin. Soft Matter Phys. 2007;75:031901. doi: 10.1103/PhysRevE.75.031901. [DOI] [PubMed] [Google Scholar]
- 16.Gibbons M.M., Klug W.S. Influence of nonuniform geometry on nanoindentation of viral capsids. Biophys. J. 2008;95:3640–3649. doi: 10.1529/biophysj.108.136176. [DOI] [PMC free article] [PubMed] [Google Scholar]
- 17.Lidmar J., Nelson L.M.D.R. Virus shapes and buckling transitions in spherical shells. Phys. Rev. E Stat. Nonlin. Soft Matter Phys. 2003;68:051910. doi: 10.1103/PhysRevE.68.051910. [DOI] [PubMed] [Google Scholar]
- 18.Nguyen T.T., Bruinsma R.F., Gelbart W.M. Elasticity theory and shape transitions of viral shells. Phys. Rev. E Stat. Nonlin. Soft Matter Phys. 2005;72:051923. doi: 10.1103/PhysRevE.72.051923. [DOI] [PubMed] [Google Scholar]
- 19.Vliegenthart G.A., Gompper G. Mechanical deformation of spherical viruses with icosahedral symmetry. Biophys. J. 2006;91:834–841. doi: 10.1529/biophysj.106.081422. [DOI] [PMC free article] [PubMed] [Google Scholar]
- 20.Widom M., Nelson J.L.D.R. Soft modes near the buckling transition of icosahedral shells. Phys. Rev. E Stat. Nonlin. Soft Matter Phys. 2007;76:031911. doi: 10.1103/PhysRevE.76.031911. [DOI] [PubMed] [Google Scholar]
- 21.Zlotnick A. Are weak protein-protein interactions the general rule in capsid assembly? Virology. 2003;315:269–274. doi: 10.1016/s0042-6822(03)00586-5. [DOI] [PubMed] [Google Scholar]
- 22.Nguyen H.D., Reddy V.S., Brooks C.L. Invariant polymorphism in virus capsid assembly. J. Am. Chem. Soc. 2009;131:2606–2614. doi: 10.1021/ja807730x. [DOI] [PMC free article] [PubMed] [Google Scholar]
- 23.Bourne C.R., Finn M.G., Zlotnick A. Global structural changes in Hepatitis B capsids induced by the assembly effector HAP1. J. Virol. 2006;80:11055–11061. doi: 10.1128/JVI.00933-06. [DOI] [PMC free article] [PubMed] [Google Scholar]
- 24.Arkhipov A., Freddolino P.L., Schulten K. Stability and dynamics of virus capsids described by coarse-grained modeling. Structure. 2006;14:1767–1777. doi: 10.1016/j.str.2006.10.003. [DOI] [PubMed] [Google Scholar]
- 25.Arkhipov A., Freddolino P.L., Imada K., Namba K., Schulten K. Coarse-grained molecular dynamics simulations of a rotating bacterial flagellum. Biophys. J. 2006;91:4589–4597. doi: 10.1529/biophysj.106.093443. [DOI] [PMC free article] [PubMed] [Google Scholar]
- 26.Arkhipov A., Yin Y., Schulten K. Four-scale description of membrane sculpting by BAR domains. Biophys. J. 2008;95:2806–2821. doi: 10.1529/biophysj.108.132563. [DOI] [PMC free article] [PubMed] [Google Scholar]
- 27.Yin Y., Arkhipov A., Schulten K. Simulations of membrane tubulation by lattices of amphiphysin N-BAR domains. Structure. 2009;17:882–892. doi: 10.1016/j.str.2009.03.016. [DOI] [PMC free article] [PubMed] [Google Scholar]
- 28.Wynne S.A., Crowther R.A., Leslie A.G.W. The crystal structure of the human Hepatitis B virus capsid. Mol. Cell. 1999;3:771–780. doi: 10.1016/s1097-2765(01)80009-5. [DOI] [PubMed] [Google Scholar]
- 29.Martinetz T., Schulten K. Topology representing networks. Neural Netw. 1994;7:507–522. [Google Scholar]
- 30.Phillips J.C., Braun R., Wang W., Gumbart J., Tajkhorshid E. Scalable molecular dynamics with NAMD. J. Comput. Chem. 2005;26:1781–1802. doi: 10.1002/jcc.20289. [DOI] [PMC free article] [PubMed] [Google Scholar]
- 31.Humphrey W., Dalke A., Schulten K. VMD—visual molecular dynamics. J. Mol. Graph. 1996;14:33–38. doi: 10.1016/0263-7855(96)00018-5. [DOI] [PubMed] [Google Scholar]
- 32.Sotomayor M., Schulten K. Single-molecule experiments in vitro and in silico. Science. 2007;316:1144–1148. doi: 10.1126/science.1137591. [DOI] [PubMed] [Google Scholar]
- 33.Isralewitz B., Gao M., Schulten K. Steered molecular dynamics and mechanical functions of proteins. Curr. Opin. Struct. Biol. 2001;11:224–230. doi: 10.1016/s0959-440x(00)00194-9. [DOI] [PubMed] [Google Scholar]
- 34.Freddolino P.L., Arkhipov A.S., Larson S.B., McPherson A., Schulten K. Molecular dynamics simulations of the complete Satellite Tobacco Mosaic virus. Structure. 2006;14:437–449. doi: 10.1016/j.str.2005.11.014. [DOI] [PubMed] [Google Scholar]
- 35.Snyder J.P. The University of Chicago Press; Chicago: 1993. Flattening the Earth: Two Thousand Years of Map Projections. [Google Scholar]
- 36.Llamas-Saiz A.L., Agbandje-McKenna M., Wikoff W.R., Bratton J., Tattersall P. Structure determination of minute virus of mice. Acta Crystallogr. D Biol. Crystallogr. 1997;53:93–102. doi: 10.1107/S0907444996010566. [DOI] [PubMed] [Google Scholar]
- 37.Morais M.C., Choi K.H., Koti J.S., Chipman P.R., Anderson D.L. Conservation of the capsid structure in tailed dsDNA bacteriophages: the pseudoatomic structure of ϕ29. Mol. Cell. 2005;18:149–159. doi: 10.1016/j.molcel.2005.03.013. [DOI] [PubMed] [Google Scholar]
- 38.Lander G.C., Evilevitch A., Jeembaeva M., Potter C.S., Carragher B. Bacteriophage-λ stabilization by auxiliary protein gpD: timing, location, and mechanism of attachment determined by cryo-EM. Structure. 2008;16:1399–1406. doi: 10.1016/j.str.2008.05.016. [DOI] [PMC free article] [PubMed] [Google Scholar]
Associated Data
This section collects any data citations, data availability statements, or supplementary materials included in this article.