

Abstract
Interferon-beta (IFNB1) mRNA shows very large cell-to-cell variability in primary human dendritic cells infected by Newcastle disease virus, with copy numbers varying from a few to several thousands. Analysis of data from the direct measurement of the expression of this gene in its natural chromatin environment in primary human cells shows that the distribution of mRNA across cells follows a power law with an exponent close to −1, and thus encompasses a range of variation much more extensive than a Gaussian. We also investigate the single cell levels of IFNB1 mRNA induced by infection with Texas influenza A mutant viruses, which vary in their capacity to inhibit the signaling pathways responsible for activation of this gene. Here as well we observe power-law behavior for the distribution of IFNB1 mRNA, albeit over a truncated range of values, with exponents similar to the one for cells infected by Newcastle disease virus. We propose a model of stochastic enhanceosome and preinitiation complex formation that incorporates transcriptional pulsing. Analytical and numerical results show good agreement with the observed power laws, and thus support the existence of transcriptional pulsing of an unmodified, intact gene regulated by a natural stimulus.
Introduction
Dendritic cells (DCs) play a significant role in the (nonspecific) innate immune response to viral infection leading to the development of (antigen-specific) adaptive immunity. A crucial step in the early DC response to viral infection is the induction of interferon beta (IFNB1), a secreted cytokine that initiates a complex cellular response leading to widespread viral resistance (1). Specific and precise control of the IFNB1 gene expression is accomplished through the coordinated assembly of an enhanceosome containing several transcription factors. The enhanceosome assembly facilitates (2,3) the recruitment of coactivators and chromatin-remodeling proteins to the transcription complex. All these processes occur stochastically and lead to considerable cell-to-cell variability (4,5) of IFNB1 induction, which we have highlighted recently (4) for primary human dendritic cells infected by Newcastle disease virus (NDV). IFNB1 mRNA production is very noisy, with individual cellular responses ranging between ten and several thousand copy numbers. NDV, being an avian virus, lacks functional antagonists in human cells and thus allows the cell to display the full spectrum of immune response. By measuring the differential expression of two alleles, exploiting a readout polymorphism, we also established that intrinsic noise plays a major role in IFNB1 mRNA cell-to-cell variability (4). Experimental results were explained at a semiquantitative level in a model where the intrinsic nature of cellular variability was attributed to the stochastic assembly of a multicomponent enhanceosome complex.
In this work we present new single cell data on cell-to-cell IFNB1 variability in NDV infected human dendritic cells. We also show data of IFNB1 variability for mutant Texas influenza A viruses, whose potency is altered from the wild-type through manipulation of the viral nonstructural protein 1 (NS1) coding region (6,7). The availability of the mutant viruses provides the opportunity to study the typical and crucial innate immune response, namely IFNB1 production, as the degree of virulence is varied for viruses infecting primary human DCs. Remarkably, for both NDV and Texas influenza A mutant viruses, the IFNB1 mRNA distribution across cells has a long tail. Thus the immune response is characterized by a scale-invariant power law distribution over three decades of IFNB1 mRNA copy number for NDV infection, and two decades for the mutant influenza viruses. Moreover, for NDV as well as mutant influenza virus infection, the mRNA distribution p(m) is characterized by exponents between −0.5 and −0.8. This power-law behavior is dramatically different from the usually observed distributions, Gaussian or Poisson, for gene expression, where the variance across cells increases with the mean number (8–10).
We have developed a theoretical model that accounts for the power-law behavior of IFNB1 production, in particular the cumulative mRNA distribution P(m), and for its characteristic exponent. This model is based on our earlier model of stochastic enhanceosome formation (4), which, though it gave a good account of allelic imbalance and the role of monoallelic IFNB1 mRNA production (this latter was attributed recently to interchromosomal associations (5)), was inadequate in describing the distribution of total mRNA production. The new ingredient is transcriptional pulsing, which leads to power-law behavior for the appropriate choice of reaction rate constants. Although evidence for transcriptional pulsing has been reported in yeast (11,12) and for engineered genes (13), the applicability of these findings to the physiological expression of an unaltered mammalian gene in its native chromatin environment and in untransformed primary cells has not been established. Our model of IFNB1 transcription combines the stochasticity of enhanceosome assembly (4) with that of transcriptional bursts that leads to power-law mRNA distributions in quantitative agreement with experimental data. For DCs infected with mutant viruses, we include in our model reduced activation of the transcription factors and delayed response as observed in other experiments with the mutant influenza viruses (14). In summary, we present striking experimental results for the distribution of IFNB1 mRNA across different cells and a detailed model that describes the behavior, thus providing insights into the stochastic dynamics of the antiviral response of dendritic cells.
Materials and Methods
Differentiation of dendritic cells (DCs)
All human research protocols for this work have been reviewed and approved by the Internal Review Board of the Mount Sinai School of Medicine. Monocyte-derived conventional DCs were obtained from human blood donors using a standard protocol. Briefly, human monocytes from buffy coats were isolated by Ficoll density gradient centrifugation (Histopaque, Sigma Aldrich, St. Louis, MO) and CD14+ monocytes were immunomagnetically purified by using a MACS CD14 isolation kit (Miltenyi Biotech, Singapore). CD14+ Monocytes (0.7 × 10⁶ cells/mL) were later differentiated into immature DCs after 5–6 day incubation in DC growth media (RPMI Medium 1640, Gibco, Billings, MT; 10% fetal calf serum, HyClone, Thermo Fisher Scientific, Logan, UT; 2 mM of L-glutamine, 100 units/mL penicillin, 100 mg/mL streptomycin, Pen/Strep, Invitrogen, Carlsbad, CA; 500 U/mL hGM-CSF, PreProTech, Rocky Hill, NJ; and 1000 U/mL hIL-4, PreProTech, at 37°C).
Virus preparation and viral infection
The recombinant Hitchner strain of Newcastle disease virus (rNDV/B1) was prepared and aliquots of allantoic fluid were harvested as previously described (15). The recombinant human influenza virus A/Texas/91 strain with NS1 truncations Δ99 and Δ126 were kindly provided by Dr. Ana Fernandez-Sesma. Titered NDV or A/Texas virus stocks were added directly into pelleted DCs at a multiplicity of infection of 0.5. After incubation for 30 min at 37°C, fresh DC growth medium was added back to the infected DCs (1 × 10⁶ cells/mL). Virus free allantoic fluid was added to additional tubes of cells to serve as a negative control.
Single cell polymerase-chain reaction (PCR)
As previously described in Hu et al. (4), single DCs were sorted directly into 384-well bar-coded PCR plates, and single-cell real-time RT-PCR was performed. Specifically, a 5-μL aliquot of a 2× AccuRT master mix solution, prepared as described in Hu et al. (4), was added to each well, which contains a single DC and 5 μL lysis buffer. In control wells with no cells, 1 μL of genomic DNA of varying dilutions (103–40 copies/μL) was added along with the 5-μL aliquot of 2× master mix. PCR results were analyzed with the Lightcycler 480 (Roche, Basel, Switzerland) where the PCR cross point (Cp) value for each amplification curve was determined by a secondary derivative calculation. A few PCR dropouts (∼1%) were observed by a melting curve analysis and excluded from the data set.
Model
The model without transcriptional pulsing is described in detail in Hu et al. (4). It was based on the key experimental result that the level of IFNB1 induction in different cells in response to NDV infection was broad and dominated by intrinsic noise. Our modeling is focused on the power-law behavior due to infection from NDV and the mutant flu viruses. Since there are many potentially different sources of extrinsic noise, the robustness of the experimental results (with different individuals giving rise to similar power laws) provides the motivation for modeling only the intrinsic noise that arises from the stochastic fluctuations in the assembly of the enhanceosome.
Enhanceosome formation from the activated components was described as cooperative binding of components P1, P2, P3, and P4 to the IFNB1 promoter region. It is believed that the architectural protein HMGA1a binds to the promoter region facilitating the recruitment of the other components. Munshi et al. (18) suggest that NFκB (p65) is detected initially at the promoter with IRF-1, ATF-2 is recruited later followed by the arrival of IRF-3, and finally IRF-7 that is synthesized in response to virus infection via the IFN autocrine loop. Although there is some evidence for two-phase kinetics with feedback (16), we focus on modeling the substantial induction of IFNB1 that is measured in the 9–12 h range after IRF-7 synthesis. We model the enhanceosome with four proteins, P1–P4, that may be taken to represent the architectural protein and the three transcription factors NFκB, IRF, and ATF-2.
For each gene, the reactions of the model for sequential cooperative binding of P1–P4 are
| (1) |
| (2) |
| (3) |
| (4) |
where for simplicity the rate constants are chosen equal in the first three reactions. Ds4 denotes the completed enhanceosome. We have allowed for a small rate for the last transcription factor allowing the enhanceosome to fall apart in contrast to the earlier model from Hu et al. (4). This makes the entire model, with reactions from Eqs. 5 and 6, equivalent to a pulsing problem, which leads to power-law distributions with reasonable agreement for the timescales on which mRNA induction occurs.
Once the enhanceosome is completed on either of two chromosomes, there is a cascade of steps to assemble the preinitiation complex (17). The steps include histone acetylation, recruitment of the CBP-Pol II holoenzyme complex, SwI-SNF, and TATA-binding proteins. After this, the enhanceosome is in a transcribing state, where IFNB1 transcription takes place for some random time, before switching back to the nontranscribing state. This latter switching back-and-forth corresponds to transcriptional bursting and distinguishes the present extended model from the original one. We model the entire assembly of the preinitiation complex by a single step. The transcribing state is Ds4∗, from which mRNA m is produced such that
| (5) |
| (6) |
For the rate constants, we chose k1 = 1.132 × 10⁻⁷ s−1 in the Gillespie simulations with the actual rate obtained by multiplying the copy number of the transcription factors. The others are given by k2 = 0.002425 s−1, f = 1.5 × 10⁻⁴ s−1, and b = 3 × 10⁻⁴ s−1. We used a copy number of 12,000 for all the transcription factors. A transcription rate of 20 per min was used. The numbers for the assembly of the enhanceosome are approximately the same as in the earlier article (4), and were chosen so that there is rough agreement with experimental results on the time at which transcripts are first measured. We have included a small rate (smaller by a factor of 4) for the enhanceosome itself to break apart. We incorporated the fact that IFNB1 mRNA is stable for 2 h and degrades abruptly thereafter (4). For simplicity, we have used exponential degradation in the figures shown; we have verified that the nature of the degradation does not affect our results. The transcription and degradation rates determine the maximum number of mRNA produced in any cell. The rate of transcription given the decay rate that was measured experimentally was chosen to get agreement with the maximum number of transcripts observed. The transcription factors are assumed to be activated after 2 h. There is preliminary experimental evidence for this timescale. We have verified that including a small basal transcription rate from Ds (5% of the maximum rate) does not alter our conclusions.
The sequence of steps in the model can be considered a simple pulsing problem: the promoter is either in the transcribing state (Ds4∗) or in nontranscribing states (Ds, Ds1, Ds2, Ds3, and Ds4). As shown in the Appendix, we can make an approximate analytic equivalence and compute the rate constants of an effective pulsing model from the full model; we have used the results to guide our choice of the rate constants. The approximate calculation for the values we have chosen yields an exponent of 0.83. We simulated the model using stochastic simulations based on the Gillespie algorithm (18) and obtained 0.76 to ∼10% of the approximate analytic estimate.
To simulate the model with the mutant virus which interferes with enhanceosome formation we have been guided by experiment and exploration of the space of rate constants in the model. Experimentally, it is known (19–21) that NS1 inhibits retinoic acid-inducible gene I (RIG-I) activation by binding to the dsRNA of the virus. This in turns prevents the activation of NFκB and IRF3 proteins. We have modeled this by decreasing the number of activated components and increasing the time it takes for them to be activated from 3 h to 5 h. In addition, the slowing down prevents the key transcription factor IRF-7 that is not constitutively expressed from being produced and activated. This makes the transcription rate slower since the structure of the enhanceosome is not optimal. We model this by reducing the transcription rate by a factor of 2. The results of the simulation are displayed in later Fig. 6, which is similar to the data for TexasΔ126. For the mutant model, the number of transcription factors is reduced to 10,000 for the least virulent case with the activation time increased to between 4 and 5 h (14). The rate at which the enhanceosome-preinitiation complex falls apart, b, is increased by a factor of 5.
Figure 6.

Results (blue squares) from the model calculation for the mutant virus TexasΔ126. The model data are presented at 11 h on a log-log plot. The extent of power-law behavior of the mRNA IFNB1 distribution is reduced as in the experiment (see Fig. 3). The best fit yields a power-law given by a cumulative distribution P(m) ∼ m0.26, leading to p(m) ∼ m−0.74. This is to be compared with the experimental result of Fig. 3, where p(m) ∼ m−0.69.
Results
mRNA spectra for NDV infected cells
The experiments were performed with the ratio of infectious particles to cells (the so-called multiplicity of infection at 0.5). The cells are primary human conventional dendritic cells infected by NDV. The number of IFNB1 mRNA molecules in single cells was measured in a PCR experiment (see Materials and Methods). Measurements on cells from three individuals were performed at 10 and 11 h after infection, where IFNB1 production reaches a plateau (4). There is no measurable response before 6 h as reported earlier and the late response is overwhelming, making the measurements most stable. In Fig. 1 we display the histogram of the percentage count of DCs as a function of PCR cycle number at 10 and 11 h after infection. The expression level across cells varies widely by a factor of 1000. The distribution is rather flat, far from Gaussian.
Figure 1.

Histogram of IFNB1 expression at 10 h (top, 149 cells) and 11 h (bottom, 96 cells) for one individual. The percentage number of cells for each PCR cycle number value is displayed.
Since the data are recorded in cycle numbers, bin sizes increase geometrically by factors of 2. Therefore, it is convenient to represent the cumulative probability distribution. If p(m) represents the probability of obtaining m copies of IFNB1 mRNA, the cumulative probability P(m) is the probability of obtaining a value of copy number ≤m. Thus, if p(m) has the power-law behavior p(m) ∼ m−a, we expect for P(m) the form ∼m1–a, and a leveling off at large m at the top range of possible mRNA copy numbers. We have extracted P(m) from Fig. 1 and plotted it in Fig. 2 on a log-log plot. The experimental points follow a straight line over a significant range of almost three decades, revealing the existence of power-law behavior. We have combined the data at 10 and 11 h to improve the statistics. A straight line numerical fit (log-log plot of Fig. 2) to the data yields an exponent of a ≈ 0.7, which is nearly the same as for DCs collected from two other individuals (results not shown). Similar results are obtained from a reanalysis of the data in Hu et al. (4). There is thus a remarkable degree of universality in the early innate immune response across different individuals.
Figure 2.
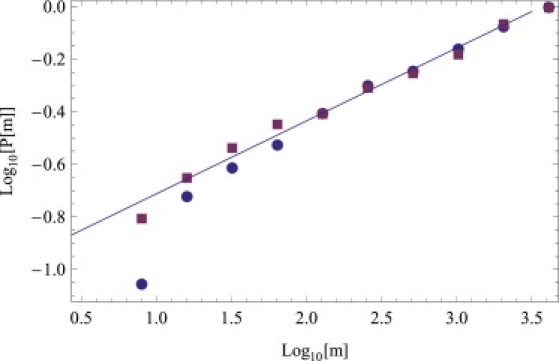
The data shown as function of cycle numbers in Fig. 1 are replotted on a log-log plot for the cumulative probability distribution P(m) of IFNB1 mRNAs. The 10 h (red squares) and 11 h (blue circles) data have been merged to obtain improved statistics. The straight line of slope 0.28 represents a numerical fit to the data points, which entails that p(m) ∼ m−0.72 for the probability distribution itself.
mRNA spectra for mutant viruses
Mutant viruses are obtained from the Texas wild-type influenza A virus by truncation of the NS1 viral protein coding region. The NS1 protein is considered the main viral defense against the infected cell's immune response. It inhibits RIG-I from sensing viral RNA and thus interferes with the activation of the enhanceosome components responsible for IFNB1 induction (19–21). In the experiment, primary human conventional DCs are infected with two variant strains of Texas influenza A, namely TexasΔ126 and TexasΔ99, of which the latter contains the longer NS1 fragment and is therefore more virulent. In terms of pathogenicity, these two TexasΔ strains interpolate between the Texas wild-type and a virus such as NDV, which lacks the NS1 protein. The cumulative distributions P(m) as a function of m are shown in Figs. 3 and 4. The range of the distribution for TexasΔ126 (see Fig. 3) compared to NDV infection (see Fig. 2) decreases by approximately one decade, as a result of diminished activation of enhanceosome components due to the truncated NS1 protein blocking RIG-I. The range is smaller by half a decade for the more virulent TexasΔ99 (see Fig. 4). What is remarkable, though, is that both mutant virus distributions still follow a power law, as illustrated by the straight lines drawn in Figs. 3 and 4. The slopes of the straight lines are, respectively, close to 0.31 and 0.5, and therefore, respectively, for the mRNA distribution itself p(m) ∼ m−0.69 and p(m) ∼ m−0.5. The exponent for cells infected by TexasΔ126 is practically the same as for cells infected by the avian NDV.
Figure 3.

Log-log plot of the cumulative distribution P(m) of mRNAs m for cells infected with the TexasΔ126 influenza strain. The blue circles correspond to the experimental measurements of IFNB1 mRNA copy number variation across cells. The straight line is a numerical fit to the power-law region with a slope 0.31, which entails for the probability distribution p(m) ∼ m−0.69.
Figure 4.

Log-log plot of the cumulative distribution P(m) of mRNAs produced for cells infected by the TexasΔ99 strain. The blue circles correspond to the experimental measurements of IFNB1 mRNA copy number variation across cells. The power-law region of the distribution is numerically fitted by a straight line of slope 0.5, which entails that p(m) ∼ m−0.5.
Model with transcriptional pulsing
Our earlier model (4), though it was adequate for explaining the observed allelic imbalance and the associated intrinsic noise, was not so for describing the observed flatness of the IFNB1 spectrum with respect to cycle number. The flatness in cycle number leads to a power law for the distribution of IFNB1 mRNA copy number. To reproduce this behavior (see Fig. 2) the previous model needs to be extended to include transcriptional bursting, which is known to lead to power law behavior (see Materials and Methods). We associate pulsing behavior with the formation of a preinitiation complex (PIC) (22) that takes place with transcription factor enhanceosome assembly. According to Munshi et al. (22), it is the acetylation of the architectural protein HMGI(Y) that controls a switch leading to enhanceosome formation and breakup. Agalioti et al. (17) demonstrate that there is cascade of enhanceosome-dependent recruitment events that culminate in transcription. This aspect of IFNB1 transcription was neglected in the original model. IFNB1 production takes place whenever enhanceosome-PIC complex is complete, but not when they are disassembled. We model this assembly and disassembly of the enhanceosome-PIC complex as a single step that occurs stochastically; a high level of transcription occurs only when the complex is assembled leading to induction in pulses, with the time in-between pulses and their duration random variables.
The results of the model simulation using the Gillespie algorithm (18) are displayed in Figs. 5 and 6, for cells, respectively, infected by NDV and TexasΔ126 viruses. The blue triangles in Fig. 5 and blue squares in Fig. 6 represent the results of the model. The straight lines are numerical fits to the model results. The model reproduces the power-law behavior of the experimental data (see Figs. 2 and 3) for cells infected by both NDV and the mutant influenza A virus. As the straight line numerical fits to the model data show, the exponents characterizing the power-laws are very similar to the experimental ones, thus confirming that model results reproduce experimental results on power-law behavior of the IFNB1 mRNA distributions.
Figure 5.

Results (blue triangles) from the model calculation with the inclusion of a pulsing step for the preinitiation complex. The model data are presented at 11 h on a log-log plot. The power-law region of the cumulative distribution fits P(m) ∼ m−0.24, leading to p(m) ∼ m−0.76. This is to be compared with the experimental result of Fig. 2, where p(m) ∼ m−0.72.
Discussion
We have presented data on single cell human DCs infected by NDV and mutant Texas influenza A viruses, where IFNB1 mRNA distributions exhibit power-law behavior over several decades with exponents between −0.5 and −0.8. Transcriptional pulsing can lead to such behavior (13,23,24), where the exponent is larger than −1, and the difference to −1 depends on the ratio of forward pulsing rate and mRNA degradation rate. We have developed a stochastic model of IFNB1 induction, an extension of a previous one (4) for allelic imbalance: we incorporate the formation of the preinitiation complex by a transcriptional bursting step. Numerical simulations of the model along with an analytic calculation of the effective forward pulsing rate (see Appendix) lead to a quantitative fit of the data, thus supporting the existence of transcriptional pulsing as an essential aspect of IFNB1 induction in primary human dendritic cells.
Our model results explain the large cell-to-cell variability of IFNB1 mRNA that is experimentally observed. How does this variability affect the innate immune response? It is known that mRNA fluctuations could be washed out by slow protein dynamics, such as a protein lifetime much larger than its mRNA lifetime, as has been shown to occur in a typical model of transcriptional bursting (13,23). The key difference in the case of dendritic cells is that the IFNB1 protein is a cytokine and the temporal profile of the secreted protein determines the unfolding of the immune response. Thus the cells that produce the most IFNB1 mRNA are the ones that are activated early after viral infection (4). These same cells produce many IFNB1 proteins and secrete them into the environment, thus priming neighboring cells through binding to their interferon receptors and engaging the antiviral JAK/STAT pathway. The substantial variability in the amount of produced IFNB1 mRNA might be a way of allowing for an early response that is strong in a limited number of cells thereby avoiding a cytokine storm (25). The power-law IFNB1 mRNA distribution can confer some robustness to the cytokine response since any delay in IFNB1 induction due to viral antagonists will only cut off the tail of the distribution, still leaving some cells producing sufficient numbers of proteins to sustain the response. Such appears to be the case for the mutant Texas influenza A viruses, where the power-law behavior persists over a reduced range due to viral antagonism.
Appendix: Effective Parameters for The Complete Model
We consider a model with 6-state and more general rate constants. Let the states of the model be denoted by j from j = 0 to j = 5 where the j = 4 (denoted by Ds4 in the text) corresponds to the state with the enhanceosome complete and j = 5 (denoted by Ds4∗) corresponds to the state with the preinitiation complex assembled and the one from which transcription of IFNB1 occurs. Let fj and bj be the forward and backward rates from state j to j + 1 and j − 1, respectively. We also have b0 = f5 = 0 since the system cannot go back from the initial state or forward from the final state. Since state 6 is the only transcribing state, we can think of this as a simple pulsing model with two states, a single initial state D that is not transcribing that corresponds to the first five states and a single final state D∗ that corresponds to the state 6 with effective rate constants:
The effective cb, eff = b6 is the rate at which the transcribing state returns to a nontranscribing state. The effective cf, eff can be obtained by solving a simple ordinary differential equation model that describes the system of six states. If pj denotes the probability that the system is in state j, we have
From the steady-state solution, we can determine the steady-state probability to be in the transcribing state (p5) to be
By equating this probability to the probability in the effective model, we can obtain cf, eff. From the exact solution (13,23), we know that the power-law decay exponent is determined by cf, eff/kd. In the model, we have used f0 = f1 = f2 = f3 = k1, b1 = b2 = b3 = k2, b4 = k2/4, and f4 = f and b5 = b. We have used this to guide our choice of the rate constants that make the time dependence of the average values and the power-law decay exponent in agreement with the experiments.
Acknowledgments
We thank Dr. Ana Fernandez-Sesma for providing mutant influenza virus Texas/91 strains, and Madhu Kumar for DC cell cultivation.
This work was supported by contract No. HHSN-266200500021-C of the National Institute of Allergy and Infectious Diseases.
References
- 1.Kawai T., Akira S. Innate immune recognition of viral infection. Nat. Immunol. 2006;7:131–137. doi: 10.1038/ni1303. [DOI] [PubMed] [Google Scholar]
- 2.Panne D., Maniatis T., Harrison S.C. Atomic model of the interferon-β enhanceosome. Cell. 2007;29:1111–1123. doi: 10.1016/j.cell.2007.05.019. [DOI] [PMC free article] [PubMed] [Google Scholar]
- 3.Struhl K. Paradigm for precision. Science. 2001;293:1054–1055. doi: 10.1126/science.1064050. [DOI] [PubMed] [Google Scholar]
- 4.Hu J., Sealfon S.C., Hayot F., Jayaprakash C., Kumar M. Chromosome-specific and noisy IFNβ1 transcription in individual virus-infected human primary dendritic cells. Nucleic Acids Res. 2007;35:5232–5241. doi: 10.1093/nar/gkm557. [DOI] [PMC free article] [PubMed] [Google Scholar]
- 5.Apostolou E., Thanos D. Virus infection induces NF-κ B-dependent interchromosomal associations mediating monoallelic IFN-β gene expression. Cell. 2008;134:85–96. doi: 10.1016/j.cell.2008.05.052. [DOI] [PubMed] [Google Scholar]
- 6.Talon J., Salvatore M., O'Neill R.E., Nakaya Y., Zheng H. Influenza A and B viruses expressing altered NS1 proteins: a vaccine approach. Proc. Natl. Acad. Sci. USA. 2000;97:4309–4314. doi: 10.1073/pnas.070525997. [DOI] [PMC free article] [PubMed] [Google Scholar]
- 7.Solorzano A., Webby R.J., Lager K.M., Janke B.H., Garcia-Sastre A. Mutations in the NS1 protein of swine influenza virus impair anti-interferon activity and confer attenuation in pigs. J. Virol. 2005;79:7535–7543. doi: 10.1128/JVI.79.12.7535-7543.2005. [DOI] [PMC free article] [PubMed] [Google Scholar]
- 8.Bar-Even A., Paulsson J., Maheshri N., Carmi M., O'Shea E. Noise in protein expression scales with natural protein abundance. Nat. Genet. 2006;38:636–643. doi: 10.1038/ng1807. [DOI] [PubMed] [Google Scholar]
- 9.Colman-Lerner A., Gordon A., Serra E., Chin T., Resnekov O. Regulated cell-to-cell variation in a cell-fate decision system. Nature. 2005;437:699–706. doi: 10.1038/nature03998. [DOI] [PubMed] [Google Scholar]
- 10.Ruf F., Hayot F., Park M.J., Ge Y., Lin G. Noise propagation and scaling in regulation of gonadotrope biosynthesis. Biophys. J. 2007;93:4474–4480. doi: 10.1529/biophysj.107.115170. [DOI] [PMC free article] [PubMed] [Google Scholar]
- 11.Becskei A., Kaufmann B.B., van Oudenaarden A. Contribution of low molecule number and chromosomal positioning to stochastic gene expression. Nat. Genet. 2005;37:937–944. doi: 10.1038/ng1616. [DOI] [PubMed] [Google Scholar]
- 12.Raser J.M., O'Shea E.K. Control of stochasticity in eukaryotic gene expression. Science. 2004;304:1811–1814. doi: 10.1126/science.1098641. [DOI] [PMC free article] [PubMed] [Google Scholar]
- 13.Raj A., Peskin C.S., Tranchina D., Vargas D.Y., Tyagi S. Stochastic mRNA synthesis in mammalian cells. PLoS Biol. 2006;4:1707–1719. doi: 10.1371/journal.pbio.0040309. [DOI] [PMC free article] [PubMed] [Google Scholar]
- 14.Talon J., Horvath C.M., Polley R., Basler C.F., Muster T. Activation of interferon regulatory factor 3 is inhibited by the influenza A virus NS1 protein. J. Virol. 2000;74:7989–7996. doi: 10.1128/jvi.74.17.7989-7996.2000. [DOI] [PMC free article] [PubMed] [Google Scholar]
- 15.Park M.S., Garcia-Sastre A., Cros J.F., Basler C.F., Palese P. Newcastle disease virus V protein is a determinant of host range restriction. J. Virol. 2003;77:9522–9532. doi: 10.1128/JVI.77.17.9522-9532.2003. [DOI] [PMC free article] [PubMed] [Google Scholar]
- 16.Tailor P., Tomura T., Kong H.J., Kubota T., Kubota M. The feedback phase of type-I interferon induction in dendritic cell requires Interferon Regulatory factor 8. Immunity. 2007;27:228–239. doi: 10.1016/j.immuni.2007.06.009. [DOI] [PMC free article] [PubMed] [Google Scholar]
- 17.Agalioti T., Lomvardas S., Parekh B., Yie J., Maniatis T. Ordered recruitment of chromatin modifying and general transcription factors to the IFN-β promoter. Cell. 2000;103:667–678. doi: 10.1016/s0092-8674(00)00169-0. [DOI] [PubMed] [Google Scholar]
- 18.Gillespie D.T. Approximate accelerated stochastic simulation of chemically reacting systems. J. Chem. Phys. 2001;115:1716–1733. [Google Scholar]
- 19.Pichlmair A., Schulz O., ChTan P., Naslund T.I., Liljestrom P. RIG-I mediated antiviral responses to single-stranded RNA bearing 5′-phosphates. Science. 2006;314:997–1001. doi: 10.1126/science.1132998. [DOI] [PubMed] [Google Scholar]
- 20.Guo Z., Chen L.M., Zeng H., Gomez J.A., Plowden J. NS1 protein of influenza A virus inhibits the function of intracytoplasmic pathogen sensor RIG-I. Am. J. Respir. Cell Mol. Biol. 2007;36:263–269. doi: 10.1165/rcmb.2006-0283RC. [DOI] [PubMed] [Google Scholar]
- 21.Mibayashi M., Martinez-Sobrido L., Loo Y.M., Cardenas W.B., Gale M. Inhibition of retinoic acid-inducible gene I-mediated induction of β-interferon by the NS1 protein of i9nfluenza A virus. J. Virol. 2007;81:514–524. doi: 10.1128/JVI.01265-06. [DOI] [PMC free article] [PubMed] [Google Scholar]
- 22.Munshi N., Agalioti T., Lomvardas S., Merika M., Chen G. Coordination of a transcriptional switch by HMGI(Y) acetylation. Science. 2001;293:1133–1136. doi: 10.1126/science.293.5532.1133. [DOI] [PubMed] [Google Scholar]
- 23.Iyer-Biswas S., Hayot F., Jayaprakash C. Stochasticity of gene products from transcriptional pulsing. Phys. Rev. E. 2009;79:031911. doi: 10.1103/PhysRevE.79.031911. [DOI] [PubMed] [Google Scholar]
- 24.Karmaker R., Bose I. Graded and binary responses in stochastic gene expression. Phys. Biol. 2006;1:197–204. doi: 10.1088/1478-3967/1/4/001. [DOI] [PubMed] [Google Scholar]
- 25.Salomon R., Webster R.G. The influenza virus enigma. Cell. 2009;136:402–410. doi: 10.1016/j.cell.2009.01.029. [DOI] [PMC free article] [PubMed] [Google Scholar]