

Abstract
The low-affinity fluorescent Ca2+ indicators OGB-5N, Fluo-5N, fura-5N, Rhod-5N, and Mag-fluo-4 were evaluated for their ability to accurately track the kinetics of the spatially averaged free Ca2+ transient (Δ[Ca2+]) in skeletal muscle. Frog single fibers were injected with one of the above indicators and, usually, furaptra (previously shown to rapidly track Δ[Ca2+]). In response to an action potential, the full duration at half-maximum of the indicator's fluorescence change (ΔF) was found to be larger with OGB-5N, Fluo-5N, fura-5N, and Rhod-5N than with furaptra; thus, these indicators do not track Δ[Ca2+] with kinetic fidelity. In contrast, the ΔF time course of Mag-fluo-4 was identical to furaptra's; thus, Mag-fluo-4 also yields reliable kinetic information about Δ[Ca2+]. Mag-fluo-4's ΔF has a larger signal/noise ratio than furaptra's (for similar indicator concentrations), and should thus be more useful for tracking Δ[Ca2+] in small cell volumes. However, because the resting fluorescence of Mag-fluo-4 probably arises largely from indicator that is bound with Mg2+, the amplitude of the Mag-fluo-4 signal, and its calibration in Δ[Ca2+] units, is likely to be more sensitive to variations in [Mg2+] than furaptra's.
Introduction
Intracellular Ca2+ signaling is an important process that controls key activities in most cell types. In skeletal muscle fibers, many past and current studies of excitation-contraction coupling seek to draw quantitative inferences about intracellular Ca2+ movements, including estimates of the rates and amounts of Ca2+ release from the sarcoplasmic reticulum (SR), Ca2+ binding to myoplasmic Ca2+ buffers, and Ca2+ resequestration into the SR (e.g., (1–11)). These studies usually rely on estimates of changes in the myoplasmic free calcium concentration (Δ[Ca2+]) based on optical signals—typically changes in fluorescence (ΔF)—from a calcium indicator dye introduced into the myoplasm. Unfortunately, the reported properties of spatially averaged Δ[Ca2+] in a given fiber type often vary widely from study to study, as is seen, for example, in mouse fast-twitch fibers stimulated by an action potential (8,12–17; see also Discussion). Although the reason(s) for these variations is not always clear, one important factor is the choice of Ca2+ indicator.
Because Δ[Ca2+] elicited by an action potential is large and brief in skeletal muscle fibers (18,19,13), accurate estimations of the amplitude and time course of this Δ[Ca2+] are greatly facilitated by use of a low-affinity, rapidly responding indicator (18,20). The principal aim of this study was to evaluate five newer low-affinity fluorescent Ca2+ indicators—Oregon green BAPTA 488-5N (OGB-5N), Fluo-5N, fura-5N, Rhod-5N, and Mag-fluo-4—for their ability to accurately monitor the time course of Δ[Ca2+] in intact single twitch fibers from frogs. Frog fibers were chosen because this hardy preparation is well suited for addressing the kinetic questions of interest in this article. The principal strategy employed was to measure the time course of ΔF evoked by an action potential using one of the newer indicators and to compare it with ΔF measured in the same fiber using furaptra (also known as Mag-fura-2). Furaptra is a good choice for these comparisons, because its properties in frog fibers have been carefully studied (21,22), and previous work indicates that furaptra's ΔF tracks Δ[Ca2+] with little or no kinetic delay (21). Furaptra itself, however, has some limitations, including a relatively small fractional change in fluorescence in response to Δ[Ca2+], 0.1–0.2 (21–23), as well as sensitivity to cytosolic free [Mg2+] ((24,21,22); see Discussion). In contrast, because OGB-5N, Fluo-5N, Rhod-5N, and Mag-fluo-4 have a bright fluorescence when in the Ca2+-bound form, their ΔF signals are expected to respond to Δ[Ca2+] with large fractional increases in fluorescence. Moreover, OGB-5N, Fluo-5N, fura-5N, and Rhod-5N are members of the tetracarboxylate family of Ca2+ indicators (25,26), and are thus expected to have excellent selectivity over [Mg2+]. In contrast, Mag-fluo-4, like furaptra, is a member of the tricarboxylate family of indicators (24) and therefore, like furaptra, is subject to some interference from [Mg2+] (see Results and Discussion).
To our disappointment, we found that none of the tetracarboxylate indicators studied here reported reliable kinetic information about Δ[Ca2+]. With OGB-5N, Fluo-5N, and fura-5N, the full duration at half-maximum (FDHM) of ΔF was found to exceed that with furaptra—on average, by 52%, 53%, and 36%, respectively. Similar or larger increases in FDHM were seen in a previous study in which three other low-affinity tetracarboxylate indicators, BTC, Calcium-orange-5N, and Calcium-green-5N, were compared with furaptra ((23); see also Table 1). Thus, the ΔF signals from these tetracarboxylate indicators do not appear to track the time course of Δ[Ca2+] with kinetic fidelity. With Rhod-5N, the FDHM of ΔF is probably also larger than with furaptra. A more important limitation of Rhod-5N, however, is that its fractional change in fluorescence in response to an action potential declined substantially with time, even though Δ[Ca2+] appeared to be stable. These changes might reflect a time-dependent redistribution of Rhod-5N molecules from the cytosol into an intracellular compartment.
Table 1.
Properties of furaptra and other low-affinity Ca2+ indicators
| Indicator | Solution measurements (16–22°C) | ΔF/FR measurements in frog fibers (16°C) | ||||
|---|---|---|---|---|---|---|
| KD,Ca(μM) | KD,Mg(μM) | KDMg/KDCa | Peak | Time of peak (ms) | FDHM (ms) | |
| 1 | 2 | 3 | 4 | 5 | 6 | 7 |
| Tricarboxylate | ||||||
| Furaptra | 44 | 5300 | 120 | −0.132 ± 0.007 | 5.0 ± 0.1 | 10.9 ± 0.7 |
| Mag-indo-1 | 29 | 7600 | 262 | −0.114 ± 0.010 | 5.2 ± 0.4 | 11.6 ± 2.3 |
| Mag-fura-5 | 31 | 4300 | 139 | −0.119 ± 0.003 | 4.9 ± 0.1 | 9.8 ± 0.5 |
| Tetracarboxylate | ||||||
| BTC | 26 | — | — | 0.144 ± 0.006 | 6.3 ± 0.3 | 16.2 ± 0.1 |
| Calcium-orange-5N | 53–55 | — | — | 0.260 ± 0.041 | 6.2 ± 0.3 | 16.8 ± 1.5 |
| Calcium-green-5N | 63–85 | — | — | 0.835 ± 0.094 | 6.3 ± 0.2 | 36.7 ± 4.5 |
Indicator properties are as reported by Zhao et al. (23). Solution measurements (columns 2–4) were made in, e.g., 0.10–0.15 M KCl, pH 7.0–7.1; KD,Mg was not reported for the tetracarboxylate indicators, as they have generally high selectivity over Mg (KD,Mg/KD,Ca > 105). Entries in columns 5–7 give mean ± SE values of ΔF/FR measured in singly dissected frog fibers microinjected with the indicators and stimulated by a single action potential. The indication in column 7 that the FDHM of Calcium-orange-5N is substantially larger than that of furaptra was confirmed in double-injection experiments like those illustrated in Fig. 1.
In contrast to the findings with the tetracarboxylate indicators, the time course of Mag-fluo-4's ΔF was found to be essentially identical to that of furaptra. This implies that Mag-fluo-4, like furaptra, reports accurate kinetic information about Δ[Ca2+]. Moreover, the signal/noise ratio of ΔF for Mag-fluo-4 is about an order of magnitude larger than that for furaptra (with visible excitation wavelengths and with similar concentrations of indicator). Thus, Mag-fluo-4 should be a particularly valuable indicator for monitoring the kinetics of Δ[Ca2+] from relatively small cellular volumes, for example, from muscle fibers of small diameter (such as mouse toe muscle fibers (8,27)), or in confocal experiments that seek to spatially resolve local Ca2+ signals with kinetic fidelity.
Materials and Methods
Indicator dyes
All indicators were obtained from Invitrogen (Carlsbad, CA). Fura-5N is the “5N” analog of fura-2, achieved by replacement of the methyl group attached to the lone benzene ring of fura-2 (28) with an NO2 group (see also Gee et al. (29)). Fura-5N is not sold commercially by Invitrogen, because its fluorescence intensity is low, both in the Ca2+-free and Ca2+-bound forms. Nevertheless, its fluorescence intensity was found to be just sufficient to make the measurements of interest in this article. All other indicators used in this study are commercially available.
In vitro measurement of Mag-fluo-4's dissociation constants for Ca2+ and Mg2+
The values of KD,Ca and KD,Mg listed for Mag-fluo-4 in the Invitrogen catalog are 22 μM and 4.7 mM, respectively, in a 0.15-M salt solution (pH 7.05; 22°C). The value of KD,Ca is substantially smaller than that recently reported to us in a personal communication from Dr. Christian Soeller (University of Aukland, Aukland, New Zealand, 2009), namely, 80 μM in a 0.13-M salt solution in the presence of 1 mM free [Mg2+] (pH 7.2). Because of this discrepancy, we also measured KD,Ca and KD,Mg of Mag-fluo-4. The values obtained in 130 mM KCl buffered with 10 mM PIPES (pH 7.0, 21°C) are 70 μM for KD,Ca (in the absence of Mg2+) and 6.5 mM for KD,Mg (in the absence of Ca2+). These measurements imply that KD,Ca in the presence of 1 mM free [Mg2+] should be 81 μM (i.e., 70 μM × (1 + 1/6.5)), which is in good agreement with the measurement of Dr. Soeller.
Animals
Animal procedures were approved by the University's Institutional Animal Care and Use Committee. Frogs (Rana pipiens) were obtained from the Sullivan company (Nashville, TN) and kept in a refrigerator at 4°C for up to 6 weeks. On the day of an experiment, an animal was sacrificed by rapid decapitation and pithing. The semitendinosus and/or ileofibularis muscles were immediately removed by gross dissection and intact single fibers were isolated by careful manual dissection.
Experimental strategy
In each experiment, a fiber was mounted in a chamber on an optical bench apparatus and bathed at 16°C in a Ringer's solution that contained (in mM) 120 NaCl, 2.5 KCl, 1.8 CaCl2, and 5 PIPES (pH 7.1). The fiber was stretched to a long sarcomere length (3.3–4.0 μm) to minimize movement artifacts in the optical records. In the majority of experiments, 5 μM N-benzyl-p-toluene sulphonamide (BTS) was included in Ringer's to further reduce movement artifacts (30). The fiber was pressure-injected with the membrane-impermeant (potassium salt) form of either OGB-5N, Fluo-5N, fura-5N, Rhod-5N, or Mag-fluo-4. In most experiments, the fiber was also injected with the salt form of furaptra so that the Ca2+ signals from furaptra could be compared with those of the other indicator. An exception occurred in the experiments with Rhod-5N, as an unusual problem with this indicator (see Results) made a careful comparison of its ΔF time course with that of furaptra somewhat superfluous. In the double-injection experiments with furaptra and fura-5N, which have similar chromophores, the fluorescence signals of the indicators cannot be readily separated if they arise from the same fiber region. Consequently, fura-5N and furaptra were injected at sites separated by 1.5–3 mm along the fiber axis, so that the signal from each indicator could be collected from a fiber region not containing the other indicator. With OGB-5N, Fluo-5N, or Mag-fluo-4, furaptra was usually injected at the same site as, or one closely adjacent to, that of the other indicator, as the signals from furaptra and these other indicators can be unambiguously separated if they arise from the same region of the fiber. This follows because 1), the fluorescence of OGB-5N, Fluo-5N, and Mag-fluo-4 was excited at wavelengths ≥470 nm (Table 2, column 3), which do not excite furaptra's fluorescence; and 2), furaptra's fluorescence was excited with 410 ± 20 nm light (Table 2, column 3), which, at the indicator concentrations used in the experiments, results in little contamination with the fluorescence of OGB-5N, fluo-5N, or Mag-fluo-4. This contamination of the furaptra signal was estimated in all comparisons and usually found to be 1–2%, for which the furaptra signal was appropriately corrected. The largest such correction increased the amplitude of furaptra's ΔF/FR signal (see next paragraph) by 5% and its FDHM by 3%. The contamination correction, which was estimated separately for each indicator from a fiber region containing that indicator alone (i.e., without furaptra), was based on a comparison of fluorescence intensities measured with the excitation and emission wavelengths standardly employed for that indicator and with those standardly employed for furaptra. The ratio of intensities obtained with these two types of measurements then permitted estimation of the contamination of furaptra's fluorescence when recorded in the presence of a second indicator.
Table 2.
Pairwise comparisons of myoplasmic ΔF/FR signals from furaptra and a second Ca2+ indicator
| Indicator | KD,Ca (μM) | (λex/λem) (nm/nm) | N | ΔF/FR elicited by an AP |
Ratio of FDHMs | ||
|---|---|---|---|---|---|---|---|
| Peak | Time of peak (ms) | FDHM (ms) | |||||
| 1 | 2 | 3 | 4 | 5 | 6 | 7 | 8 |
| Furaptra | 44† | (410/470) | 3 | −0.083 ± 0.010 | 5.2 ± 0.9 | 10.9 ± 0.6 | ∗1.52 ± 0.12 |
| OGB-5N | 48‡ | (480/510) | 3 | 1.16 ± 0.12 | 6.0 ± 1.0 | 16.6 ± 2.0 | |
| Furaptra | 44† | (410/470) | 2 | −0.209 ± 0.003 | 5.8 ± 0.8 | 12.8 ± 2.2 | ∗1.53 ± 0.03 |
| Fluo-5N | 90§ | (480/510) | 2 | 1.88 ± 0.40 | 6.3 ± 1.3 | 19.6 ± 3.7 | |
| Furaptra | 44† | (410/470) | 3 | −0.148 ± 0.007 | 5.5 ± 0.0 | 8.0 ± 0.9 | ∗1.36 ± 0.07 |
| Fura-5N | 47 | (410/470) | 3 | −0.076 ± 0.002 | 5.8 ± 0.3 | 10.9 ± 1.3 | |
| Furaptra | 44† | (410/470) | 2 | −0.134 ± 0.024 | 4.8 ± 0.3 | 9.3 ± 1.5 | 0.98 ± 0.01 |
| Mag-fluo-4 | 70 | (480/510) | 2 | 1.61 ± 0.08 | 5.3 ± 0.3 | 9.1 ± 1.4 | |
Table summarizes properties of ΔF/FR measured in this study at 16°C in frog single fibers injected with two Ca2+ indicators (cf. experiments illustrated in Fig. 1, A–C). Fibers were illuminated with light from a 100-W tungsten-halogen bulb. For each pair of indicators, the measurements were made essentially simultaneously from either the same fiber region or two closely adjacent fiber regions. The first values in column 3 give the central wavelengths of the excitation filters, which had a bandpass (full width at half-maximum) of 30–40 nm; the second values give the cut-on wavelengths of the emission filters. The entries in column 5–7 are the mean ± SE values for the number of experiments indicated in column 4. Column 8 gives the mean ± SE value of the ratio of FDHM measured with the second indicator of each pair to that measured with furaptra. The values of KD,Ca (column 2) were measured in the absence of Mg2+ in 0.1–0.2 M salt solutions at 16–22°C; they were either taken from the literature or, in the case of fura-5N and Mag-fluo-4, measured in this study at 21°C in 0.13 M KCl (pH 7.0, buffered with 10 mM PIPES). The KD,Mg of Mag-fluo-4 in the absence of Ca2+ was also measured in this study and found to be 6.5 mM.
Numbers marked with an asterisk denote a mean value significantly different from 1.0 (P < 0.05).
KD,Ca values from Konishi et al. (21).
KD,Ca values from Woods et al. (16).
KD,Ca values from the Invitrogen catalog.
Indicator fluorescence intensities at rest (FR) and in response to action potential stimulation (ΔF) were recorded from an ∼300-μm length of fiber near the site(s) of indicator injection. With each indicator, the FR measurements were corrected for a small nonindicator-related component of intensity; this was estimated from a comparable fiber region not containing indicator. A fiber was accepted for study if its ΔF/FR responses were all or nothing and had a stable amplitude and time course throughout the experiment. An exception to the requirement of ΔF/FR stability occurred in the experiments with Rhod-5N. With this indicator, a steady decline in the amplitude of the ΔF/FR signal was consistently observed; this appeared to be attributable to a property of Rhod-5N rather than to some change in the fiber's Δ[Ca2+] (see Results).
Estimation of myoplasmic indicator concentrations
With furaptra, the total indicator concentration in myoplasm ([DyeT]) was estimated with Beer's law from indicator-related absorbance changes during fiber activity at 420 nm, as described previously (21). From absorbance and fluorescence measurements in the same fiber, in combination with a measurement of the fiber's diameter, a calibration factor was obtained that related [DyeT] to resting fluorescence intensity normalized by fiber cross-sectional area. This factor then permitted estimation of [DyeT] in fibers in which resting fluorescence and fiber diameter, but not absorbance changes during activity, were measured. In all furaptra experiments, the estimated values of [DyeT] were <0.2 mM. As shown previously (21), such values of [DyeT] with a low-affinity indicator are not expected to significantly buffer Δ[Ca2+], and, indeed, no evidence for perturbation of Δ[Ca2+] due to the presence of furaptra was observed. For example, the amplitude of ΔF/FR at different distances from the injection site did not reveal an inverse dependence on [DyeT], as would have been expected if [DyeT] had been sufficiently large at the injection site to reduce Δ[Ca2+] due to a buffering action of the indicator. An analogous method was used to estimate [DyeT] with Mag-fluo-4, although, in this case, the indicator's resting absorbance (rather than absorbance change during fiber activity) was measured at 490 nm, which is close to Mag-fluo-4's isosbestic wavelength for absorbance changes due to Mg2+ or Ca2+ binding (492 nm). The molar extinction coefficient assumed at 490 nm, 7.0 × 10⁴ M−1 cm−1, was obtained from the in vitro calibrations. With Mag-fluo-4, the fiber values of [DyeT] were <0.1 mM. Analogous estimates of [DyeT] were not made with the other indicators. However, based on the volumes of the solutions injected into the fibers, as well as the absence of evidence for perturbation of Δ[Ca2+] by these indicators, it is likely that similar nonperturbing concentrations ([DyeT] < 0.2 mM) were also present in these experiments.
Intrinsic birefringence signal
In several experiments (see Results), the intrinsic birefringence signal elicited by an action potential (“second component” of Baylor and Oetliker (31)) was measured from the same fiber region from which indicator fluorescence signals were measured. The intrinsic birefringence signal is thought to monitor a change in the occupancy of an intrinsic Ca2+ receptor (32–34) that responds to Δ[Ca2+] with a relatively rapid time course (time of peak, ∼5 ms at 20°C; 31). Thus, monitoring the birefringence signal during the course of an experiment provides a method for determining whether Δ[Ca2+] in a particular fiber region is stable with time. The birefringence signal was measured with light of long wavelength, 780 ± 30 nm, which is beyond the absorbance bands of the indicators.
Indicator diffusion coefficients
With five of the six indicators used in this study, the apparent myoplasmic diffusion coefficient (Dapp) of the indicator was measured. To do this, values of FR and/or ΔF were recorded at different distances from the site of indicator injection ∼1 h after injection. The intensity values as a function of distance and time were then fitted with the one-dimensional diffusion equation by the method of least squares to estimate Dapp (see, e.g., (21)).
Statistics
Student's two-tailed t-test was used to test for differences between mean values; the significance level was set at P < 0.05.
Results
With all of the indicators in this study, the value of KD,Ca in a simple salt solution exceeds 40 μM (Table 2, column 2, and Table 3, legend). Therefore, if the indicators behave in a simple way when in the myoplasmic environment, each is expected to have an off-rate constant for Ca2+ that exceeds 4000 s−1 in myoplasm (16°C (21)). Consequently, the ΔF signal from each indicator is expected to track Δ[Ca2+] with a time constant of <1 ms. The ΔF signals from any two of the indicators are therefore expected to have essentially identical time courses if measured in response to the same Δ[Ca2+]. The experiments described in the next three sections were carried out to test this expectation.
Table 3.
Properties of ΔF/FR of Rhod-5N at early and late times after injection
|
N |
ΔF/FR at 5–10 min |
ΔF/FR at 50–75 min |
||||
|---|---|---|---|---|---|---|
| Peak | FDHM (ms) | Peak | FDHM (ms) | Late/early peak ratio | Late/early FDHM ratio | |
| 1 | 2 | 3 | 4 | 5 | 6 | 7 |
| 3 | 5.4 ± 0.4 | 14.5 ± 3.4 | 2.6 ± 0.3 | 18.6 ± 2.2 | 0.49 ± 0.05∗ | 1.38 ± 0.19 |
Fibers were injected with Rhod-5N only. ΔF/FR was measured with wide-band excitation and emission filters, 510–560 nm and 575–650 nm, respectively. Entries in columns 2–5 give mean ± SE values of the peak and FDHM of ΔF/FR elicited by an action potential at the indicated times after injection. Columns 6 and 7 give the mean ± SE value of the ratio of the peak and FDHM values, respectively, at late/early times. Rhod-5N's KD,Ca is reported to be 320 μM in a 0.15 M salt solution at pH 7.05 and 22°C (Invitrogen catalog).
Mean value significantly different from 1.0 (P < 0.05).
ΔF time courses with OGB-5N, fluo-5N, and fura-5N
In Fig. 1 A, the upper two traces show ΔF/FR signals measured with OGB-5N and furaptra from the same region of a single fiber stimulated by an action potential. The superimposed pair of traces in the lower part of Fig. 1 A permits a comparison of the ΔF time courses from the two indicators. Although the rising phase of the signal from OGB-5N is similar to that from furaptra, the decay of the OGB-5N signal from its peak is noticeably slower. Similar results were seen in two other experiments of this type. On average, the FDHM of the ΔF signal from OGB-5N exceeded that from furaptra by 52 ± 12% (Table 2, column 8). Thus, the ΔF signal from OGB-5N does not track Δ[Ca2+] with kinetic fidelity.
Figure 1.
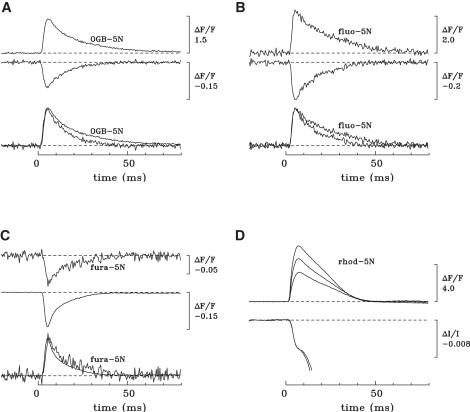
Properties of ΔF/FR signals in frog fibers microinjected with OGB-5N (A), fluo-5N (B), fura-5N (C), or Rhod-5N (D). In A–C, the fiber was also injected with furaptra; the upper two traces show the furaptra signal (unlabeled) and that of the second indicator (labeled). These signals were measured essentially simultaneously from the same fiber region (A and B) or from a closely adjacent fiber region (C). The lower pair of traces in A–C shows the upper pair of traces normalized to have the same displayed peak amplitude. The values of FDHM and peak amplitude of ΔF/FR for furaptra versus the second indicator are 9.7 ms and −0.101 vs. 13.3 ms and 1.38 (A), 10.6 ms and −0.206 vs. 15.9 ms and 2.28 (B), and 6.6 ms and −0.139 vs. 8.2 ms and −0.073 (C). In D, the upper three traces show ΔF/FR of Rhod-5N recorded in a fiber at 8, 29, and 73 min after injection. The peak amplitudes of the signals were 6.03, 4.64, and 3.17, respectively, and the FDHMs were 19.8, 19.7, and 21.0 ms. The lower two traces in D show the fiber's intrinsic birefringence signal recorded at 26 and 64 min after injection from the same fiber region as the upper traces. The birefringence traces are identical in their early time course; at later times they are sensitive to movement artifacts and have been cut off around the time they became obviously contaminated with fiber movement. Fiber diameters and sarcomere lengths (in μm) were 93 and 3.3 (A), 66 and 3.5 (B), 78 and 3.8 (C), and unmeasured and 3.9 (D). The estimated furaptra concentrations in the measurement regions were (in μM) 14 (A), 11 (B), and 71 (C). BTS (5 μM) was present in Ringer's in the experimental results depicted in A and C. The numbers of sweeps averaged for each trace, for furaptra and the second indicator, respectively, were 4 and 2 (A), 2 and 3 (B), and 6 and 16 (C); in D, all traces are single sweeps.
A similar discrepancy was seen in comparisons of the ΔF signals from fluo-5N and furaptra (Fig. 1 B). On average, the FDHM of ΔF with fluo-5N exceeded that with furaptra by 53 ± 3% (Table 2, column 8).
A discrepancy was also found with fura-5N (Fig. 1 C). Unfortunately, the fluorescence intensity of fura-5N is weak (see Materials and Methods); therefore, the signal/noise ratio of ΔF with this indicator is smaller than that with the other indicators (for a given concentration of indicator), and more signal averaging was required for this comparison (see Fig. 1, legend). Nevertheless, the resolution of the measurements was sufficient to reveal that the FDHM of fura-5N's ΔF exceeded that of furaptra's by, on average, 36 ± 7% (Table 2, column 8).
Properties of ΔF/FR with Rhod-5N
Initial experiments with Rhod-5N were carried out in the absence of furaptra. A striking observation in these experiments was that the amplitude of the Rhod-5N ΔF/FR signal decreased progressively with time after injection. This behavior is illustrated by the upper three traces in Fig. 1 D, which show ΔF/FR signals recorded at 8, 29, and 73 min after injection. The peak amplitude of ΔF/FR at the latest time was 47% smaller than at the outset (see legend). Similar time-dependent decreases were seen in all Rhod-5N experiments; the average decrease between the time periods 5–10 min and 50–75 min after injection was 51% (Table 3, column 6).
Taken at face value, a decrease in ΔF/FR amplitude with Rhod-5N implies that the amplitude of Δ[Ca2+] in the measurement region was also decreasing—due, perhaps, to some fiber damage caused by the injection or some toxic effect of Rhod-5N. Fiber damage is unlikely, however, as a decrease in ΔF/FR amplitude was not seen with any of the other indicators. To assess the stability of Δ[Ca2+], the fiber's intrinsic birefringence signal (see Methods) was measured from the same fiber region as Rhod-5N's ΔF/FR signal. As shown by the two traces in the lower part of Fig. 1 D, the birefringence signal remained stable while ΔF/FR was decreasing. Similar results were seen in a second experiment of this type, in which the amplitude of the Rhod-5N signal decreased by 42% whereas the birefringence signal again remained unchanged. Thus, the decrease in the amplitude of the Rhod-5N signal cannot be attributed to a change in Δ[Ca2+].
At least two possibilities might account for the time-dependent decrease in ΔF/FR amplitude. First, some Rhod-5N molecules might become progressively sequestered within an intracellular organelle that 1), undergoes a change in [Ca2+] that is smaller than the myoplasmic Δ[Ca2+]; and/or 2), has a larger value of resting [Ca2+] and thus contributes disproportionately to FR. (An example of the first possibility would be the mitochondria; an example of the second would be the sarcoplasmic reticulum.) In either case, the contribution to ΔF/FR from the sequestered molecules would be smaller than that from the nonsequestered molecules, and the measured ΔF/FR (which is spatially averaged) would thus become smaller with time. A second possibility is that the Rhod-5N molecules might remain within the myoplasm but become chemically altered in a manner that does not greatly change their resting fluorescence but renders them less sensitive to Δ[Ca2+].
A comparison of the FDHM of the Rhod-5N signal with that of furaptra is complicated because, as shown in Table 3, columns 3 and 5, the FDHM of the Rhod-5N signal may have been increasing with time. However, even the briefer average value of FDHM seen with Rhod-5N, 14.5 ms (Table 3, column 3), is larger than the range of average values seen with furaptra, 8.0–12.8 ms (Table 2, column 7). This suggests that like the other 5N indicators, Rhod-5N tracks Δ[Ca2+] with a delay.
Overall, Rhod-5N is an unreliable monitor of the amplitude, and probably the kinetics, of Δ[Ca2+].
ΔF time course with the tricarboxylate Ca2+ indicator Mag-fluo-4
In contrast with the results with the tetracarboxylate indicators, the ΔF time course of Mag-fluo-4 was found to be essentially identical to that of furaptra (Fig. 2 A). On average, the value of the FDHM of ΔF with Mag-fluo-4 was 2% smaller than that with furaptra (Table 2, column 8), a difference that is not statistically significant.
Figure 2.
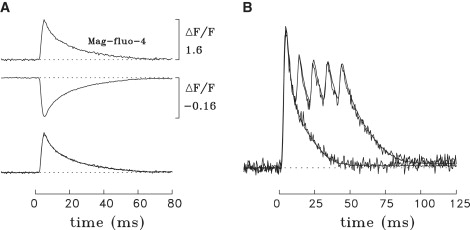
Properties of ΔF/FR signals in frog fibers microinjected with Mag-fluo-4 and furaptra. (A) The presentation is similar to that for Fig. 1, A–C, with recordings made from the same fiber region. The values of FDHM and peak amplitude of ΔF/FR for furaptra versus Mag-fluo-4 are 10.8 ms and −0.158 vs. 10.4 ms and 1.53; the estimated indicator concentrations at the time of the measurements were 104 vs. 16 μM, and the number of sweeps averaged were 2 versus 3. (B) Time courses of ΔF/FR with furaptra and Mag-fluo-4 are compared in response to one and five stimulated action potentials. The recordings were made in the same fiber at two locations separated by 1.7 mm; the signals have been scaled to have the same displayed peak amplitudes in response to the first action potential. Each trace is a single sweep (i.e., no signal averaging was done). The less noisy traces are with Mag-fluo-4; they were time-shifted by −1.0 ms to account for the delay in the propagation of the action potential from the furaptra recording site to the Mag-fluo-4 recording site. In response to the single action potential, the FDHM, the peak amplitude, and the standard deviation of the baseline noise (time before 0 ms) are 7.8 ms, −0.109, and 0.00449, respectively, using furaptra, and 7.7 ms, 1.69, and 0.00450 using Mag-fluo-4. The signal/noise ratios, calculated as the peak amplitude divided by the baseline noise, are 24 for furaptra and 376 with Mag-fluo-4. The estimated indicator concentrations in the measurement regions were 24 μM for furaptra and 39 μM for Mag-fluo-4. Fiber diameter and sarcomere length were 54 μm and 3.6 μm (A) and 100 μm and 3.5 μm (B). BTS was present at 5 μM in both experiments.
Fig. 2 B shows a comparison of the ΔF time courses of Mag-fluo-4 and furaptra in a fiber that was stimulated by both a single action potential and a train of five action potentials at 100 Hz. As expected from Fig. 2 A, the ΔF time courses of both indicators are in excellent agreement. In the comparison in Fig. 2 B, the estimated concentrations of Mag-fluo-4 and furaptra at the measurement sites were similar, 39 and 24 μM, respectively. Thus, Fig. 2 B also reveals that at similar indicator concentrations and with the visible excitation wavelengths chosen for these experiments, the signal/noise ratio of ΔF with Mag-fluo-4 is an order of magnitude larger than that with furaptra (see legend).
In Fig. 2 B, the ΔF signals from both indicators return to a small quasi-steady baseline offset by ∼120 ms after stimulation, both in response to the single action potential and the five-shock train of action potentials. With both indicators, the average amplitude of ΔF during the time period 120–200 ms after stimulation, if expressed as a fraction of the peak ΔF, is in the range 0.02–0.03 for the single action potential and 0.03–0.05 for the five-shock train. Although any interference in the peak of ΔF from a change in free [Mg2+] (Δ[Mg2+]) is expected to be negligible with both indicators, it was previously estimated with furaptra that half or more of the quasi-steady ΔF may arise from a small maintained increase in [Mg2+], with the remainder due to a small maintained increase in [Ca2+] (21,23). Similar contributions of Δ[Ca2+] and Δ[Mg2+] likely apply to the quasi-steady ΔF of Mag-fluo-4. Thus, studies of the late time course of Δ[Ca2+] may be more accurately carried out with another indicator, for example, a high-affinity tetracarboxylate indicator such as fura-2 (e.g., (35)) or fluo-3, which have a high selectivity for Ca2+ over Mg2+.
In summary, the ΔF signal from Mag-fluo-4 appears to track the time course of Δ[Ca2+] with good kinetic fidelity.
Indicator diffusion coefficients
In a number of experiments, the indicator's apparent myoplasmic diffusion coefficient (Dapp) was measured. The average value of Dapp (Table 4, column 5), in combination with the indicator's molecular mass (Table 4, column 3), can be used to estimate the average percentage of the indicator molecules that appear to be bound to myoplasmic constituents of limited mobility (Table 4, column 6 (23); see also (36,37). With furaptra, the average value of Dapp is 7.3 ± 0.3 × 10⁻⁷ cm2 s−1 (which applies to fibers of R. pipiens, the type of frog used in the experiments described here), which is similar to that measured previously, 6.8 ± 0.2 × 10⁻⁷ cm2 s−1 (which applies to fibers of Rana temporaria (23)). The corresponding percentage of bound furaptra molecules in R. pipiens is 54%. With OGB-5N, fura-5N, Rhod-5N, and Mag-fluo-4, the estimated percentages of bound molecules are substantially larger: 80%, 75%, 86%, and 74%, respectively. Thus, the newer indicators examined in this study, all of which are visible wavelength indicators with larger molecular masses than furaptra, also have larger bound percentages than furaptra, as expected from an earlier study (23). The finding that Rhod-5N appears to have a particularly large percentage of bound molecules (86%) may be partly attributable to the possibility that some of the Rhod-5N molecules are sequestered within an internal compartment (see above).
Table 4.
Indicator diffusion coefficients in myoplasm and the estimated percentage of bound indicator molecules
| Indicator | Valence | Molecular mass (Da) | N | Dapp (10−7 cm2 s−1) | Bound indicator molecules (%) |
|---|---|---|---|---|---|
| 1 | 2 | 3 | 4 | 5 | 6 |
| Furaptra | −4 | 430 | 3 | 7.3 ± 0.3 | 54 |
| OGB-5N | −6 | 925 | 4 | 2.7 ± 0.3 | 80 |
| Fluo-5N | −5 | 763 | (not measured) | ||
| Fura-5N | −5 | 668 | 4 | 3.7 ± 0.7 | 75 |
| Rhod-5N | −3 | 783 | 3 | 1.9 ± 0.1 | 86 |
| Mag-fluo-4 | −-3 | 565 | 3 | 4.0 ± 0.4 | 74 |
Columns 2 and 3 give the valence and molecular mass of the ionized form of each indicator. Column 5 gives the mean ± SE values measured for Dapp, the apparent diffusion coefficient of the indicator in myoplasm at 16°C, for the number of fibers given in column 4. Column 6 gives the percentage of each indicator that is bound to immobile myoplasmic constituents, as estimated from the values in columns 3 and 5 and the formula given in Zhao et al. (23).
Discussion
The low-affinity Ca2+ indicator PDAA (38), which is an absorbance but not fluorescence indicator, is thought to give the most reliable measurement of the amplitude and time course of Δ[Ca2+] elicited by an action potential in frog skeletal muscle fibers (18,19). Because the time course of Δ[Ca2+] estimated with furaptra is almost identical to that measured with PDAA (21), the furaptra ΔF signal also appears to give reliable kinetic information about Δ[Ca2+]. With the four 5N indicators of this study (OGB-5N, fluo-5N, fura-5N, and Rhod-5N), the FDHM of ΔF is larger than that measured with furaptra (Fig. 1 and Tables 2 and 3). Similar results were also found with two 5N indicators studied previously (Calcium-orange-5N and Calcium-green-5N; Table 1). Taken together, the average increase in FDHM of ΔF observed with the 5N indicators ranges from 36% (fura-5N; this study) to 240% (Calcium-green-5N; ref. 23). Thus, the available 5N indicators do not give accurate kinetic information about Δ[Ca2+].
At least three possibilities might account for the increased values of FDHM of ΔF observed with the 5N indicators. First, the fluorescence of (some) bound indicator molecules (cf. col. 6 of Table 3) might change indirectly as a result of Ca2+ binding to intrinsic Ca2+ buffer sites, such as those on troponin, and thus contribute a slow component to ΔF that is not directly related to Ca2+ complexation with the indicator (cf. the slow component of the Mag-fura-red ΔF signal described in ref. 23). Second, (some) bound indicator molecules might react with Ca2+ with unexpectedly slow kinetics, thus increasing FDHM. Finally, because indicator binding to sarcomeric structures might not be uniform within the sarcomere, regions of the sarcomere in which free [Ca2+] changes more slowly than average (3,20) might make disproportionately large contributions to the ΔF signal, which is a spatially averaged measurement.
Encouragingly, the time course of Mag-fluo-4's ΔF was found to be essentially identical to that of furaptra's (Fig. 2 and Table 2). This agreement supports the idea that the ΔF from Mag-fluo-4 and furaptra (as well as from two other tri-carboxylate indicators, Mag-indo-1 and Mag-fura-5) tracks Δ[Ca2+] with good kinetic fidelity (Tables 1 and 2).
Advantages and disadvantages of Mag-fluo-4 compared with furaptra
With visible excitation wavelengths, the signal/noise ratio of Mag-fluo-4's ΔF is about an order of magnitude larger than that of furaptra's at similar indicator concentrations (Fig. 2 B). This difference implies that Mag-fluo-4 will prove to be a more useful Ca2+ indicator than furaptra for a number of experiments, e.g., for monitoring the kinetics of Δ[Ca2+] from relatively small cell volumes. In small mouse toe muscle fibers, Mag-fluo-4 has already been shown to report an action-potential evoked ΔF with a large signal/noise ratio (8,27), and Mag-fluo-4 will likely be similarly useful in experiments on other small cells. Mag-fluo-4 may also prove useful for monitoring local Ca2+ signals with confocal microscopy. Previously, local Ca2+ signals elicited by action potentials have been recorded with subsarcomeric resolution in frog skeletal fibers with Rhod-2 (39), Calcium-green-5N (39), and fluo-3 (40) and, in mouse skeletal fibers, with OGB-5N (41,42). The high affinity of Rhod-2 and fluo-3 for Ca2+ does not permit these indicators to report accurate kinetic information about subsarcomeric Δ[Ca2+], and, as mentioned in the preceding section, this information is not available with Calcium-green-5N and OGB-5N. It may be possible, however, to obtain this information with Mag-fluo-4.
Mag-fluo-4 appears to have one disadvantage when compared with furaptra, namely, a greater sensitivity to [Mg2+]. First, as judged from the dissociation constants of the indicators for Ca2+ and Mg2+ in a simple salt solution, furaptra has a slightly higher selectivity for Ca2+ over Mg2+ than Mag-fluo-4 (KD,Mg/KD,Ca = 120 for furaptra vs. 93 for Mag-fluo-4; Tables 1 and 2). Second, and more important, with the visible excitation bands used in the experiments (Table 2), FR of furaptra arises primarily from the metal-free form of the indicator, as the fluorescence of the Mg2+-bound form of furaptra is only about one-fifth that of the Mg2+-free form (21,24); in contrast, with Mag-fluo-4, FR arises primarily from the Mg2+-bound form of the indicator, as the fluorescence of this form is ∼100-fold larger than that of the metal-free form (Invitrogen catalog). Although the average fraction of Mag-fluo-4 that is bound with Mg2+at rest was not measured in the experiments, this fraction is likely to be similar to that previously measured for furaptra in frog fibers, 0.08 (22), as these indicators have similar dissociation constants for Mg2+, at least in a simple salt solution (5.3 mM for furaptra, 6.5 mM for Mag-fluo-4). (With both furaptra and Mag-fluo-4, the contribution of Ca2+-bound indicator to FR can safely be ignored because of the small value of resting [Ca2+], < 0.1 μM.) Thus, with Mag-fluo-4, FR, and hence ΔF/FR, is likely to be more sensitive to variations in resting [Mg2+] than with furaptra. Consequently, calibration of the amplitude of ΔF/FR in Δ[Ca2+] units may prove to be more variable with Mag-fluo-4 than with furaptra. Although such calibrations were not carried out in this article, they were carried out previously with furaptra (21,23) based on a comparison of the relative amplitudes of the furaptra and PDAA signals in experiments like those in Fig. 1, A–C, and Fig. 2 A
Accuracy of measurements of Δ[Ca2+] in mouse fast-twitch fibers with low-affinity indicators
There are three reports in the literature in which low-affinity indicators were used to measure the FDHM of Δ[Ca2+] elicited by an action potential in fast-twitch fibers of young-adult mice (6-18 weeks of age). One study used small bundles of fibers dissected from extensor digitorum longus muscle and measured Δ[Ca2+] in one fiber within the bundle after pressure injection of the fiber with furaptra. FDHM was reported to be 4.6 ± 0.3 ms (mean ± SE) at 16°C and 2.0 ± 0.1 ms at 28°C (Table II of Hollingworth et al. (13)); a value of 3.3 ms at 22°C was estimated by interpolation. This value at 22°C is in good agreement with the value 3.6 ± 0.2 ms at 22°C obtained with Mag-fluo-4 in enzyme-dissociated fibers from flexor digitorum brevis (FDB) muscle, in which the indicator was introduced by the AM loading technique (Table 1 of ref. 8). In contrast, a value of 8.0 ± 0.5 ms at 22°C was obtained with OGB-5N in enzyme-dissociated FDB fibers in which the indicator was introduced by diffusion from a patch pipette (Table 2 of ref. 16). The good agreement with furaptra and Mag-fluo-4 in these studies—and the larger value with OGB-5N—is consistent with the findings reported here in frog fibers. The 8 ms value obtained with OGB-5N is thus likely to be an over-estimate. (Note: in frog and mouse fibers having similar diameters, 33-51 μm, the value of FDHM of Δ[Ca2+] is larger in frog than in mouse, 9.6 ± 0.6 ms vs. 4.6 ± 0.3 ms at 16°C (13).)
Summary
Our experiments indicate that a fluorescent indicator with the ability to track Δ[Ca2+] in skeletal muscle with kinetic fidelity and with negligible interference from [Mg2+] still remains to be identified. If found, such an indicator would likely become the preferred indicator for many types of measurements of Δ[Ca2+] in muscle fibers and in other cells that have a large and brief Δ[Ca2+]. In the meantime, four tri-carboxylate indicators—furaptra, Mag-indo-1, Mag-fura-5, and Mag-fluo-4—appear to be valuable indicators for monitoring the main kinetic features of Δ[Ca2+]. Because of the large signal/noise ratio obtainable in measurements with Mag-fluo-4, this indicator appears to have the most immediate advantages for tracking rapid Ca2+ signals in small cell volumes.
Acknowledgments
We thank Dr. Christian Soeller for information on his unpublished measurement of the KD,Ca of Mag-fluo-4 and Dr. Knox Chandler for discussions.
This work was supported by grants from the National Institutes of Health (GM 86167) and the Muscular Dystrophy Association. K.R.G. is an employee of Invitrogen.
References
- 1.Baylor S.M., Chandler W.K., Marshall M.W. Sarcoplasmic reticulum calcium release in frog skeletal muscle fibres estimated from arsenazo III calcium transients. J. Physiol. 1983;344:625–666. doi: 10.1113/jphysiol.1983.sp014959. [DOI] [PMC free article] [PubMed] [Google Scholar]
- 2.Melzer W., Rios E., Schneider M.F. Time course of calcium release and removal in skeletal muscle fibers. Biophys. J. 1984;45:637–641. doi: 10.1016/S0006-3495(84)84203-4. [DOI] [PMC free article] [PubMed] [Google Scholar]
- 3.Cannell M.B., Allen D.G. Model of calcium movements during activation in the sarcomere of frog skeletal muscle. Biophys. J. 1984;45:913–925. doi: 10.1016/S0006-3495(84)84238-1. [DOI] [PMC free article] [PubMed] [Google Scholar]
- 4.Delbono O., Meissner G. Sarcoplasmic reticulum Ca2+ release in rat slow- and fast-twitch muscles. J. Membr. Biol. 1996;151:123–130. doi: 10.1007/s002329900063. [DOI] [PubMed] [Google Scholar]
- 5.Jiang Y.-H., Klein M.G., Schneider M.F. Numerical simulation of Ca2+ “sparks”in skeletal muscle. Biophys. J. 1999;77:2333–2357. doi: 10.1016/s0006-3495(99)77072-4. [DOI] [PMC free article] [PubMed] [Google Scholar]
- 6.Ríos E., Stern M.D., Gonzalez A., Pizarro G., Shirokova N. Calcium release flux underlying Ca2+ sparks of frog skeletal muscle. J. Gen. Physiol. 1999;114:31–48. doi: 10.1085/jgp.114.1.31. [DOI] [PMC free article] [PubMed] [Google Scholar]
- 7.Chandler W.K., Hollingworth S., Baylor S.M. Simulation of calcium sparks in frog cut skeletal muscle fibers. J. Gen. Physiol. 2003;121:311–324. doi: 10.1085/jgp.200308787. [DOI] [PMC free article] [PubMed] [Google Scholar]
- 8.Caputo C., Bolanos P., Gonzalez A. Inactivation of Ca2+ transients in amphibian and mammalian muscle fibres. J. Muscle Res. Cell Motil. 2004;25:315–328. doi: 10.1007/s10974-004-4071-z. [DOI] [PubMed] [Google Scholar]
- 9.Ursu D., Schuhmeier P., Melzer W. Voltage-controlled Ca2+ release and entry flux in isolated adult muscle fibres of the mouse. J. Physiol. 2005;562:347–365. doi: 10.1113/jphysiol.2004.073882. [DOI] [PMC free article] [PubMed] [Google Scholar]
- 10.Baylor S.M., Hollingworth S. Simulation of Ca2+ movements within the sarcomere of fast-twitch mouse fibers stimulated by action-potentials. J. Gen. Physiol. 2007;130:283–302. doi: 10.1085/jgp.200709827. [DOI] [PMC free article] [PubMed] [Google Scholar]
- 11.Royer L., Pouvreau S., Rios E. Evolution and modulation of intracellular calcium release during long-lasting, depleting depolarization in mouse muscle. J. Physiol. 2008;586:4609–4629. doi: 10.1113/jphysiol.2008.157990. [DOI] [PMC free article] [PubMed] [Google Scholar]
- 12.Westerblad H., Allen D.G. Changes of myoplasmic calcium concentrations during fatigue in single mouse muscle fibers. J. Gen. Physiol. 1991;98:615–635. doi: 10.1085/jgp.98.3.615. [DOI] [PMC free article] [PubMed] [Google Scholar]
- 13.Hollingworth S., Zhao M., Baylor S.M. The amplitude and time course of the myoplasmic free [Ca2+] transient in fast-twitch fibers of mouse muscle. J. Gen. Physiol. 1996;108:455–469. doi: 10.1085/jgp.108.5.455. [DOI] [PMC free article] [PubMed] [Google Scholar]
- 14.Liu Y., Kranias E.G., Schneider M.F. Regulation of Ca2+ handling by phosphorylation status in mouse fast- and slow-twitch skeletal muscle fibers. Am. J. Physiol. 1997;273:C1915–C1924. doi: 10.1152/ajpcell.1997.273.6.C1915. [DOI] [PubMed] [Google Scholar]
- 15.Gonzalez E., Messi M.L., Zheng Z., Delbono O. Insulin-like growth factor-1 prevents age-related decrease in specific force and intracellular Ca2+ in single intact muscle fibres from transgenic mice. J. Physiol. 2003;552:833–844. doi: 10.1113/jphysiol.2003.048165. [DOI] [PMC free article] [PubMed] [Google Scholar]
- 16.Woods C.E., Novo D., DiFranco M., Vergara J.L. The action potential-evoked sarcoplasmic reticulum calcium release is impaired in mdx mouse muscle fibres. J. Physiol. 2004;557:59–75. doi: 10.1113/jphysiol.2004.061291. [DOI] [PMC free article] [PubMed] [Google Scholar]
- 17.Hollingworth S., Zeiger U., Baylor S.M. Comparison of the myoplasmic calcium transient elicited by an action potential in intact fibres of mdx and normal mice. J. Physiol. 2008;200:5063–5075. doi: 10.1113/jphysiol.2008.160507. [DOI] [PMC free article] [PubMed] [Google Scholar]
- 18.Hirota A., Chandler W.K., Southwick P.L., Waggoner A.S. Calcium signals recorded from two new purpurate indicators inside frog cut twitch fibers. J. Gen. Physiol. 1989;94:597–631. doi: 10.1085/jgp.94.4.597. [DOI] [PMC free article] [PubMed] [Google Scholar]
- 19.Konishi M., Baylor S.M. Myoplasmic calcium transients monitored with purpurate indicator dyes injected into intact frog skeletal muscle fibers. J. Gen. Physiol. 1991;97:245–270. doi: 10.1085/jgp.97.2.245. [DOI] [PMC free article] [PubMed] [Google Scholar]
- 20.Baylor S.M., Hollingworth S. Model of sarcomeric Ca2+ movements, including ATP Ca2+ binding and diffusion, during activation of frog skeletal muscle. J. Gen. Physiol. 1998;112:297–316. doi: 10.1085/jgp.112.3.297. [DOI] [PMC free article] [PubMed] [Google Scholar]
- 21.Konishi M., Hollingworth S., Harkins A.B., Baylor S.M. Myoplasmic calcium transients in intact frog skeletal muscle fibers monitored with the fluorescent indicator furaptra. J. Gen. Physiol. 1991;97:271–301. doi: 10.1085/jgp.97.2.271. [DOI] [PMC free article] [PubMed] [Google Scholar]
- 22.Konishi M., Suda N., Kurihara S. Fluorescence signals from the Mg2+/Ca2+ indicator furaptra in frog skeletal muscle fibers. Biophys. J. 1993;64:223–239. doi: 10.1016/S0006-3495(93)81359-6. [DOI] [PMC free article] [PubMed] [Google Scholar]
- 23.Zhao M., Hollingworth S., Baylor S.M. Properties of tri- and tetra-carboxylate Ca2+ indicators in frog skeletal muscle fibers. Biophys. J. 1996;70:896–916. doi: 10.1016/S0006-3495(96)79633-9. [DOI] [PMC free article] [PubMed] [Google Scholar]
- 24.Raju B., Murphy E., Levy L.A., Hall R.D., London R.E. A fluorescent indicator for measuring cytosolic free magnesium. Am. J. Physiol. 1989;256:C540–C548. doi: 10.1152/ajpcell.1989.256.3.C540. [DOI] [PubMed] [Google Scholar]
- 25.Tsien R.Y. New calcium indicators and buffers with high selectivity against magnesium and protons: design, synthesis, and properties of prototype structures. Biochemistry. 1980;19:2396–2404. doi: 10.1021/bi00552a018. [DOI] [PubMed] [Google Scholar]
- 26.Tsien R.Y. Intracellular signal transduction in four dimensions: from molecular design to physiology. Am. J. Physiol. 1992;263:C723–C728. doi: 10.1152/ajpcell.1992.263.4.C723. [DOI] [PubMed] [Google Scholar]
- 27.Capote J., Bolanos P., Schuhmeier R.P., Melzer W., Caputo C. Calcium transients in developing mouse skeletal muscle fibres. J. Physiol. 2005;564:451–456. doi: 10.1113/jphysiol.2004.081034. [DOI] [PMC free article] [PubMed] [Google Scholar]
- 28.Grynkiewicz G., Poenie M., Tsien R.Y. A new generation of Ca2+ indicators with greatly improved fluorescence properties. J. Biol. Chem. 1985;260:3440–3450. [PubMed] [Google Scholar]
- 29.Gee K.R., Brown K.A., Chen W.-N.U., Bishop-Stewart J., Gray D. Chemical and physiological characterization of fluo-4 Ca2+-indicator dyes. Cell Calcium. 2000;27:97–106. doi: 10.1054/ceca.1999.0095. [DOI] [PubMed] [Google Scholar]
- 30.Cheung A., Dantzig J.A., Hollingworth S., Baylor S.M., Goldman Y.E. A small-molecule inhibitor of skeletal muscle myosin II. Nat. Cell Biol. 2002;4:83–88. doi: 10.1038/ncb734. [DOI] [PubMed] [Google Scholar]
- 31.Baylor S.M., Oetliker H. A large birefringence signal preceding contraction in single twitch fibres of the frog. J. Physiol. 1977;264:141–162. doi: 10.1113/jphysiol.1977.sp011661. [DOI] [PMC free article] [PubMed] [Google Scholar]
- 32.Suarez-Kurtz G., Parker I. Birefringence signals and calcium transients in skeletal muscle. Nature. 1977;270:746–748. doi: 10.1038/270746a0. [DOI] [PubMed] [Google Scholar]
- 33.Baylor S.M., Chandler W.K., Marshall M.W. Calcium release and sarcoplasmic reticulum membrane potential in frog skeletal muscle fibres. J. Physiol. 1984;348:209–238. doi: 10.1113/jphysiol.1984.sp015106. [DOI] [PMC free article] [PubMed] [Google Scholar]
- 34.Hollingworth S., Baylor S.M. Effect of calcium (Ca) buffering by Fura-2 on the second component of the intrinsic birefringence signal in frog isolated twitch muscle fibres. J. Physiol. 1987;391:90P. [Google Scholar]
- 35.Klein M.G., Kovacs L., Simon B.J., Schneider M.F. Decline of myoplasmic Ca2+, recovery of calcium release and sarcoplasmic Ca2+ pump properties in frog skeletal muscle. J. Physiol. 1991;414:639–671. doi: 10.1113/jphysiol.1991.sp018771. [DOI] [PMC free article] [PubMed] [Google Scholar]
- 36.Maylie J., Irving M., Sizto N.L., Chandler W.K. Comparison of Arsenazo III optical signals in intact and cut frog twitch fibers. J. Gen. Physiol. 1987;89:41–81. doi: 10.1085/jgp.89.1.41. [DOI] [PMC free article] [PubMed] [Google Scholar]
- 37.Kushmerick M.J., Podolsky R.J. Ionic mobility in muscle cells. Science. 1969;166:1297–1298. doi: 10.1126/science.166.3910.1297. [DOI] [PubMed] [Google Scholar]
- 38.Southwick P.L., Waggoner A.S. Synthesis of purpurate-1,1′-diacetic acid (PDAA) tri-potassium salt. A new calcium indicator for biological applications. Org. Prep. Proced. Int. 1989;21:493–500. [Google Scholar]
- 39.Escobar A.L., Monk J.R., Fernandez J.M., Vergara J.L. Localisation of the site of Ca2+ release at the level of a single sarcomere in skeletal muscle fibers. Nature. 1994;367:739–741. doi: 10.1038/367739a0. [DOI] [PubMed] [Google Scholar]
- 40.Hollingworth S., Soeller C., Baylor S.M., Cannell M.B. Sarcomeric Ca2+ gradients during activation of frog skeletal muscle fibres imaged with confocal and 2-photon microscopy. J. Physiol. 2000;526:551–560. doi: 10.1111/j.1469-7793.2000.t01-1-00551.x. [DOI] [PMC free article] [PubMed] [Google Scholar]
- 41.Gomez J., Neco P., DiFranco M., Vergara J.L. Calcium release domains in mammalian skeletal muscle studied with two-photon imaging and spot detection techniques. J. Gen. Physiol. 2006;127:623–637. doi: 10.1085/jgp.200509475. [DOI] [PMC free article] [PubMed] [Google Scholar]
- 42.DiFranco M., Woods D.C.E., Capote J., Vergara J.L. Dystrophic skeletal muscle fibers display alterations at the level of calcium microdomains. Proc. Natl. Acad. Sci. USA. 2008;105:14698–14703. doi: 10.1073/pnas.0802217105. [DOI] [PMC free article] [PubMed] [Google Scholar]