

Abstract
The enormous complexity of the human brain ultimately derives from a finite set of molecular instructions encoded in the human genome. These instructions can be directly studied by exploring the organization of the brain’s transcriptome through systematic analysis of gene coexpression relationships. We analyzed gene coexpression relationships in microarray data generated from specific human brain regions and identified modules of coexpressed genes that correspond to neurons, oligodendrocytes, astrocytes and microglia. These modules provide an initial description of the transcriptional programs that distinguish the major cell classes of the human brain and indicate that cell type–specific information can be obtained from whole brain tissue without isolating homogeneous populations of cells. Other modules corresponded to additional cell types, organelles, synaptic function, gender differences and the subventricular neurogenic niche. We found that subventricular zone astrocytes, which are thought to function as neural stem cells in adults, have a distinct gene expression pattern relative to protoplasmic astrocytes. Our findings provide a new foundation for neurogenetic inquiries by revealing a robust and previously unrecognized organization to the human brain transcriptome.
With genomic data accumulating at an unprecedented rate, biologists are increasingly challenged to understand how specific functions, embodied by specific tissues, emerge from a common set of molecular instructions. Nowhere is this challenge greater than in the brain, whose staggering complexity derives from the abundance and diversity of cell types from which it is comprised1. Microarrays have emerged as a powerful tool for exploring the functional identities of tissues by measuring the expression levels for thousands of genes in a single experiment. In the human brain, microarrays have been used to compare gene expression between different regions2,3 and pathophysiological states4-7. Although these efforts have yielded numerous biological insights, an integrated framework describing gene expression in the human brain has yet to emerge.
Systems biological approaches predicated on holistic analysis of microarray data have recently begun to elucidate patterns of transcriptome organization across tissues and species8-18. These approaches typically involve identifying groups of genes, or ‘modules’, with expression levels that are highly correlated across samples. In contrast to analysis of differential expression, which seeks to compare mean expression levels for individual genes between two or more groups, this strategy seeks to leverage the inherent variability in gene expression that exists among biological samples from a single group to illuminate higher-order relationships among gene products. Characterization of these relationships can, in turn, offer insights into disparate transcriptional programs that are represented in the genome.
We hypothesized that a comprehensive analysis of gene coexpression relationships in normal human brain regions would provide a new window into human brain complexity if the corresponding transcriptomes were reproducibly organized into modules of coexpressed genes with clear functional interpretations. Our goal in this study was to provide an integrated view of transcriptome organization in three human brain regions through detailed exploration of gene coexpression relationships. Using this approach, we determined that the transcriptomes of human cerebral cortex, caudate nucleus and cerebellum possess a rich structure that has not, to the best of our knowledge, been described previously and reflects the underlying cellular composition of brain tissue. The elucidation of this structure has substantial implications for the molecular analysis of brain function in health and disease.
RESULTS
Gene coexpression networks in the human brain
We set out to investigate the organization of the transcriptome in the human brain by applying weighted gene coexpression network analysis (WGCNA)18 to four microarray data sets generated from 160 human brain control samples. Two cortical data sets were assembled to provide independent validation of gene coexpression relationships across individuals and microarray platforms and two data sets consisting of samples from either caudate nucleus or cerebellum were assembled to enable comparisons across brain regions. Data set 1 (CTX) consisted of 67 samples from 67 individuals representing four cortical areas4,6,7 and data set 2 (CTX_95) consisted of 42 samples from 32 individuals representing six cortical areas2,5,19-22. Data set 3 (CN) consisted of 27 samples from 27 individuals taken from the head of the caudate nucleus and data set 4 (CB) consisted of 24 samples from 24 individuals taken from cerebellar hemisphere6 (detailed sample information can be found in Supplementary Table 1 online). All samples from CTX, CN and CB were analyzed using Affymetrix U133A microarrays, whereas samples from CTX_95 were analyzed using Affymetrix U95A/v2 microarrays. To ensure the highest possible level of data quality, rigorous quality control procedures were implemented to eliminate mis-targeted and nonspecific probes on the microarrays before generating expression values23, identify and remove outlier samples from the data sets, and carry out additional normalization to remove ‘batch effects’ introduced by combining data from multiple studies24 (Methods).
We constructed a weighted gene coexpression network for each data set on the basis of the pair-wise Pearson correlations for all expressed genes (for a brief glossary of WGCNA terminology, see Supplementary Methods online). The Pearson correlation matrix for each data set was transformed into a matrix of connection strengths using a power function, which resulted in a ‘weighted’ network18. WGCNA seeks to identify modules of coexpressed genes with high topological overlap, a pair-wise measure that describes the similarity of two genes’ coexpression relationships with all other genes in the network18,25. Genes with high topological overlap are therefore highly correlated with the same genes in the network. To test the ability of topological overlap to predict known functional relationships in the human brain, we first asked whether pairs of proteins that physically interact have higher topological overlap in gene coexpression networks than pairs that do not. We obtained a set of 17,540 experimentally validated interacting human protein pairs from EBI (European Bioinformatics Institute)/ IntAct26 and cross-referenced them with expressed genes in CTX, CN and CB. Mean topological overlap was significantly higher for interacting protein pairs than for randomly selected pairs in each brain region (CTX, P = 9.3 × 10−54; CN, P = 5.0 × 10−79; CB, P = 1.9 × 10−48; Supplementary Fig. 1 online). These results are consistent with findings in unicellular organisms27 and constitute the first global evidence that gene coexpression patterns are correlated with protein interactions in the human brain.
For each human brain data set, modules of coexpressed genes were identified by unsupervised hierarchical clustering on the basis of topological overlap (see Methods and refs. 15,18 for additional details regarding network construction and module identification). We identified 19 modules in CTX, 17 modules in CTX_95, 23 modules in CN and 22 modules in CB (Fig. 1 and Supplementary Fig. 2 online). To determine whether modules from different networks were composed of the same genes, we calculated the overlap and corresponding hypergeometric probability for each possible pair of modules (Supplementary Table 2 online). The majority of the gene coexpression modules that we identified in cerebral cortex were found in both CTX and CTX_95 (Fig. 2), with the extent of overlap ranging from 36% (module 19 (M19), P = 3.8 × 10⁻⁴) to 87% (M9, P = 1.9 × 10−68). To provide additional cross-platform validation for these findings, we also analyzed a microarray data set generated from human cerebral cortex samples using Illumina HumanRefseq-8 microarrays28 (CTX_ILMN). A majority of the gene coexpression modules that we identified in CTX were found in CTX_ILMN, including 70% of the modules that we found in both CTX and CTX_95 (Supplementary Network Analysis online). These results indicate that the cortical transcriptome is organized into modules of coexpressed genes that are reproducible across individuals and microarray platforms.
Figure 1.
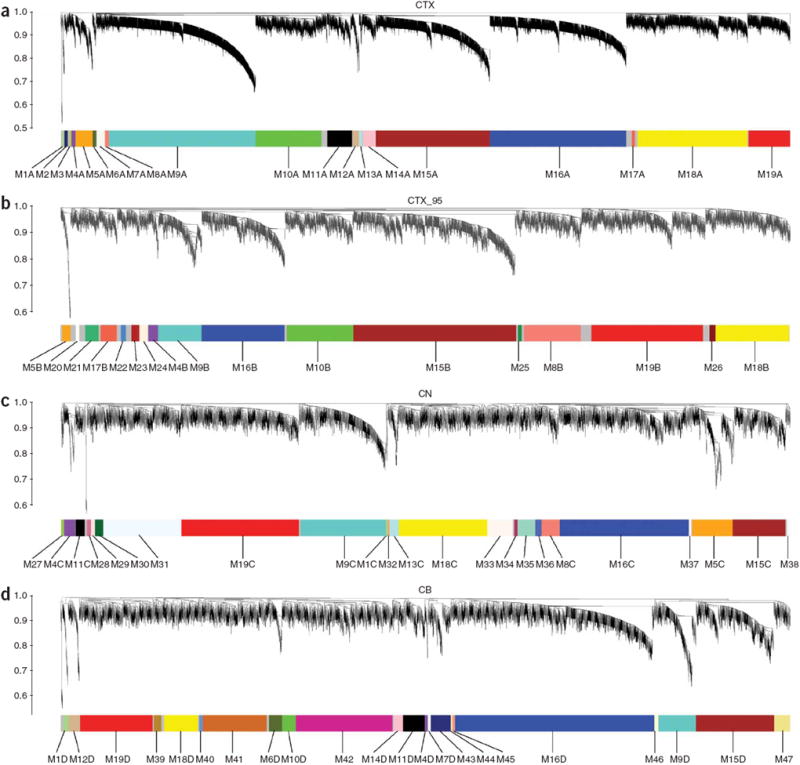
Network analysis of gene expression in human cerebral cortex, caudate nucleus and cerebellum identifies distinct modules of coexpressed genes. (a–d) Dendrograms produced by average linkage hierarchical clustering of genes on the basis of topological overlap (Methods). Modules of coexpressed genes were assigned colors and numbers as indicated by the horizontal bar beneath each dendrogram. Modules from different networks with significant overlap (corrected hypergeometric P < 0.05) were assigned the same color and number, with networks denoted by letters (for example, M9A for CTX, M9B for CTX_95, M9C for CN and M9D for CB). We used 67 samples and 5,549 probe sets for CTX (a), 42 samples and 3,203 probe sets for CTX_95 (b), 27 samples and 4,050 probe sets for CN (c), and 24 samples and 4,029 probe sets for CB (d). Samples from a, c and d were analyzed on Affymetrix U133A microarrays, whereas samples from b were analyzed on Affymetrix U95A/v2 microarrays.
Figure 2.

Many gene coexpression modules are present in multiple human brain networks. Comparison of the 19 gene coexpression modules identified in CTX with modules identified in CTX_95, CN and CB. Modules with significant overlap (corrected hypergeometric P < 0.05) are depicted by horizontal bars (CTX_95, bottom; CN, middle; CB, top). For example, M1 did not show significant overlap between CTX and any modules in CTX_95, but overlapped 80% with a module found in CN (P = 4.0 × 10⁻¹⁸) and 92% with a module found in CB (P = 5.9 × 10⁻²⁴). Numbers in parentheses on the right indicate the maximum possible number of shared genes per pair of modules (that is, the denominator used to calculate percent overlap). NS, not significant.
Comparisons of gene coexpression modules identified in CTX, CN and CB yielded a somewhat unexpected result: many modules showed significant preservation of gene coexpression relationships across brain regions (Fig. 2 and Supplementary Table 2). Indeed, comparisons between CTX and CN indicated that seven modules showed > 50% overlap (P = 4.0 × 10⁻¹⁸ (high) to P = 4.9 × 10−155 (low)), whereas comparisons between CTX and CB indicated that eight modules showed > 50% overlap (P = 6.6 × 10⁻¹⁸ (high) to P = 1.4 × 10−123 (low)) (Fig. 2). Among modules with the most substantial overlap across networks, six were identified in all networks (M4, M9, M15, M16, M18 and M19), five in three networks (M1, M5, M8, M10 and M11) and six in two networks (M6, M7, M12, M13, M14 and M17) (Fig. 2 and Supplementary Table 2). In total, 61 out of 81 (77%) of the gene coexpression modules identified in this analysis revealed significant overlap with at least one other module from one other network (Supplementary Table 2).
Module membership is highly consistent
The initial assignment of genes to modules using WGCNA is binary: in a given network, each gene will be assigned to one module or zero modules. In vivo, however, a gene may be expressed in multiple cell types or participate in multiple functional pathways. Therefore, to provide a more complete representation of gene coexpression relationships in each network, we summarized each module with a single representative expression profile, which we refer to as the module eigengene (Methods and Supplementary Fig. 2). We then calculated the Pearson correlation between the expression level of each gene on the microarray and each module eigengene. This quantity, which we refer to as a gene’s ‘module membership’, describes the extent to which a gene conforms to the characteristic expression pattern of a module29 (initial module assignments (Fig. 1), complete module membership values and associated P values are reported for all genes in each network in Supplementary Tables 3-6 online).
To explore the reproducibility of module membership for individual genes, we directly compared this quantity between networks for conserved modules (Fig. 3 and Supplementary Fig. 3 online). Module membership was markedly consistent across networks, indicating that a gene’s network position is highly reproducible. Notably, despite the use of different microarrays and samples from different individuals, module membership was highly correlated between CTX and CTX_95 (M9: rho = 0.70, P = 9.0 × 10−271; M15: rho = 0.81, P < 1.0 × 10−300; M16: rho = 0.63, P = 3.4 × 10−203; Fig. 3). Similar results were obtained for comparisons of CTX with CTX_ILMN (M9: rho = 0.65, P = 1.6 × 10−191; M15: rho = 0.73, P = 5.0 × 10−264; M16: rho = 0.61, P = 3.0 × 10−162; Supplementary Network Analysis). These results validate the reproducibility of module membership values for individual genes and indicate that conserved gene coexpression modules reflect consistent underlying sources of variation in microarray data generated from human brain.
Figure 3.
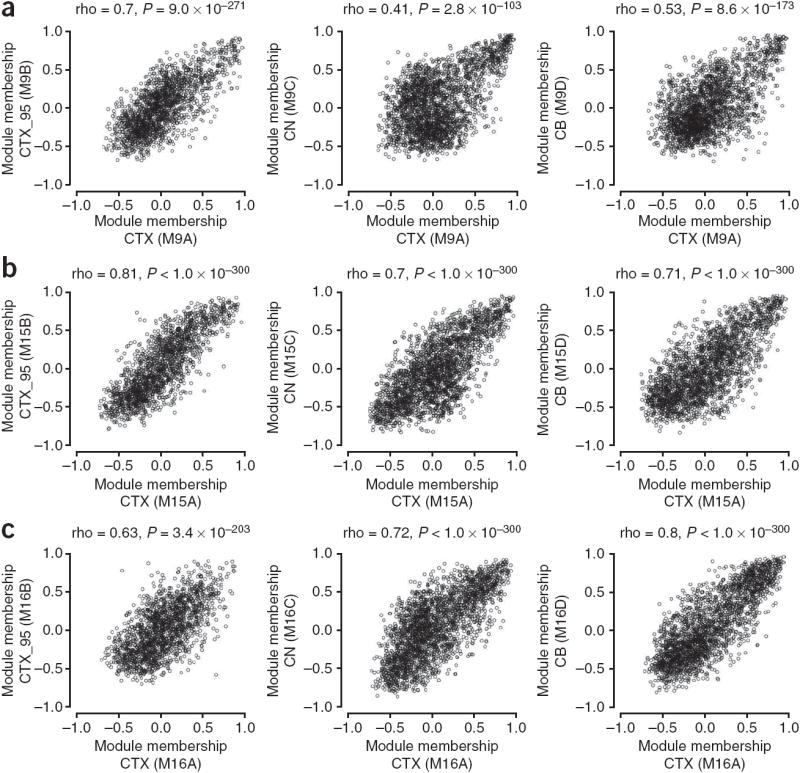
Module membership is highly correlated in multiple human brain networks. (a–c) Comparison of module membership between networks for M9 (a), M15 (b) and M16 (c). For each module, the correlation (Spearman) between module membership for CTX and CTX_95, CTX and CN, and CTX and CB was assessed. Module membership was correlated for the intersection of all probe sets or genes used to construct the networks depicted in Figure 1 (CTX versus CTX_95, 1,805 genes; CTX versus CN, 2,542 probe sets; CTX versus CB, 2,374 probe sets).
The notable extent of preservation of M9, M15 and M16 in all four networks (Figs. 2 and 3 and Supplementary Table 2) warranted further exploration. To begin to characterize these modules in terms of their constituent genes, we plotted the expression levels for the ten genes with the strongest average membership for each of these modules across all four networks (Fig. 4); these genes were consistently coexpressed in every network.
Figure 4.
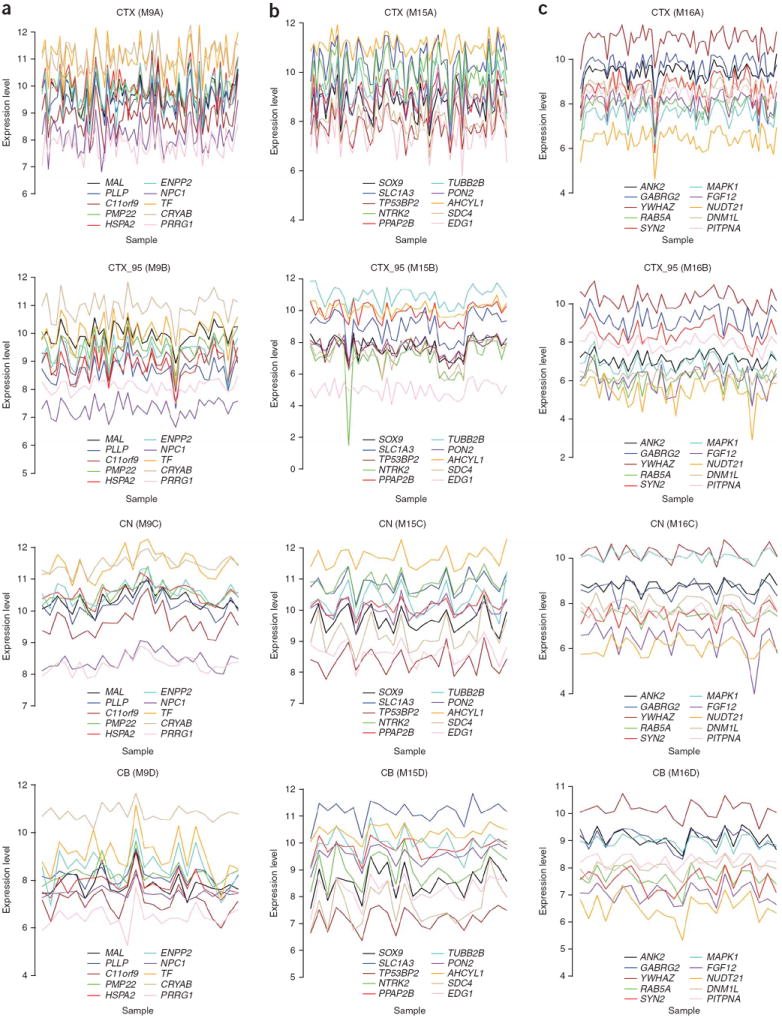
Module membership identifies groups of genes that are consistently coexpressed in the human brain. Expression levels of genes with the highest average module membership for M9 (a), M15 (b), and M16 (c) (columns) across all four networks (rows). In each network, module membership was averaged for genes represented by multiple probe sets. Module membership values for all genes were then averaged across all networks (genes that were not represented on both Affymetrix U133A and U95A/v2 microarrays were excluded). Log2-transformed expression levels of the top ten genes ranked by average module membership are shown for all samples in each network (gene symbols appear in legends) (similar plots for all modules can be found in Supplementary Fig. 2).
Conserved modules are enriched for markers of cell classes
Inspection of the genes with the strongest membership for M9, M15 and M16 (Fig. 4) suggested that these modules consisted of genes that are preferentially expressed in oligodendrocytes, astrocytes and neurons, respectively, relative to other cell types in the brain. For example, several of the genes in M9 are involved in myelination, including MAL, PLLP and PMP22. Genes in M15 include SLC1A3, a glial high-affinity glutamate transporter expressed in astrocytes. In M16, there are several genes with known functions in neuronal cells, including GABRG2 and SYN2. To test this hypothesis, we cross-referenced genes that serve as markers for specific cell classes in the adult mouse brain30,31 with all of the modules in each network in an unbiased manner. Comparisons with gene expression data generated from purified cellular populations30 revealed that M9, M15 and M16 were significantly enriched with markers of oligodendrocytes, astrocytes and neurons, respectively, in every network (P ≤ 4.3 × 10−37, P ≤ 2.5 × 10−61 and P ≤ 5.4 × 10⁻⁵, respectively; Table 1 and Supplementary Table 7 online). Comparisons with the results of genome-wide in situ hybridization experiments from the Allen Brain Atlas31 revealed that M9, M15 and M16 were significantly enriched with markers of oligodendrocytes, astrocytes and neurons, respectively, in every network (P ≤ 1.1 × 10⁻²⁷, P ≤ 7.2 × 10⁻⁹ and P ≤ 0.041, respectively; Table 1 and Supplementary Table 7).
Table 1.
Conserved modules are enriched for markers of major cell classes
| Network | Module | Color | Oligodendrocytes1 | Oligodendrocytes2 | Astrocytes1 | Astrocytes2 | Neurons1 | Neurons2 |
|---|---|---|---|---|---|---|---|---|
| CTX | M9A | turquoise | 138/352 P = 8.1 × 10−71 |
47/60 P = 8.3 × 10−43 |
NS | NS | NS | NS |
| CTX_95 | M9B | turquoise | 63/256 P = 4.3 × 10−37 |
29/55 P = 1.1 × 10⁻²⁷ |
NS | NS | NS | NS |
| CN | M9C | turquoise | 93/352 P = 8.8 × 10−66 |
29/60 P = 2.1 × 10⁻²⁸ |
NS | NS | NS | NS |
| CB | M9D | turquoise | 58/352 P = 5.6 × 10−38 |
30/60 P = 2.2 × 10⁻³⁵ |
NS | NS | NS | NS |
| CTX | M15A | brown | NS | NS | 220/554 P = 2.0 × 10−122 |
19/32 P = 5.7 × 10⁻¹⁴ |
NS | NS |
| CTX_95 | M15B | brown | NS | 11/55 P = 3.2 × 10⁻³ |
145/430 P = 5.3 × 10−79 |
13/27 P = 7.2 × 10⁻⁹ |
NS | NS |
| CN | M15C | brown | NS | NS | 99/554 P = 2.5 × 10−61 |
14/32 P = 6.6 × 10⁻¹⁴ |
NS | NS |
| CB | M15D | brown | NS | 9/60 P = 1.0 × 10⁻⁴ |
102/554 P = 6.1 × 10−69 |
16/32 P = 1.1 × 10⁻¹⁷ |
NS | NS |
| CTX | M16A | blue | NS | NS | NS | NS | 164/709 P = 8.4 × 10⁻³⁰ |
14/50 P = 2.0 × 10⁻³ |
| CTX_95 | M16B | blue | NS | NS | NS | NS | 68/546 P = 4.0 × 10⁻¹⁵ |
7/40 P = 2.4 × 10⁻² |
| CN | M16C | blue | NS | NS | NS | NS | 64/709 P = 1.7 × 10⁻¹⁴ |
11/50 P = 4.4 × 10⁻⁶ |
| CB | M16D | blue | NS | NS | NS | NS | 50/709 P = 5.4 × 10⁻⁵ |
7/50 P = 4.1 × 10⁻² |
Enrichment analysis for markers of major cell classes in M9, M15 and M16 in all four networks. Fractions represent the number of overlapping genes relative to the maximum possible number of overlapping genes. Data were taken from refs. 30,31 (1 and 2, respectively). Significance was assessed using Fisher’s exact text (Methods). NS, not significant.
To provide additional validation for these findings, we analyzed raw data from a previous study32 (Methods) to identify genes with higher expression in differentiated rat oligodendrocytes relative to oligodendrocyte precursors. We observed that this group of genes was significantly enriched in M9 in every network (P ≤ 1.4 × 10⁻¹⁶; Supplementary Table 7). We obtained a third set of experimentally validated astrocyte markers33 and observed that this set was significantly enriched in M15 in every network (P ≤ 1.5 × 10⁻⁸; Supplementary Table 7). Using data from two independent proteomics studies, we searched all modules for over-representation of genes encoding proteins that are preferentially localized to the synapse34 (Methods). We observed significant enrichment for genes encoding synaptic proteins in M16 in every network (P ≤ 4.7 × 10⁻⁶ and P ≤ 1.6 × 10⁻³; Supplementary Table 7). Finally, we noted that established markers of oligodendrocytes (for example, PLP1, MAG, OLIG2, MOG, MOBP, CNP), astrocytes (for example, GFAP, GJA1, GLUL, GLUD1, SLC1A2, AQP4) and neurons (for example, MAP2, MAP1B, SYT1, NRXN1, SLC1A1 and NRCAM) were all correctly determined to be significant members of M9, M15 and M16, respectively, in all four networks (Supplementary Tables 3-6). These results indicate that M9, M15 and M16 consist of genes that are preferentially expressed in oligodendrocytes, astrocytes and neurons, respectively, relative to other cell types in the brain, and suggest that covariance in these modules is related to the absolute quantities of these cell types that were present in each sample.
The results obtained for M9, M15 and M16 suggested that other modules might distinguish additional cell types or functional elements of the human brain. We set out to characterize other identified modules using five complementary approaches. First, modules were cross-referenced with published data that have been associated with specific cell types or functional systems relevant to the brain30-37, as described above (Supplementary Table 7). Second, modules were searched for commonly used markers of specific cell types with strong evidence of module membership (Supplementary Tables 3-6 and Supplementary Fig. 4 online). To normalize comparisons across networks, we refer to module membership in terms of its rank (RMM = rank |module membership|). Third, we searched modules for over-represented functional categories of genes using all of the available categorical systems in the EASE software package38 (Supplementary Table 8 online). Fourth, modules were characterized on the basis of gene expression patterns in the adult mouse brain using the Allen Brain Atlas31 (Supplementary Fig. 5 online). Fifth, we correlated module eigengenes with available sample information such as cortical area, age or gender. Using these approaches, we identified modules of coexpressed genes with characteristics of PVALB-positive interneurons, Purkinje neurons, microglia and meningeal cells; other modules described mitochondrial, ribosomal and synaptic function, response to hypoxia, and gender differences (Supplementary Note online). We also identified a module consisting of genes that are specifically coexpressed in the subventricular zone (SVZ), one of two regions where neurogenesis is known to persist in the adult brain39,40 (see below). In addition, we found that module characterization revealed significant evidence for genomic clustering of coexpressed genes related to glutamatergic synaptic function in human cerebral cortex, particularly on chromosome 19 (P = 3.2 × 10⁻¹⁸ (CTX) and P = 1.2 × 10⁻¹⁴ (CTX_95); Supplementary Table 8 and Supplementary Note; graphical depictions of all modules from CTX, CN and CB are presented in Supplementary Fig. 4).
Relationships between modules are highly preserved
The overlap of the modules described above among all networks is depicted in Figure 5. As seen here, gene coexpression modules do not exist in isolation, but rather comprise a meta-network whose higher-order structure reflects relationships between modules. To explore the relationships among identified modules within each network, we calculated the Pearson correlation coefficients between all possible pairs of module eigengenes (the resulting ‘module eigengene networks’41 are presented in Supplementary Fig. 6 online). These results confirm and extend many of the module characterizations described above (Table 1 and Supplementary Note). For example, two modules with characteristics of PVALB-positive interneurons (M6A and M17A) were significantly correlated in CTX (r = 0.57, P = 5.8 × 10⁻⁷; Supplementary Fig. 6). In CN, a module of genes coexpressed in the SVZ (M13C; see below and Fig. 6) was significantly correlated with a module enriched for astrocyte markers (M15C, r = 0.60, P = 8.4 × 10⁻⁴; Supplementary Fig. 6). In both CTX and CB, modules related to synaptic function (M10 and M14) were significantly correlated (r = 0.59, P = 1.3 × 10⁻⁷ (CTX) and r = 0.58, P = 3.1 × 10⁻³ (CB); Supplementary Fig. 6), as were modules related to synaptic and mitochondrial function (M10 and M7) (r = 0.56, P = 8.9 × 10⁻⁷ (CTX) and r = 0.62, P = 1.1 × 10⁻³ (CB); Supplementary Fig. 6). In all networks, modules enriched with genes that are preferentially expressed in neurons (M16) and astrocytes (M15) were significantly anti-correlated (r = −0.58, P = 2.6 × 10⁻⁷ (CTX); r = −0.51, P = 6.0 × 10⁻⁴ (CTX_95); r = −0.71, P = 2.9 × 10⁻⁵ (CN); r = −0.52, P = 9.7 × 10⁻³ (CB); Supplementary Fig. 6).
Figure 5.
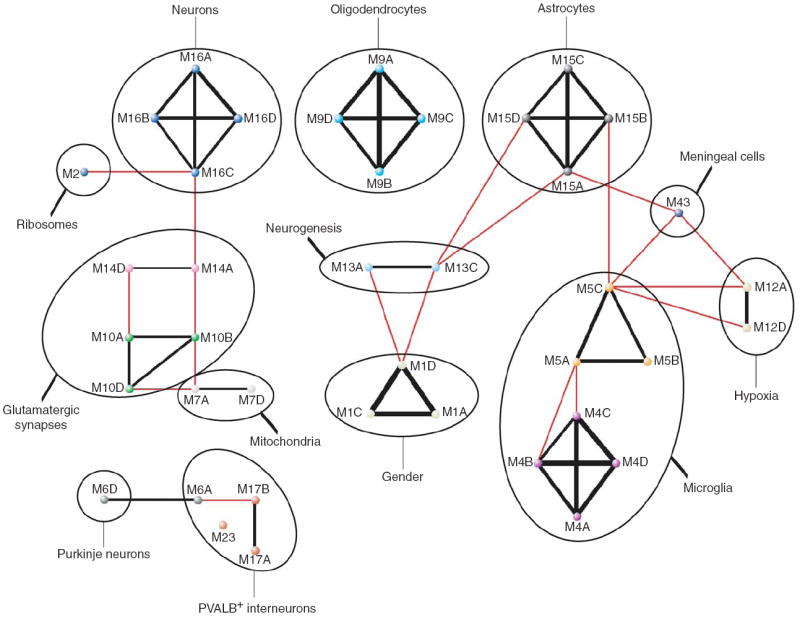
Overlap and functional characterizations reveal a meta-network of gene coexpression modules in the human brain. Summary of module characteristics and overlap. Black lines connect modules from different networks with significant overlap (corrected hypergeometric P < 0.05) that were assigned the same color and number, with the width of the line corresponding to the extent of the overlap; red lines connect modules from different networks with significant overlap that were assigned different colors and numbers (Supplementary Table 2 and Methods).
Figure 6.
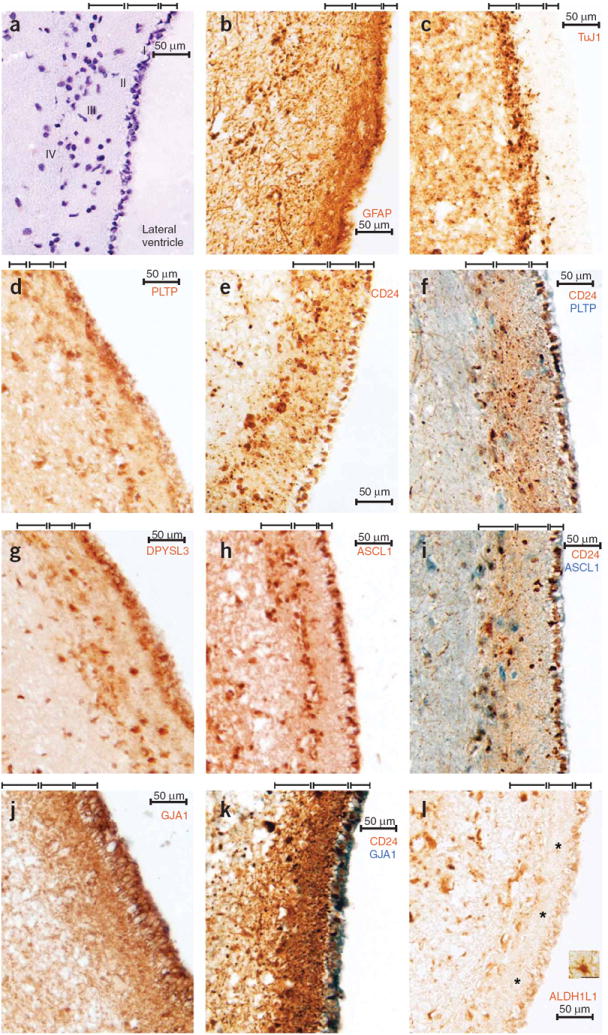
M13C identifies genes that are coexpressed in the adult subventricular neurogenic niche. We carried out immunohistochemistry for proteins encoded by genes with strong membership for M13C in 7 μM sections of adult human brain from anterior subventricular zone (SVZ). (a) Hematoxylin staining showed nuclei of cells in SVZ. The four major layers in this region are demarcated by brackets: ependymal cells (I), hypocellular gap (II), SVZ astrocyte ‘ribbon’ (III) and a transitional region (IV)46. (b) As expected45,46, GFAP expression was weak in I and strong in II and III. (c) Expression of TuJ1 (absent in the network, but considered to be a marker of immature neurons) was primarily restricted to III, consistent with previous reports45,46. (d) PLTP expression was strongest in I and III, with some staining of cell bodies in II. (e) CD24 was expressed in I–III, with prominent staining of processes in II. Expression in I was consistently targeted to the basal surface of ependymal cells. (f) Double labeling for CD24 and PLTP revealed overlapping expression patterns in I and III. (g,h) DPYSL3 (g) and ASCL1 (h) were expressed in I and III, with occasional staining of cell bodies in II and IV. (i) Double labeling for CD24 and ASCL1 revealed overlapping expression patterns in I and III. (j) GJA1 was expressed in I–III. (k) Double labeling for CD24 and GJA1 revealed overlapping expression patterns in I–III. (l) Unlike GFAP and GJA1, expression of ALDH1L1 was absent from processes in II (asterisks), despite robust staining of astrocytes in brain parenchyma (inset; image taken from same section). Single images are from one of three different individuals. Scale bars represent 50 μM.
To further explore the relationships between cortical gene coexpression modules, we directly compared module eigengene networks for conserved modules that were identified in both CTX and CTX_95 (Supplementary Fig. 7 online; comparisons between brain regions are presented in Supplementary Fig. 6). The overall preservation of the two cortical networks was quite high (mean preservation = 0.87, s.e.m. = 0.014; Supplementary Fig. 7). Hierarchical clustering of conserved modules identified three main clusters of meta-modules: one with characteristics of glia, one with properties related to the synapse/cell membrane and one with characteristics of neurons (Supplementary Fig. 7). These results indicate that the higher-order organization of gene coexpression networks in the human brain is reproducible and reflects functional inter-relationships between modules.
Annotation of gene function by module membership
The consistency of gene coexpression network architecture motivated us to rank genes according to their average module membership across brain regions (Supplementary Table 9 online). Genes with the highest average module membership best conformed to the characteristic expression pattern of their respective module in multiple human brain regions. This analysis can therefore be used to identify genes with a strong likelihood of participation in the specific functions represented by each module. For example, the ten genes with the highest average membership for M9, which was highly enriched with markers of oligodendrocytes (Table 1), were PLLP, MAL, HSPA2, TF, GPR37, CNP, ENPP2, FA2H, C11orf9 and ENPP2 (Supplementary Table 9). These data predict that C11orf9, which encodes a protein of unknown function, is important for oligodendroglial function in the human brain. The ten genes with the highest average membership for M15, which was highly enriched with markers of astrocytes (Table 1), were AHCYL1, AHCYL1, NTRK2, SOX9, PDLIM5, PPAP2B, PLSCR4, TP53BP2, METTL7A and NTRK2 (Supplementary Table 9). Notably, these genes showed higher average membership than many genes that are considered to be canonical markers of astrocytes, including SLC1A3 (15th), GJA1 (17th), GLUL (56th), and GFAP (82nd). The ten genes with the highest average membership for M16, which was enriched with markers of neurons and synaptic proteins (Table 1 and Supplementary Table 7), were PREPL, SYNJ1, TPD52, G3BP2, YWHAZ, PAFAH1B1, GABRG2, SCAMP1, ANK2 and GLRB (Supplementary Table 9). For some of these genes (for example, PREPL and TPD52), no specific association with neuronal function has previously been reported, to the best of our knowledge.
It was also of interest to identify genes with module membership that differed substantially between brain regions, as such genes may shed light on regional differences involving particular cell types or functional processes in the human brain (genes with the most significant differences in module membership between CTX, CN and CB for M9, M15 and M16 are reported in Supplementary Table 10 online and complete results for all genes and all conserved modules are presented in Supplementary Table 11 online; Methods).
Coexpression in the adult subventricular neurogenic niche
In CN, we observed that M13C was significantly enriched with markers of astrocytes from previous studies (P = 1.9 × 10⁻²⁴, P = 6.6 × 10⁻⁸ and P = 1.0 × 10⁻⁷ from refs. 30,31,33, respectively; Supplementary Table 7). These observations were interesting to us, as another, much larger, module with characteristics of astrocytes (M15) had already been identified in every network, including CN (Figs. 2 and 5, Table 1, and Supplementary Table 2). Although M13C was highly enriched with markers of astrocytes, several genes that are typically expressed in neuroblasts or immature neurons also showed strong membership for this module, including CD24 (ref. 42) and DPYSL3 (ref. 43) (Supplementary Table 5). Also identified in this module was the transcription factor ASCL1 (Supplementary Table 5), which is involved in committing multipotent progenitors to a neuronal fate44. These observations suggested that M13C has characteristics that are mixed between astrocytes and immature neurons. Such characteristics are thought to exist amongst a heterogeneous population of cells with neurogenic properties in the adult SVZ39,40. Because samples from CN were taken from the head of the caudate nucleus, which includes part of the SVZ, we hypothesized that gene coexpression in this module might relate to adult SVZ neurogenesis and sought experimental validation for this hypothesis on the basis of expression patterns in the brain.
We first examined expression patterns in the adult mouse brain for ten genes with the strongest membership for M13C, observing elevated and often exclusive expression in or near the SVZ for all of them (Supplementary Fig. 5). To provide additional confirmation for these findings, we carried out immunostaining in adult human SVZ for proteins encoded by genes with strong membership for this module (Fig. 6 and Supplementary Table 5). All of these genes were preferentially expressed in the SVZ (Fig. 6b,d–k), providing experimental validation that M13C distinguishes genes that are coexpressed in the adult subventricular neurogenic niche. Although the cellular composition and cytoarchitecture of the adult human SVZ have been extensively characterized45,46, the transcriptional programs that endow this region with its neurogenic properties are poorly understood39,40. In this system, the precise location of neural stem cells is still unknown, but it has been shown that SVZ astrocytes divide in vivo and are capable of generating neurons in the absence of exogenous growth factors in vitro45. Although it is unclear whether gene coexpression in M13C primarily reflects transcription in a single cell type or in multiple cell types, the strong membership of so many astrocytic genes (Supplementary Tables 5 and 7) suggests that SVZ astrocytes contribute substantially to the observed coexpression patterns in this module. These observations are consistent with the interpretation that gene coexpression in M13C may relate to the maintenance of adult neural progenitors and the process of neurogenesis.
Because astrocytes derived from adult human brain parenchyma lack neurogenic potential39,40,45, we wanted to identify genes with expression patterns that might distinguish these cells from SVZ astrocytes, as there are no known genes that provide such a distinction in the human brain. We reasoned that comparisons on the basis of module membership can be used to identify genes with expression patterns that distinguish subpopulations of cells in brain regions, and therefore compared membership for M13C with membership for M15, which was highly conserved across brain regions and enriched with markers of astrocytes in every network (Figs. 2 and 5, Table 1 and Supplementary Table 2). This comparison identified genes with strong membership for either M13C or M15, but not both (Supplementary Table 12 online; Methods). The genes with the strongest membership for M13C (SVZ) relative to M15 (astrocyte) included CD24, IQCG, STK38L, CETN2, FLJ22167 and NEK1 (Supplementary Table 12). Consistent with these results, CD24 expression was not observed in parenchymal astrocytes in human caudate nucleus (data not shown).
Using the same approach, 20 genes with strong membership for M15 across brain regions and weak membership for M13C were identified (Supplementary Table 12). One such gene was ALDH1L1, which was recently identified as a highly specific marker for astrocytes30. Consistent with this report, we observed that ALDH1L1 possessed strong membership for M15 in CTX (RMM = 117, P = 5.7 × 10⁻¹⁴; Supplementary Table 3), CB (RMM = 72, P = 1.1 × 10⁻⁶; Supplementary Table 6) and CN (RMM = 17, P = 4.3 × 10⁻⁹; Supplementary Table 5). However, membership of ALDH1L1 for M13C was not significant (RMM = 3,104, P = 0.12; Supplementary Table 5), suggesting that this gene is not expressed by astrocytes in the SVZ. To test this hypothesis, we carried out immunostaining for ALDH1L1 in adult human brain. Notably, expression of ALDH1L1 was absent from layer II processes in the SVZ (Fig. 6l), despite robust staining of astrocytic processes in parenchyma (Fig. 6l).
These results provide, to the best of our knowledge, the first experimental evidence of differences in gene expression between mature astrocytes and SVZ astrocytes in the adult human brain. Furthermore, our findings indicate that differences in module membership for M13C and M15 can be used to identify gene expression patterns that distinguish these subpopulations of cells, providing an important new set of molecular tools with which to investigate the adult neurogenic niche.
DISCUSSION
We have carried out, to the best of our knowledge, the first comprehensive analysis of gene coexpression relationships in human cerebral cortex, caudate nucleus and cerebellum. Our results demonstrate that the transcriptomes of human brain regions are robustly organized into modules of coexpressed genes that reflect the underlying cellular composition of brain tissue. Notably, these modules were identified without making any a priori assumptions regarding the cellular constitution of the tissues analyzed in this study. The elucidation of gene coexpression network organization in the human brain provides a new foundation for neurogenetic inquiries along two primary avenues. First, the identification and characterization of gene coexpression modules constitutes a valuable new resource for context-specific annotation of gene function in the human brain through the oft-invoked principle of guilt by association. Second, the quantitative assessment of module membership provides a new basis for exploring molecular differences that distinguish specific cell types and functional processes in disease and health.
It should be noted that the organization of the human brain transcriptome described here could not have been revealed by standard methods, such as analysis of differential expression. This analytical approach seeks to identify genes that are expressed, on average, significantly higher or lower in one group versus another, with greater significance being attributed to genes for which the ratio of inter-group to intra-group expression variance is maximized. In our study, each dataset was comprised of a single group consisting of control samples from a specific brain region. In each group, the relative representation of specific cell types or functional processes in each sample was unknown. Therefore, there was no basis for identifying genes that were differentially expressed in these data sets, as there were no groups to compare. Furthermore, because the end result of differential expression analysis is a list of genes, each of which has been deemed significant in isolation, a systems-level understanding of such findings relies exclusively on post hoc analyses to connect individual genes in a broader functional framework. In contrast, analysis of gene coexpression relationships reveals the inherent organization of the transcriptome as the appropriate biological framework in which to consider additional post hoc analyses.
Comparison of CTX and CTX_95 revealed that a majority of gene coexpression modules were present in both cortical networks. A majority of gene coexpression modules identified in CTX were also present in CTX_ILMN. The notable similarity among these networks, constructed from different cortical areas, individuals and microarray platforms, suggests a fundamental organization to the transcriptome of human cerebral cortex that has not previously been recognized. Modules enriched with markers of major cell classes were identified in cerebral cortex, caudate nucleus and cerebellum. The consistent identification of these modules across brain regions suggests that they constitute molecular correlates to the cellular building blocks of the nervous system. Other modules identified in this analysis distinguished additional cell types, including PVALB-positive interneurons, Purkinje neurons and meningeal cells, whereas still others related to mitochondrial, ribosomal and synaptic function, response to hypoxia, gender differences, and the subventricular neurogenic niche. For some modules, the importance of gene coexpression relationships will require further investigation. For example, our results suggest that coexpression in M13A may relate to the migration and assimilation of immature interneurons in adult cerebral cortex. It is interesting to note that the two samples with the highest expression levels for genes in this module were taken from Brodmann area 11. This area includes the gyrus rectus, which forms the medial boundary of the olfactory sulcus and abuts the putative rostral migratory stream that has recently been described in humans47.
Several modules were identified in some, but not all, brain regions. For example, M10 and M14, which showed properties related to glutamatergic synaptic function (Supplementary Note), were identified in CTX and CB, but not in CN. This finding is consistent with the predominant neuronal phenotype in each of these brain regions. Pyramidal neurons and granule neurons, which are the most abundant neurons in cerebral cortex and cerebellum, respectively, both release glutamate as their primary neurotransmitter. In contrast, the most abundant neuron in the caudate nucleus is the medium spiny neuron, which releases GABA as its primary neurotransmitter. Other modules with substantial overlap between brain regions suggest shared functional characteristics. For example, the overlap between M6A (CTX) and M6D (CB) implies that PVALB-positive cortical interneurons and Purkinje neurons may share similar elements of transcriptional programs related to inhibitory neurotransmission. It is also interesting to consider the absence of certain modules in specific brain regions. For example, it is not immediately clear why a module related to mitochondrial function (M7) was identified in CTX and CB, but not in CN, or why a module related to ribosomal function (M2) was identified in CTX, but nowhere else. It is possible that these discrepancies may reflect variation in the susceptibility of different brain regions to hypoxia or agonal stress48.
The identification and characterization of gene coexpression modules represents a new approach for annotating gene function in the human brain and generating hypotheses related to human disease through the principle of guilt by association. Guilt by association implies that the expression levels of genes with the strongest evidence of membership for the same module are probably driven by the same underlying factors. Seen in this context, our described module memberships (Supplementary Tables 3-6) are rich sources of new hypotheses for thousands of genes expressed in the human brain (Supplementary Note). The consistency of gene coexpression network architecture may also be leveraged to identify new candidate disease genes through differential network analysis15. By establishing a baseline network for comparison with disease, differences in the strength of module membership can be assessed for all genes relative to all identified modules. In principle, such an approach offers several advantages over the conventional methods used to study neurological or neuropsychiatric disorders. First, differential network analysis can suggest dysregulation at the level of modules, which may implicate specific cell types or functional pathways. Although pre-existing classification systems such as gene ontology49 are essential tools for microarray studies, these systems currently do not provide adequate context in regards to tissue and cellular specificity of gene expression patterns. In comparison, modules of coexpressed genes that have been identified in an unsupervised fashion in a biological system of interest possess immediate functional relevance. Second, in contrast to studies of differential expression, differential network analysis effectively normalizes gene expression levels relative to their primary source(s) of variance. This practice can help control for sample differences resulting from biological factors (for example, differences in the absolute quantities of specific cell types) and technical factors (for example, differences between dissections or sample quality) that can influence the results of differential expression studies. Third, in comparison with genomic studies, analysis of the transcriptome in affected brain regions is more proximal to function than analysis of DNA sequence.
Comparisons on the basis of module membership can also be used to characterize molecular differences among cell types both between and within neuropathologically normal brain regions. Using this approach, we identified genes with expression patterns that distinguish mature astrocytes in brain parenchyma from germinal astrocytes in the SVZ. The identification of such genes may shed light on the qualities that permit the latter population to maintain their germinal capacity into adulthood.
In microarray studies of whole brain tissue, the measured expression level for any given gene depends on the extent to which it is expressed in different cell types and the representation of those cell types in the tissue sample. Therefore, it is commonly assumed in such studies that cellular heterogeneity precludes the recovery of cell type–specific information. Our analysis points to the opposite conclusion: cellular heterogeneity contributes in measurable and predictable ways to expression levels quantified by microarrays using messenger RNA extracted from whole brain tissue. To the best of our knowledge, this work is the first to provide evidence in support of this claim. However, this claim follows logically from two uncontroversial premises: cell types are distinguished by the genes that they express and the absolute quantity of each cell type will vary from sample to sample. Therefore, the genes that are most specifically and consistently expressed in the same cell type should appear highly correlated in microarray data derived from complex tissue homogenates. For a module consisting of such genes, the module eigengene can be interpreted as a proxy for the relative number of relevant cells present in each sample. Furthermore, a gene’s membership for such a module can be seen as a measure of expression fidelity for that particular cell type relative to other cell types that are present in the sample. In this context, it is interesting to consider the potential sources of variation that may influence the quantities of specific cell types in different samples of brain tissue (Supplementary Note).
Although cellular heterogeneity is a major organizing principle in the gene coexpression networks described in this study, we do not expect that every identified module will map unambiguously to a specific cell type in the brain for many reasons. For example, the definition of a cell type using currently available methods is inherently subjective1 and some modules are likely to constitute tightly integrated functional systems that span multiple cell types. Other modules capture variation in gene expression that is unrelated to cellular composition (for example, M1). Additionally, neuronal diversity in the brain produces a hierarchy of overlapping gene expression patterns, as evidenced by the large number of modules related to neuronal function identified in every network. Although some of these modules may reflect neuronal diversity (for example, M6), others probably represent transcriptional programs that are present in all neurons (for example, M16) or multiple neuronal subtypes (for example, M10 and M14).
Because gene coexpression patterns may reflect multiple sources of variation, comparisons between networks provide an important validation. Although a majority of gene coexpression modules identified in cerebral cortex were present in both CTX and CTX_95, and many of these modules were also present in CTX_ILMN, it is important to consider the potential explanations for observed discrepancies among the cortical networks. Some discrepancies probably resulted from differences in platform and probe set design, as well as the representation of genes on the microarrays, whereas others may have resulted from biological differences between individuals and cortical areas. Although we found few modules of coexpressed genes driven by specific cortical areas (for example, M17B and M23), we cannot exclude the possibility that the batch normalization method applied here may have obscured area-specific gene expression patterns. However, our results are consistent with previous microarray studies that have identified few differences in gene expression between association areas in adult human cortex2,3. Future studies of gene coexpression relationships in discrete cortical areas may shed light on this issue.
In summary, we have carried out, to the best of our knowledge, the first comprehensive analysis of gene coexpression relationships in human cerebral cortex, caudate nucleus and cerebellum. The strategy employed here constitutes a general approach for analyzing gene expression data that will be applicable to a variety of biological systems. Our findings offer a new perspective on the functional organization of the human brain transcriptome.
METHODS
Microarray data
Microarray data from human cerebral cortex, caudate nucleus and cerebellum were gathered from nine published studies2,4-7,19-22. Raw data from these studies are available in GEO (GSE1572 (ref. 22), GSE3790 (ref. 6), GSE5392 (ref. 7), GSE7540 (ref. 19), GSE12649 (ref. 4) and GSE12654 (ref. 5) at http://www.ncbi.nlm.nih.gov/geo/) or ArrayExpress (E-AFMX-1 (ref. 21) and E-AFMX-2 (ref. 2) at http://www.ebi.ac.uk/microarray-as/ae/). Raw data from a previous study20 are available at http://email.eva.mpg.de/~khaitovi/supl1/affymetrix.html. All of the samples included in this analysis were collected post mortem from control subjects with no known history of neuropathology. CTX, CN and CB samples were analyzed using Affymetrix HG-U133A microarrays (22,215 probe sets), whereas CTX_95 samples were analyzed using Affymetrix HG-U95A/v2 microarrays (12,533 shared probe sets) (for details on microarray data processing, see Supplementary Methods).
Weighted gene coexpression network construction and module detection
For each data set, Pearson correlation coefficients were calculated for all pairwise comparisons of expressed genes (Supplementary Methods) across all samples. The resulting Pearson correlation matrix was transformed into a matrix of connection strengths (that is, an adjacency matrix) using a power function (connection strength = |correlation|β), which resulted in a weighted network18. WGCNA seeks to identify modules of densely interconnected genes by searching for genes with similar patterns of connection strengths, or high topological overlap18. As a result of the large number of genes analyzed, we carried out an additional step to enrich each network with genes with high topological overlap, which reduced the number of probe sets in each network to 5,549 (CTX), 3,203 (CTX_95), 4,050 (CN) and 4,029 (CB) (Supplementary Methods). For each data set, we used average linkage hierarchical clustering to group genes on the basis of the topological overlap dissimilarity measure (1 − topological overlap) of their network connection strengths18. Using a dynamic tree-cutting algorithm50, we identified 19 modules in CTX, 17 in CTX_95, 23 in CN and 22 in CB (Supplementary Methods). Genes that were not assigned to modules were assigned the color gray.
Module comparisons between networks
For each pair of networks, the overlap between all possible pairs of modules was calculated along with the probability of observing such overlap by chance. For comparisons among CTX, CN and CB, probe set identities were used as unique identifiers; for comparisons with CTX_95, gene symbols were used. The significance of module overlap was assessed for each module in a given network with all modules in the comparison network using a one-sided hypergeometric test (as we were interested in testing for over-representation; see Supplementary Methods for an example). To account for multiple comparisons, a Bonferroni correction was applied on the basis of the number of modules in the comparison network. Modules from different networks with significant overlap (corrected hypergeometric P value < 0.05) were assigned the same color and number, with networks denoted by letters (for example, M9A for CTX, M9B for CTX_95, M9C for CN and M9D for CB). If a module showed significant overlap with more than one module from another network, color/number assignment was determined by the lowest P value.
Defining a measure of module membership (kME)
We derived a measure of module membership by first summarizing the expression levels of all genes in each module by the corresponding module eigengene (that is, the first principal component obtained by singular value decomposition; Supplementary Fig. 2). We defined the module membership for each gene with respect to each module as the Pearson correlation between the expression level of the gene and the module eigengene29. This quantity, which we refer to here as kME, is a natural summary of the extent to which a gene conforms to the characteristic expression pattern of a module. We note that other summary measures are possible (Supplementary Methods). Values of kME range from −1 (perfect anti-correlation) to 1 (perfect correlation). For genes represented by multiple probe sets, the highest rank |kME| (that is, RMM) is reported in the text. We reported the rank of the absolute value of kME, as expression levels of many genes are often significantly anti-correlated. For CTX, CN and CB, |kME| ranks ranged from 1 to 18,631; for CTX_95, |kME| ranks ranged from 1 to 10,553.
Further details on the topological overlap of interacting protein pairs, module characterization, module eigengene network comparisons, comparisons of module membership between brain regions, immunohistochemistry and the identification of candidate genes with expression patterns that distinguish SVZ astrocytes from mature astrocytes are described in Supplementary Methods. For details on analysis of CTX_ILMN, see the Supplementary Network Analysis.
Supplementary Material
Acknowledgments
The authors would like to express their gratitude to the individuals who produced and made available to the scientific community the raw data analyzed in this study. Post mortem brain tissue was donated by The Stanley Research Institute’s brain collection courtesy of M.B. Knable, E.F. Torrey, M.J. Webster, S. Weis and R.H. Yolken. We are grateful to our colleagues N. Khanlou, J. Pomakian and H. Vinters for their help in obtaining additional post mortem human brain tissue. We also thank C. Wiita for technical support and L. Kawaguchi for administrative support and lab management. This work was supported by the James S. McDonnell Foundation and a Method to Extend Research in Time (MERIT) Award 5R37MH060233 (D.H.G.), funded by the US National Institute of Mental Health.
Footnotes
AUTHOR CONTRIBUTIONS M.C.O. designed the study, analyzed the data and wrote the manuscript. S.H. guided data analysis and aided in manuscript preparation. G.K. designed and carried out wet bench experiments. P.L. performed module eigengene network comparisons. K.I. and T.K. provided microarray data. D.H.G. supervised the study, provided funding and aided in manuscript preparation. All authors discussed results and commented on the manuscript.
Note: Supplementary information is available on the Nature Neuroscience website.
References
- 1.Nelson SB, Hempel C, Sugino K. Probing the transcriptome of neuronal cell types. Curr Opin Neurobiol. 2006;16:571–576. doi: 10.1016/j.conb.2006.08.006. [DOI] [PubMed] [Google Scholar]
- 2.Khaitovich P, et al. Regional patterns of gene expression in human and chimpanzee brains. Genome Res. 2004;14:1462–1473. doi: 10.1101/gr.2538704. [DOI] [PMC free article] [PubMed] [Google Scholar]
- 3.Roth RB, et al. Gene expression analyses reveal molecular relationships among 20 regions of the human CNS. Neurogenetics. 2006;7:67–80. doi: 10.1007/s10048-006-0032-6. [DOI] [PubMed] [Google Scholar]
- 4.Iwamoto K, Bundo M, Kato T. Altered expression of mitochondria-related genes in postmortem brains of patients with bipolar disorder or schizophrenia, as revealed by large-scale DNA microarray analysis. Hum Mol Genet. 2005;14:241–253. doi: 10.1093/hmg/ddi022. [DOI] [PubMed] [Google Scholar]
- 5.Iwamoto K, Kakiuchi C, Bundo M, Ikeda K, Kato T. Molecular characterization of bipolar disorder by comparing gene expression profiles of postmortem brains of major mental disorders. Mol Psychiatry. 2004;9:406–416. doi: 10.1038/sj.mp.4001437. [DOI] [PubMed] [Google Scholar]
- 6.Hodges A, et al. Regional and cellular gene expression changes in human Huntington’s disease brain. Hum Mol Genet. 2006;15:965–977. doi: 10.1093/hmg/ddl013. [DOI] [PubMed] [Google Scholar]
- 7.Ryan MM, et al. Gene expression analysis of bipolar disorder reveals downregulation of the ubiquitin cycle and alterations in synaptic genes. Mol Psychiatry. 2006;11:965–978. doi: 10.1038/sj.mp.4001875. [DOI] [PubMed] [Google Scholar]
- 8.Barabasi AL, Oltvai ZN. Network biology: understanding the cell’s functional organization. Nat Rev Genet. 2004;5:101–113. doi: 10.1038/nrg1272. [DOI] [PubMed] [Google Scholar]
- 9.Chen Y, et al. Variations in DNA elucidate molecular networks that cause disease. Nature. 2008;452:429–435. doi: 10.1038/nature06757. [DOI] [PMC free article] [PubMed] [Google Scholar]
- 10.Horvath S, et al. Analysis of oncogenic signaling networks in glioblastoma identifies ASPM as a molecular target. Proc Natl Acad Sci USA. 2006;103:17402–17407. doi: 10.1073/pnas.0608396103. [DOI] [PMC free article] [PubMed] [Google Scholar]
- 11.Huang Y, et al. Systematic discovery of functional modules and context-specific functional annotation of human genome. Bioinformatics. 2007;23:i222–i229. doi: 10.1093/bioinformatics/btm222. [DOI] [PubMed] [Google Scholar]
- 12.Ihmels J, Bergmann S, Barkai N. Defining transcription modules using large-scale gene expression data. Bioinformatics. 2004;20:1993–2003. doi: 10.1093/bioinformatics/bth166. [DOI] [PubMed] [Google Scholar]
- 13.Jordan IK, Marino-Ramirez L, Wolf YI, Koonin EV. Conservation and coevolution in the scale-free human gene coexpression network. Mol Biol Evol. 2004;21:2058–2070. doi: 10.1093/molbev/msh222. [DOI] [PubMed] [Google Scholar]
- 14.Lee HK, Hsu AK, Sajdak J, Qin J, Pavlidis P. Coexpression analysis of human genes across many microarray data sets. Genome Res. 2004;14:1085–1094. doi: 10.1101/gr.1910904. [DOI] [PMC free article] [PubMed] [Google Scholar]
- 15.Oldham MC, Horvath S, Geschwind DH. Conservation and evolution of gene coexpression networks in human and chimpanzee brains. Proc Natl Acad Sci USA. 2006;103:17973–17978. doi: 10.1073/pnas.0605938103. [DOI] [PMC free article] [PubMed] [Google Scholar]
- 16.Stuart JM, Segal E, Koller D, Kim SK. A gene-coexpression network for global discovery of conserved genetic modules. Science. 2003;302:249–255. doi: 10.1126/science.1087447. [DOI] [PubMed] [Google Scholar]
- 17.Snel B, van Noort V, Huynen MA. Gene co-regulation is highly conserved in the evolution of eukaryotes and prokaryotes. Nucleic Acids Res. 2004;32:4725–4731. doi: 10.1093/nar/gkh815. [DOI] [PMC free article] [PubMed] [Google Scholar]
- 18.Zhang B, Horvath S. A general framework for weighted gene co-expression network analysis. Stat Appl Genet Mol Biol. 2005;4:17. doi: 10.2202/1544-6115.1128. [DOI] [PubMed] [Google Scholar]
- 19.Caceres M, et al. Elevated gene expression levels distinguish human from non-human primate brains. Proc Natl Acad Sci USA. 2003;100:13030–13035. doi: 10.1073/pnas.2135499100. [DOI] [PMC free article] [PubMed] [Google Scholar]
- 20.Enard W, et al. Intra- and interspecific variation in primate gene expression patterns. Science. 2002;296:340–343. doi: 10.1126/science.1068996. [DOI] [PubMed] [Google Scholar]
- 21.Khaitovich P, et al. A neutral model of transcriptome evolution. PLoS Biol. 2004;2:e132. doi: 10.1371/journal.pbio.0020132. [DOI] [PMC free article] [PubMed] [Google Scholar]
- 22.Lu T, et al. Gene regulation and DNA damage in the ageing human brain. Nature. 2004;429:883–891. doi: 10.1038/nature02661. [DOI] [PubMed] [Google Scholar]
- 23.Zhang J, Finney RP, Clifford RJ, Derr LK, Buetow KH. Detecting false expression signals in high-density oligonucleotide arrays by an in silico approach. Genomics. 2005;85:297–308. doi: 10.1016/j.ygeno.2004.11.004. [DOI] [PubMed] [Google Scholar]
- 24.Johnson WE, Li C, Rabinovic A. Adjusting batch effects in microarray expression data using empirical Bayes methods. Biostatistics. 2007;8:118–127. doi: 10.1093/biostatistics/kxj037. [DOI] [PubMed] [Google Scholar]
- 25.Ravasz E, Somera AL, Mongru DA, Oltvai ZN, Barabasi AL. Hierarchical organization of modularity in metabolic networks. Science. 2002;297:1551–1555. doi: 10.1126/science.1073374. [DOI] [PubMed] [Google Scholar]
- 26.Kerrien S, et al. IntAct—open source resource for molecular interaction data. Nucleic Acids Res. 2007;35:D561–D565. doi: 10.1093/nar/gkl958. [DOI] [PMC free article] [PubMed] [Google Scholar]
- 27.Ge H, Liu Z, Church GM, Vidal M. Correlation between transcriptome and interactome mapping data from Saccharomyces cerevisiae. Nat Genet. 2001;29:482–486. doi: 10.1038/ng776. [DOI] [PubMed] [Google Scholar]
- 28.Myers AJ, et al. A survey of genetic human cortical gene expression. Nat Genet. 2007;39:1494–1499. doi: 10.1038/ng.2007.16. [DOI] [PubMed] [Google Scholar]
- 29.Horvath S, Dong J. Geometric interpretation of gene coexpression network analysis. PLoS Comput Biol. 2008;4:e1000117. doi: 10.1371/journal.pcbi.1000117. [DOI] [PMC free article] [PubMed] [Google Scholar]
- 30.Cahoy JD, et al. A transcriptome database for astrocytes, neurons, and oligodendrocytes: a new resource for understanding brain development and function. J Neurosci. 2008;28:264–278. doi: 10.1523/JNEUROSCI.4178-07.2008. [DOI] [PMC free article] [PubMed] [Google Scholar]
- 31.Lein ES, et al. Genome-wide atlas of gene expression in the adult mouse brain. Nature. 2007;445:168–176. doi: 10.1038/nature05453. [DOI] [PubMed] [Google Scholar]
- 32.Nielsen JA, Maric D, Lau P, Barker JL, Hudson LD. Identification of a novel oligodendrocyte cell adhesion protein using gene expression profiling. J Neurosci. 2006;26:9881–9891. doi: 10.1523/JNEUROSCI.2246-06.2006. [DOI] [PMC free article] [PubMed] [Google Scholar]
- 33.Bachoo RM, et al. Molecular diversity of astrocytes with implications for neurological disorders. Proc Natl Acad Sci USA. 2004;101:8384–8389. doi: 10.1073/pnas.0402140101. [DOI] [PMC free article] [PubMed] [Google Scholar]
- 34.Morciano M, et al. Immunoisolation of two synaptic vesicle pools from synaptosomes: a proteomics analysis. J Neurochem. 2005;95:1732–1745. doi: 10.1111/j.1471-4159.2005.03506.x. [DOI] [PubMed] [Google Scholar]
- 35.Rong Y, Wang T, Morgan JI. Identification of candidate Purkinje cell–specific markers by gene expression profiling in wild-type and pcd(3J) mice. Brain Res Mol Brain Res. 2004;132:128–145. doi: 10.1016/j.molbrainres.2004.10.015. [DOI] [PubMed] [Google Scholar]
- 36.Sugino K, et al. Molecular taxonomy of major neuronal classes in the adult mouse forebrain. Nat Neurosci. 2006;9:99–107. doi: 10.1038/nn1618. [DOI] [PubMed] [Google Scholar]
- 37.Nagata T, et al. Profiling of genes associated with transcriptional responses in mouse hippocampus after transient forebrain ischemia using high-density oligonucleotide DNA array. Brain Res Mol Brain Res. 2004;121:1–11. doi: 10.1016/j.molbrainres.2003.10.023. [DOI] [PubMed] [Google Scholar]
- 38.Hosack DA, Dennis G, Jr, Sherman BT, Lane HC, Lempicki RA. Identifying biological themes within lists of genes with EASE. Genome Biol. 2003;4:R70. doi: 10.1186/gb-2003-4-10-r70. [DOI] [PMC free article] [PubMed] [Google Scholar]
- 39.Ihrie RA, Alvarez-Buylla A. Cells in the astroglial lineage are neural stem cells. Cell Tissue Res. 2008;331:179–191. doi: 10.1007/s00441-007-0461-z. [DOI] [PubMed] [Google Scholar]
- 40.Merkle FT, Alvarez-Buylla A. Neural stem cells in mammalian development. Curr Opin Cell Biol. 2006;18:704–709. doi: 10.1016/j.ceb.2006.09.008. [DOI] [PubMed] [Google Scholar]
- 41.Langfelder P, Horvath S. Eigengene networks for studying the relationships between coexpression modules. BMC Syst Biol. 2007;1:54. doi: 10.1186/1752-0509-1-54. [DOI] [PMC free article] [PubMed] [Google Scholar]
- 42.Calaora V, Chazal G, Nielsen PJ, Rougon G, Moreau H. mCD24 expression in the developing mouse brain and in zones of secondary neurogenesis in the adult. Neuroscience. 1996;73:581–594. doi: 10.1016/0306-4522(96)00042-5. [DOI] [PubMed] [Google Scholar]
- 43.Quinn CC, Gray GE, Hockfield S. A family of proteins implicated in axon guidance and outgrowth. J Neurobiol. 1999;41:158–164. [PubMed] [Google Scholar]
- 44.Nieto M, Schuurmans C, Britz O, Guillemot F. Neural bHLH genes control the neuronal versus glial fate decision in cortical progenitors. Neuron. 2001;29:401–413. doi: 10.1016/s0896-6273(01)00214-8. [DOI] [PubMed] [Google Scholar]
- 45.Sanai N, et al. Unique astrocyte ribbon in adult human brain contains neural stem cells but lacks chain migration. Nature. 2004;427:740–744. doi: 10.1038/nature02301. [DOI] [PubMed] [Google Scholar]
- 46.Quinones-Hinojosa A, et al. Cellular composition and cytoarchitecture of the adult human subventricular zone: a niche of neural stem cells. J Comp Neurol. 2006;494:415–434. doi: 10.1002/cne.20798. [DOI] [PubMed] [Google Scholar]
- 47.Curtis MA, et al. Human neuroblasts migrate to the olfactory bulb via a lateral ventricular extension. Science. 2007;315:1243–1249. doi: 10.1126/science.1136281. [DOI] [PubMed] [Google Scholar]
- 48.Li JZ, et al. Sample matching by inferred agonal stress in gene expression analyses of the brain. BMC Genomics. 2007;8:336. doi: 10.1186/1471-2164-8-336. [DOI] [PMC free article] [PubMed] [Google Scholar]
- 49.Ashburner M, et al. Gene ontology: tool for the unification of biology. The Gene Ontology Consortium. Nat Genet. 2000;25:25–29. doi: 10.1038/75556. [DOI] [PMC free article] [PubMed] [Google Scholar]
- 50.Langfelder P, Zhang B, Horvath S. Defining clusters from a hierarchical cluster tree: the Dynamic Tree Cut package for R. Bioinformatics. 2007;24:719–720. doi: 10.1093/bioinformatics/btm563. [DOI] [PubMed] [Google Scholar]
Associated Data
This section collects any data citations, data availability statements, or supplementary materials included in this article.