

Abstract
The concentration of extracellular calcium plays a critical role in synaptic transmission and neuronal excitability as well as other physiological processes. The time course and extent of local fluctuations in the concentration of this ion largely depend on its effective diffusion coefficient (D*) and it has been speculated that fixed negative charges on chondroitin sulphate proteoglycans (CSPGs) and other components of the extracellular matrix may influence calcium diffusion because it is a divalent cation. In this study we used ion-selective microelectrodes combined with pressure ejection or iontophoresis of ions from a micropipette to quantify diffusion characteristics of neocortex and hippocampus in rat brain slices. We show that D* for calcium is less than the value predicted from the behaviour of the monovalent cation tetramethylammonium (TMA), a commonly used diffusion probe, but D* for calcium increases in both brain regions after the slices are treated with chondroitinase ABC, an enzyme that predominantly cleaves chondroitin sulphate glycans. These results suggest that CSPGs do play a role in determining the local diffusion properties of calcium in brain tissue, most likely through electrostatic interactions mediating rapid equilibrium binding. In contrast, chondroitinase ABC does not affect either the TMA diffusion or the extracellular volume fraction, indicating that the enzyme does not alter the structure of the extracellular space and that the diffusion of small monovalent cations is not affected by CSPGs in the normal brain ionic milieu. Both calcium and CSPGs are known to have many distinct roles in brain physiology, including brain repair, and our study suggests they may be functionally coupled through calcium diffusion properties.
Extracellular Ca2+ concentration, [Ca2+]o, plays an essential role in such ubiquitous processes as determining the threshold of voltage-activated channels and vesicular release. Inevitably, local [Ca2+]o fluctuates and these variations propagate and dissipate by diffusion. Because Ca2+ is a divalent cation, it is plausible that the strongly anionic extracellular matrix (ECM) plays an important role in calcium diffusion. In this paper we show that the diffusion of Ca2+ in the extracellular space (ECS) of the neocortex and hippocampus of the rat is more hindered than that of the monovalent ion tetramethylammonium (TMA+). We then demonstrate that application of chondroitinase ABC (chABC) to remove chondroitin sulphate (CS) components of the ECM reduces this hindrance for Ca2+ whereas TMA+ is unaffected.
The resting level of [Ca2+]o in the vertebrate CNS, measured directly with ion-selective microelectrodes (ISMs), is about 1.2 mm (2.4 mequiv l−1) (Nicholson, 1980; Pumain, 1988), which is comparable to the levels of 1–1.5 mm measured in cerebrospinal fluid of a variety of mammals, including humans (Katzman & Pappius, 1973, chap. 5) so that significant local changes in concentration of this ion may readily be brought about by movement or sequestration. Reduced [Ca2+]o decreases charge screening at membranes and increases membrane excitability (Hille, 2001). Conversely, reduced [Ca2+]o may decrease synaptic transmission and other forms of vesicular release where the mechanism requires the entry of Ca2+ into cells (Nicholson, 1980). When populations of cells are active in the CNS, [Ca2+]o falls in their immediate vicinity (Nicholson et al. 1977; Heinemann et al. 1977) and it has been postulated that local [Ca2+]o fluctuations brought about by calcium-mediated dendritic action potentials may influence neuronal function (Egelman & Montague, 1998). Localized changes in [Ca2+]o in and around synaptic terminals may also have physiological consequences (Borst & Sakmann, 1999; Egelman & Montague, 1999; Rusakov, 2001; Rusakov & Fine, 2003). In all these mechanisms there is an implicit diffusion-mediated coupling between the local site of calcium action and the reservoir of [Ca2+]o in the neighbouring ECS.
A substance diffusing in a free medium, such as water or a very dilute gel, has a diffusion coefficient D; when the substance diffuses in the ECS of brain tissue it is more hindered than in the free medium and the diffusion is characterized by an effective diffusion coefficient D*. This hindrance is brought about by a variety of factors collectively and formally characterized by the tortuosity, λ= (D/D*)0.5 (Nicholson & Phillips, 1981; Nicholson, 2001; Syková & Nicholson, 2008). One component of λ is geometrical, caused by the obstruction introduced by cell bodies and their vast membrane expansions in the form of axons, dendrites or glial processes and possibly by local dead-space microdomains. Another component may arise from the viscosity of the interstitial fluid. In addition to this, for a specific substance, very rapid equilibrium binding (i.e. much faster than the local time constant for diffusion) to fixed sites in the ECS may also increase tortuosity (see Section 14.2 in Crank, 1975); such binding might occur through electrostatic interaction between Ca2+ and the negatively charged ECM. Although an early study appeared to substantiate such an interaction (Morris & Krnjević, 1981), a subsequent investigation failed to confirm it (Nicholson & Rice, 1987).
It has long been recognized that, after suitable staining, the brain ECM can be visualized in both light and electron microscopy in the form of a ‘ground substance’ that is located in the space between cells (Schmitt & Samson, 1969). It was appreciated that the ECM of the brain was similar in several aspects to that found in the better characterized connective tissue and was constructed in large part from ‘mucopolysaccharides’ (Schmitt & Samson, 1969). Today ‘mucopolysaccharide’ has been replaced by the term glycosaminoglycan (GAG) that is defined as a molecule with repeating disaccharide units. The GAGs found in the ECS include chondroitin/dermatan sulphate, heparin/heparan sulphate and hyaluronan (hyaluronic acid); all are strongly negatively charged, with an average of between one and three charges per disaccharide unit, and are classed as polyelectrolytes (Bandtlow & Zimmermann, 2000). The sulphated molecules typically form unbranched chains, have a relative molecular mass (Mr) of 5000–50 000 (Comper & Laurent, 1978) and are usually attached to protein backbones, most commonly forming either a chondroitin sulphate proteoglycan (CSPG) or heparan sulphate proteoglycan (HSPG). There is evidence that extracellular CSPGs and HSPGs may not be uniformly distributed in the CNS and these proteoglycans are known to be concentrated in so-called pericellular nets (Brückner et al. 1993). Hyaluronan is also unbranched but not sulphated and may have a relative molecular mass of several million. In contrast to the other GAGs, hyaluronan does not complex directly with proteins. The use of antibody techniques has identified and classified an ever increasing number of components of the ECM. It is thought that the lectican family of CSPGs, comprising aggrecan, versican, neurocan and brevican, are particularly important in the brain and combine with hyaluronan and the glycoprotein tenascin to form organized complexes (Yamaguchi, 2000). In this report we focus on the CS component of the brain ECM because there is extensive evidence that CS is a major component and has a variety of functional roles that are continuing to emerge. Expression of CSPGs increases dramatically after brain injury and inhibits axon re-growth (Galtrey & Fawcett, 2007). Along with increased CSPG expression and more evident glial staining, the diffusion properties of the brain, as measured with TMA+, also change following local injury (Roitbak & Syková, 1999). Indeed, there is increased expression of CSPGs by reactive astrocytes in glia scars (Silver & Miller, 2004). These facts make it plausible that altered Ca2+ diffusion caused by changed ECM may be a factor in the response of the brain to injury.
The interaction between mono- and divalent cations and CS has been the subject of biophysical investigations on model systems (e.g. Magdelénat et al. 1974; Parker et al. 1988) and has been a basis for testing Manning's concept of counter-ion condensation (Manning, 1972, 1979; Comper & Laurent, 1978). These and other studies have shown that, at low ionic strength (1–5 mm), a strong electrostatic interaction retards the diffusion of cations, especially divalent species, and this interaction is adequately described by Manning's theory. However, at typical physiological ionic strength (150 mm), when there is a preponderance of added NaCl, there is little or no reduction in monovalent ionic diffusion and a more limited effect on the diffusion of divalent ions. The influence has been hard to quantify, however, and difficult to predict theoretically in physiologically relevant solutions.
In the CNS there is even less understanding of how CS might influence Ca2+ diffusion. While there is little doubt that CSPGs exist in the ECS, the net amount of CS is uncertain. One biochemical study (Jenkins & Bachelard, 1988) estimated that there was 0.55 μg (mg lipid-free dry brain)−1 CS in the rat cerebral cortex at age 47 days. The protein content of the tissue at that age was 127.1 mg (g fresh weight)−1 and we equate this protein content with the lipid-free dry brain. Assuming that 1 g of tissue is mainly water and corresponds to a volume of 1 ml and that the Mr of a CS disaccharide unit is 457 (Bathe et al. 2005), these data lead to a CS tissue concentration of 0.153 mm for the disaccharide unit. Some of the CS assayed by Jenkins & Bachelard (1988) may have had an intracellular location, indeed, Aquino et al. (1984) claimed that all CS was intracellular in the adult cortex; however, more recent evidence suggests that only about 50% of the measured CS is intracellular (Lin et al. 2008). Taking 50% of the CS as extracellular, and the volume fraction of the ECS as 0.24 (as we will show later in this paper), then [CS]o would be 0.32 mm. Although isolated disaccharide units are not found in the ECS (they exist only as components of long polymers), this calculation is relevant to estimates of counter-ion concentration because each CS disaccharide unit usually has two negative charges associated with the sulphate groups. This concentration (0.32 mm) of CS is similar to that used in some of the biophysical experiments mentioned above.
A powerful tool for studying the effect of extracellular CS in tissue is the application of chABC (Crespo et al. 2007). This bacterial enzyme degrades the CS chains leaving oligosaccharide stubs on the protein backbone of the CSPG that may be recognized by using immunohistochemistry (Caterson et al. 1985; Brückner et al. 1998). Indeed, chondroitinase has been used to promote functional recovery of the CNS after injury (Crespo et al. 2007). In the present study, we use diffusion measurements based on a point-source paradigm (Syková & Nicholson, 2008) employing both real-time pressure (RTP) injection of Ca2+ (Nicholson, 1985) and the real-time iontophoresis (RTI) of TMA+ (Nicholson & Phillips, 1981) in combination with chABC treatment in brain slices. Our approach enabled us to largely isolate the influence of extracellular CS and to quantify the influence of CS on mono- and divalent ion diffusion in functional brain tissue.
Methods
Rat brain slices
All experiments were conducted either at NYU School of Medicine or SUNY Downstate Medical Center in accordance with NIH guidelines and approved by the local Institutional Animal Care and Use Committee. A total of 42 adult Sprague–Dawley female rats (175–250 g) were anaesthetized with sodium pentobarbital (50 mg kg−1i.p.) and decapitated.
The brain was removed from the skull and cooled with ice-cold artificial cerebrospinal fluid (ACSF; see below). Coronal brain slices (400 μm thick) were prepared as described previously (Kume-Kick et al. 2002) using a vibrating blade microtome (VT 1000 S; Leica Microsystems GmbH, Nussloch, Germany). The slices were submerged in the ACSF in a recovery chamber at room temperature for about 1 h. The composition of ACSF was (in mm): NaCl 124, KCl 5, NaHCO3 26, NaH2PO4 1.25, d-glucose 10, MgCl2 1.3, CaCl2 1.5. The ACSF was gassed with 95% O2–5% CO2 to buffer pH at 7.4. The osmolality of the ACSF, determined with a freezing point-depression osmometer (Osmette A, model no. 5002; Precision Systems Inc., Natick, MA, USA), was about 300 mosmol kg−1. For TMA+ diffusion measurements, 0.5 mm TMA chloride was added to the ACSF to provide a calibration standard.
Treatment of brain slices with chABC
The cleavage of CS with chABC followed the procedure of Bukalo et al. (2001). Briefly, after cutting and 1 h of recovery in ACSF at room temperature, several slices were transferred into a chamber with ACSF containing chABC (0.2 U ml−1, Seikagaku Corporation, Tokyo, Japan). The slices were maintained at 37°C for 2 h or at room temperature for 3 h and both protocols gave the same results. The slices were then returned to the normal ACSF for 1 h prior to diffusion measurements or immunohistochemistry. A control group of slices underwent the same treatment but without the addition of chABC.
Diffusion measurements
For diffusion measurements, a brain slice was placed in a submersion tissue chamber (model RC-27L; Warner Instrument Corp., Hamden, CT, USA). The chamber was perfused with ACSF at a flow rate of 2 ml min−1, maintained at 34 ± 1°C by a dual automatic temperature controller (model TC-344B; Warner Instrument Corp.) operating an in-line heater (model SH-27A; Warner Instrument Corp.) and a chamber heating system. The chamber was located on the fixed stage of a compound microscope (BX61WI, Olympus America, Melville, NY, USA). Recordings were made in the somatosensory neocortex (layers III–VI) and in the stratum radiatum of the CA1 region in hippocampus (Fig. 1).
Figure 1. Setup for measuring diffusion of Ca2+ in brain ECS.

Left panel, real-time pressure (RTP) method: Ca2+ pressure injected into brain slice is detected by ion-selective microelectrode (ISM) about 100 μm away, see Methods for details. Right upper panel, examples of normalized Ca2+ diffusion curves in agarose and brain obtained with RTP method, time of injection marked by black dot in graph. Right lower panel, brain regions investigated in this study (neocortex and hippocampus). Brain section drawing modified from Paxinos & Watson (1997), with permission.
The study employed the RTP and RTI methods to measure the diffusion of extracellular probes. We will describe the methods only briefly; the theory and description of the analysis algorithms can be found elsewhere (Nicholson & Phillips, 1981; Nicholson, 1985, 1992, 1993, 2001; Hrabětová & Nicholson, 2007) and the equations used for the RTP analysis are described in Results. First, we explain why we chose to use the RTP method to analyse Ca2+ diffusion.
Choice of method for measuring diffusion of Ca2+
Most studies of ECS diffusion properties have employed the RTI method with TMA+. Iontophoresis from a micropipette causes very localized release of the charged substance at a high and indeterminate concentration into the brain ECS. For a substance like TMA+ this is unimportant because this ion does not complex with any known substance in the ECS. In contrast, Ca2+ at elevated concentration will potentially complex with extracellular HCO3− (typically about 24 mmin vivo and 26 mm in slice ACSF) and phosphate in the immediate vicinity of the release site, resulting in clogging of the iontophoresis micropipette and an erratic transport number. This problem was discussed by Nicholson & Rice (1987) who believed that it probably accounted for the very small effective diffusion coefficient measured in an earlier study by Morris & Krnjević (1981). In more recent studies, such as those of Schwiening & Thomas (1996), Ca2+ iontophoresis has been successful in media without HCO3− or phosphate and in the intracellular milieu (where HCO3− might be 10–12 mm at normal intracellular pH); however, the iontophoresis current was typically 10 nA whereas for the RTI method a current of 50–100 nA would be used. These considerations indicate that iontophoresis of Ca2+ in the ECS will not give reliable quantitative data and suggest that the RTP method is the better choice because it ensures that the released Ca2+ concentration remains at or below the initial concentration in the micropipette. Both the RTP and RTI methods measure D* allowing an estimate of λ, which was the primary goal of this study. The only advantage of the RTI method is that it also measures the volume fraction; however, this is only possible when the iontophoresis micropipette maintains a stable transport number. In principle the RTP method could measure volume fraction if the injected volume were accurately known but in practice this is not possible for the sub-nanolitre volumes employed here.
RTP method to measure Ca2+ diffusion
Calcium was released by pressure injection from a micropipette and detected by an ISM selective for Ca2+ positioned about 100 μm away. The micropipette for pressure injection was fabricated from a glass micropipette pulled from thin-wall glass tubing (A-M Systems, Inc., Carlsborg, WA, USA) and filled with a solution containing 20 mm CaCl2, 100 mm NaCl and 20 mm TMA-chloride to give a measured osmolality of 291 mosmol kg−1. The addition of the TMA enabled dual Ca2+-TMA+ diffusion measurements to be made in some experiments (see Appendix) but the same electrode-filling solution was retained in all RTP experiments. For diffusion measurements, a brief pressure pulse of nitrogen (5–50 ms, 20 p.s.i.) was applied via an electrically controlled valve (Picospritzer, Parker Hannifin Corp., Pneutronics Division, General Valve Operation, Fairfield, NJ, USA).
The Ca2+-ISMs were prepared from double-barrelled theta glass (Warner Instrument Corp.) as described previously (Nicholson, 1993). The ion-detecting barrel of the Ca2+-ISM was filled with 150 mm CaCl2 and utilized calcium ionophore I, cocktail A (Sigma-Aldrich, St Louis, MO, USA; see Lanter et al. (1982)). The reference barrel, which measured the local DC potential, was filled with 150 mm NaCl and the voltage on the reference barrel subtracted from that on the ion barrel (see below). Each Ca2+-ISM was calibrated in a set of solutions (1.5, 3, 6, 12 and 24 mm Ca2+, all in 150 mm NaCl) and the results fitted with the Nikolsky equation to obtain the slope and the interference for each Ca2+-ISM (Nicholson, 1993).
The question arises as to whether the release of 20 mm Ca2+ into an ECS that contains both bicarbonate and phosphate will result in chelation or precipitation (see above). To address this we made several Ca2+-selective ISMs, calibrated them as described and then determined the apparent Ca2+ concentration when we brought the total calcium concentration in our standard ACSF to 20 mm (as stated earlier, this solution contained 26 mm NaHCO3, 1.25 mm NaH2PO4 and was gassed with 95% O2–5% CO2). We determined that the presence of the bicarbonate and phosphate reduced the apparent Ca2+ concentration to 18 mm. We also saw a slight precipitation that was absent in similar solutions without phosphate; however, the apparent Ca2+ activity remained at 18 mm. We conclude that we should assume that the initial Ca2+ concentration in the brain immediately after pressure injection from the micropipette was 18 mm, not 20 mm.
For diffusion measurements, the pressure injection micropipette and the Ca2+-ISM were positioned independently in agarose gel or brain slice using two robotic micromanipulators (model MP 285, Sutter Instrument Co., Novato, CA, USA; Hrabětová & Nicholson, 2007) mounted on the fixed stage of the compound microscope. The positions of the tips of the micropipettes were confirmed using a water-immersion objective (UMPlanFl, ×10, NA 0.3, Olympus America) with IR-DIC (differential interference contrast) optics and a video camera. The Ca2+ signal was extracted by continuous subtraction of the potential on the reference barrel from the potential on the ion-detecting barrel using a dual-channel microelectrode preamplifier (model IX2-700; Dagan Corp., Minneapolis, MN, USA). The separated Ca2+ and DC potentials were amplified and low-pass filtered (6 Hz) using a signal conditioner (CyberAmp 320, Axon Instruments, Molecular Devices, Sunnyvale, CA, USA), and continuously monitored on a chart recorder. The voltages representing the Ca2+ diffusion curves were digitized with an A/D converter (model PCI-MIO-16E-4; National Instruments Corp., Austin, TX, USA) installed in a personal computer and saved using a custom LabView (National Instruments Corp.) program that converted the voltage to [Ca2+]o based on the previous calibration data for the Ca2+-ISM.
Three solutions to the diffusion equation under RTP conditions are detailed in Results as eqns (7), (8) and (9). At least five instances of each equation were fitted to the data using a non-linear simplex algorithm with randomly chosen starting parameters and the results ranked in order of goodness of fit. From the fit, the parameter D or D* and b, the initial radius of the injection in the medium, were extracted. In addition, the non-specific loss or clearance parameter, k′ was obtained in brain. All the curve-fitting and analysis was accomplished with Walter, a program developed in-house (Hrabětová & Nicholson, 2007) using MATLAB (MathWorks, Natick, MA, USA). The values obtained for λ are described in detail in the Results section; most values of b in brain tissue fell in the range 55–75 μm and the significance of this parameter will be considered further in the Appendix, where an analysis verifies that the proximity of the slice boundary has a negligible effect on the measurements.
The free diffusion coefficient D was extracted from diffusion curves obtained in dilute agarose gel (NuSieve GTG, FMC BioProducts, Rockland, ME, USA) formulated as 0.3% agarose (i.e. 0.3 g (100 ml)−1) dissolved in 150 mm NaCl at 23°C or 34°C. The tortuosity, defined as λ= (D/D*)0.5, was calculated in brain tissue.
Verification that Ca2+ injection did not affect tissue diffusion properties
Because we injected a small bolus of Ca2+ at an effective concentration of 18 mm into the ECS it was important to confirm that this concentration, well above the normal physiological value, did not itself affect the properties of the ECS, as encapsulated in the parameters λ, the tortuosity, and α, the volume fraction (defined as the fraction of a representative elementary volume of tissue that is occupied by the ECS). All the results presented here assume that λ and α remain constant and do not vary with distance from the point of injection. If we suppose that this is not the case, so that λ and α are functions of spatial position, then it can be shown from basic theory (Nicholson & Phillips, 1981) that the underlying diffusion equation will take the form:
| (1) |
augmented by a source term or appropriate initial conditions.
Here, C is the concentration of substance in the ECS and the symbol ∇ represents the spatial derivative in an appropriate coordinate system. The first terms on either side of the equality constitute the standard diffusion equation, the second term on the right arises from the spatial dependence of λ and α and it is obvious that, in general, solutions to the standard diffusion equation will not satisfy the extended version represented in eqn (1) so solutions derived from the standard diffusion equation should not fit the experimental curves and any parameters extracted will be expected to differ from those obtained in a medium where λ and α are constant.
To a degree, the consistency of the results that will be presented in this paper, as well as the quality of the curve fitting with varying volumes of Ca2+ injection, argue against any variability of λ and α but we present a direct test using the integrative optical imaging (IOI) method. The local injection of a small bolus of Ca2+ results in a steep concentration profile that rapidly dissipates (see Appendix; Fig. 7D), therefore any change in diffusion properties is likely to occur in the vicinity of the injection site. This cannot be monitored directly with the RTP and RTI methods that typically locate the monitoring ISM at 100–130 μm from the source micropipette. To look for local distortions of the spatial profile, the IOI method provides a better approach.
Figure 7. Computed Ca2+ profiles and experimental dual Ca2+-TMA+ profiles.

A, image model for computing effect of boundary. Left schematic diagram shows injection of spherical bolus of Ca2+ forming a source (‘+’) with radius b at depth d below the absorbing boundary of the slice, which is a semi-infinite medium. In the RTP method the concentration is recorded at distance r from the centre of the bolus with an ISM (recording location marked with ‘×’). The dimensions in the diagram are scaled to correspond with those described in B. In right schematic diagram the boundary problem is simulated by placing an image sink (‘−’) of the same size as the source (‘+’) in an infinite tissue medium and combining the concentrations resulting from the source and sink at the recording location (‘×’). B, effect of absorbing boundary on diffusion profile as function of time. A spherical bolus in an infinite medium and a boundary model following the scheme in A were each computed using eqn (7) and compared. The parameters used in this calculation were based on average values for the diffusion of Ca2+ in the neocortex under normal conditions. Specifically, r= 0.012 cm, d= 0.02 cm, b= 0.0072 cm. Diffusion parameters obtained with Ca2+: D= 9.4 × 10⁻⁶ cm2 s−1, λ= 2.05, k′= 2.6 × 10⁻³ s−1. The value of α= 0.24 was based on RTI-TMA+ measurements. These parameters gave U= 375 pl (see eqn (6)). The effective concentration of the injected Ca2+ was 18 mm and the background concentration was 1.5 mm. C, co-injection and recording of Ca2+ and TMA+ diffusion profiles with RTP method. Both ions were co-injected (20 mm CaCl2, 20 mm TMA-chloride together with 100 mm NaCl in the injection mixture) in a neocortical slice at a depth of 200 μm below the slice surface. Ca-ISM was 100 μm from the injection micropipette and TMA-ISM was 200 μm away, which accounts for the differences in amplitudes. Radius of injected volume estimated at 35–40 μm from eqn (11). Curve fitting showed λCa= 2.03 and λTMA= 1.62. D, theoretical diffusion profile as function of distance. Same parameters as those used in B. Each curve represents the concentration profile at the indicated time after injection. Note the rapid decay of the concentration profiles with time as Ca2+ moves out in 3-D volume.
The IOI technique employs a similar pressure injection protocol to that employed by the RTP method but the substance used is a fluorescent molecule that can be imaged as a temporal sequence of spatial concentration profiles which then provide the effective diffusion coefficient for the substance (see Nicholson & Tao, 1993; Hrabětová & Nicholson, 2007 for details of the method). Here we used IOI with the small dye molecule Alexa Fluor 488 hydrazide (AF, Mr 547; Molecular Probes, Invitrogen Corp., Carlsbad, CA, USA), that is known to remain extracellular and provide reliable data in the rodent brain (Xiao & Hrabětová, 2009). The experimental design was straightforward: control measurements injected 1 mm of AF in 150 mm NaCl, test measurements injected 1 mm of AF with 20 mm CaCl2, 20 mm TMA-chloride and 100 mm NaCl (to match the solution used throughout the RTP experiments). Based on eqn (1) we hypothesized that if the presence of the Ca2+ compromised the ECS, the resulting diffusion profiles would differ from the control and also yield a different value for D* and hence λ. A representative experiment is shown in Fig. 2 and the spatial profiles indicated that injection volumes were similar to those used in RTP experiments. Slices of neocortex from three rats were used and a control λ-value for AF of 1.64 ± 0.07 (mean ±s.d., n= 18) obtained based on a measured D= 5.19 × 10⁻⁶ cm2 s−1 at 34°C for AF in 0.3% agarose and 150 mm NaCl. In slices where the Ca2+-containing solution was injected the λ-value for AF was 1.68 ± 0.07 (mean ±s.d., n= 19) based on D= 5.35 × 10⁻⁶ cm2 s−1 for AF at 34°C measured with the Ca2+-containing solution. The difference in means was not statistically significant (P > 0.05, t test). We conclude that the injection of 20 mm Ca2+ has a negligible effect on the diffusion properties of the ECS.
Figure 2. Images of diffusion profiles of Alexa Fluor 488 hydrazide (AF) injected together with and without 20 mm Ca2+.

Data acquired and analysed with integrative optical imaging (IOI) method and image intensity (I) visualized in pseudo-colour (direction of increasing concentration indicated in colour bar). Injected ‘AF + Ca2+’ solution contained 1 mm AF, 20 mm CaCl2, 20 mm TMA-chloride and 100 mm NaCl, ‘AF’ control solution contained 1 mm AF and 150 mm NaCl. Time shown is time after actual injection. The profiles (orange) under each image corresponded to intensity amplitude at locations indicated by the horizontal dotted line in first image. Fitted curves (dashed lines) represented appropriate form of diffusion equation (Nicholson & Tao, 1993). For these data the fitted curves gave λ= 1.69 for ‘AF + Ca2+’ solution and λ= 1.67 for ‘AF’ control. Calibration bar = 100 μm. Note that the curve-fitting excluded the lowest 10% of the data and the discrepancy in this region is probably caused by light-scattering at these low intensities. For further details of the IOI method see text.
RTI method to measure TMA+ diffusion and volume fraction
The RTI method using TMA+ was employed to determine if the volume fraction α was altered by chABC treatment. The use of TMA+ also allowed confirmation that the hindrance to diffusion of this small monovalent ion, as measured by the tortuosity, was unchanged by CS removal. TMA+ was iontophoretically delivered from a microelectrode and detected by a TMA+-ISM that was usually positioned about 100 μm away from the source. Microelectrodes for iontophoretic delivery and TMA+-ISMs were again prepared from double-barrelled theta glass, as described previously (Nicholson, 1993). Iontophoretic microelectrodes were filled with 150 mm TMA-chloride. A continuous positive bias current of 20 nA was applied from a constant-current, high-impedance source (model Axoprobe-A1 Amplifier; Axon Instruments, Molecular Devices) to maintain a steady transport number (nt) (Nicholson & Phillips, 1981), then the current was stepped up to 60–100 nA for 50 s to make diffusion measurements.
The ion-detecting barrel of the TMA+-ISM was filled with 150 mm TMA-chloride and utilized a tetraphenylborate-based ion exchanger (Corning exchanger 477317, currently available as IE 190 from WPI, Sarasota, FL, USA; see Oehme & Simon (1976)) in the tip. The reference barrel was filled with 150 mm NaCl. Each TMA+-ISM was calibrated in a set of solutions (0.5, 1, 2, 4 and 8 mm TMA+ in 150 mm NaCl), using the Nikolsky equation.
The positioning and visualization in the recording setup followed the same procedure as for the Ca2+ measurements. Again, an appropriate solution to the diffusion equation (see Nicholson & Phillips, 1981; Nicholson, 1993 for details) was fitted to the diffusion curves using the program Walter. The free diffusion coefficient, D, and the transport number nt of the iontophoretic micropipette were extracted from diffusion curves obtained in dilute agarose gel (0.3% in 150 mm NaCl and 0.5 mm TMA-chloride) at 34°C and curve-fitting to recordings in the brain slices provided D* and tortuosity λ, together with volume fraction α, and non-specific clearance or loss parameter k′.
Diffusion measurements in CS gels
Agarose gels (0.3%) were made as for free diffusion measurements except that the agarose was dissolved in a solution containing 100 mm NaCl, 1.5 mm CaCl2, 1.3 mm MgCl2 and 100 mm Hepes hemi-sodium salt (Sigma-Aldrich) to buffer the pH at 7.4. This will be referred to as ‘Hepes-agarose’ and was used for control measurements of Ca2+ diffusion. To explore the effect of CS, 0.05% (i.e. 0.05 g (100 ml)−1) CS sodium salt (Sigma-Aldrich) was added to Hepes-agarose. All measurents were made at 23 ± 1°C.
Immunohistochemistry
The immunochemistry confirming the cleavage of the CS with chABC followed published procedures (Bukalo et al. 2001). Experimental slices were treated with chABC as described earlier for the physiological measurements while control slices were left in the chABC-free ACSF. Both types of slices were fixed in 4% paraformaldehyde in 0.1 m PBS at room temperature. Two regions of interest were then cut out and the resulting mini-slices were rinsed 2–3 times in PBS for 5 min at room temperature, placed in 30% sucrose in PBS, for several hours or overnight, and imbedded in Tissue-Tek (Electron Microscopy Sciences, Hatfield, PA, USA). Frozen sections, 50 μm thick, were cut with a cryostat (Reichert-Jung Cryocut 1800, Leica Biosystems GmbH, Nussloch, Germany). The sections were blocked in 2% bovine serum albumin (BSA) in PBS for 1 h at room temperature. A primary antibody against the oligosaccharide stubs generated by the enzymatic cleavage (2-B-6, dilution 1:200, Seikagaku) was added to sections overnight. Sections were then washed three times for 10 min in PBS containing 0.1% BSA. Following the wash, secondary anti-mouse IgG antibodies labelled with Alexa Fluor 488 (dilution 1:400, Molecular Probes, Invitrogen Corp.) were added followed by an incubation of 1 h. Finally, the sections were washed three times for 10 min in PBS containing 0.1% BSA, mounted in Vectashield (Vector Laboratories, Burlingame, CA, USA), viewed under an epifluorescence microscope and imaged.
Results
Solutions to the diffusion equation used in the RTP method
The solutions used are based on those derived in Nicholson (1985) with the later addition of the first-order loss term incorporating the parameter k′ (s−1) (Nicholson, 1992, 1993). The equations are extended here to incorporate rapid equilibrium binding.
We define the basic effective diffusion coefficient,  , for Ca2+ that would be measured in the ECS in the absence of any interaction with the ECM and this is equivalent to
  where λB is the basic tortuosity. This tortuosity incorporates all the hindrance imposed by geometry and interstitial viscosity and it should be the same tortuosity that would be measured using TMA+, which we will show is not influenced by the CS.
The actual effective diffusion coefficient for Ca2+ seen in the brain, D*, is less than and we hypothesize that the decrease can be attributed to the formation of an immobilized complex with constituents of the ECM that is so rapid that the free and immobilized components are in equilibrium at every point. Then, following Crank (1975, eqns (14.1–14.3)), if the immobilized complex has concentration S and the free Ca2+ has concentration C, in the simplest case the kinetic relationship takes the form
| (2) |
where R is a constant. The diffusion equation (assuming constant α and D*) now becomes
| (3) |
Substituting eqn (2) into eqn (3) leads immediately to the standard diffusion equation
| (4) |
with  . This supposes that all the interaction with the matrix can be described by one kinetic constant; obviously this can be further decomposed into more constants if needed.
To solve eqn (4) requires a choice of coordinate system together with initial and boundary conditions. A spherical coordinate system is appropriate here for the RTP method and for the initial condition we inject a volume U (cm3) of Ca2+ at concentration Cf from a micropipette into the medium and suppose it forms a spherical bolus centred on r= 0. We assume that the injected volume infiltrates the ECS and does not penetrate the intracellular space or form a cavity (this assumption is borne out by the accuracy of the curve-fitting in this paper and previous ones) then the volume in the ECS is also U because it is made up of the bulk volume (water) in which the Ca2+ and any accompanying ions are dissolved. The Ca2+ in the injected volume, however, will immediately partition between a bound component  and a mobile component
  . By conservation of mass it follows that, just after the instant of injection
  and from eqn (2) the effective initial concentration in the injected bolus is
| (5) |
Because the injected volume U is confined to the ECS, which has a volume fraction α relative to the whole tissue volume, the injected solution extends to an initial radius b (cm) in the brain and,
| (6) |
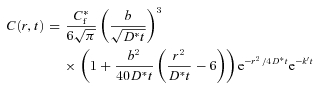
It is assumed that the injected Ca2+ diffuses in an infinite (unbounded) medium and it is shown in the Appendix that this is applicable even in a brain slice. This means that the boundary condition is that the concentration falls to zero at large distances and previous solutions to this diffusion problem (Nicholson, 1985, 1992, 1993) can be used immediately with the modified to describe the concentration of C(r, t), t > 0 as,
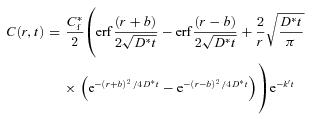 |
(7) |
while  for r≤b and
  for r > b. At r= 0 eqn (7) has the limiting form
For r≫b and b > 0 eqn (7) reduces to
 |
(8) |
and this may be further simplified for a point source to
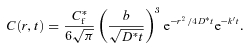 |
(9) |
Obviously for the point source, the definition of b is ambiguous; it has the same definition as before but the actual calculation assumes that all the released substance is confined to a point. Using eqn (6), eqn (9) also may be written in the more familiar form
| (10) |
Note that, when k′= 0 or the loss term is otherwise negligible, the maximum value of C(r,t) in eqn (9) or (10) occurs at 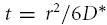 and this leads to the simple relationship
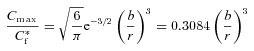 |
(11) |
which does not involve knowledge of D, λ or α.
It is evident that when rapid equilibrium binding is present it is reflected in both the effective diffusion coefficient and in the effective initial concentration. If either eqn (8) or (9) are written in terms of U and α, together with Cf, then a term (R+ 1)α will appear in these equations and this might be interpreted as a modified volume fraction; this does not apply to eqn (7), however. In practice, with the RTP method, U is not known very accurately so α cannot be estimated and only a value of D* is obtained from the time dependence of the diffusion curve. In principle, the existence of the additional amplitude factor [1/(R+ 1)] can be used as an additional check on the validity of the rapid equilibrium binding hypothesis by making paired Ca2+/TMA+ measurements and this will be demonstrated briefly in the Appendix.
To fit the experimental curves, eqns (7), (8) and (9) were randomly chosen and fitted with arbitrary starting points using the non-linear simplex fitting algorithm (see Methods). The fits provided D*, b and k′. Knowing D, λ could be calculated from D* while U/α could be calculated from b, using eqn (6). Using the RTI method with TMA+, α was determined independently, hence an estimate of U was available. In practice we found that eqns (7) and (8) gave the best fits to the curves in brain tissue, reflecting the value of b, which mostly fell in the range 55 and 75 μm (corresponding to injected volumes of 170 and 420 pl, respectively, assuming α= 0.24).
Free diffusion coefficient of Ca2+
Measurement of the free diffusion coefficient DCa was important for two reasons. First, to validate the RTP method used here and second to have a basis for computing λ leading to a discussion of whether the ECM did indeed hinder Ca2+ diffusion more than it hindered that of the benchmark TMA+ monovalent cation. Measurements of DCa were carried out in agarose at two temperatures: 23°C, which was close to 25°C, the standard temperature used for many classical diffusion measurements, and at 34°C, the temperature that was used for subsequent slice measurements. At 23°C we obtained a value of DCa= (7.3 ± 0.3) × 10−6 cm2 s−1 (mean ±s.d., n= 12) whereas at 34°C we obtained DCa= (9.4 ± 1.4) × 10−6 cm2 s−1 (n= 41). These values differ somewhat from the values of DCa obtained in the only previous detailed RTP study of Ca2+ diffusion in agar gel and brain by Nicholson & Rice (1987) so we undertook a search of the literature for other determinations of DCa and compiled the more reliable ones in Fig. 3. The most extensive and frequently quoted values derive from conductivity measurements at four different temperatures by Benson & Gordon (1945), which may be converted to diffusion coefficients using eqn (6.1-32) from Cussler (2009). Other values of DCa at specific temperatures have been obtained by Maroudas et al. (1988) and Wang (1953) using radiolabelled calcium. These three studies all used different methods to that employed here and it is gratifying to see the close agreement with the present data.
Figure 3. Free diffusion coefficient for Ca2+ as a function of temperature.

The data from the references indicated were obtained in water by a variety of methods. ‘Equation’ is eqn (12) fitted to the literature data only. ‘Experiment’ indicates data obtained in the present study in 150 mm NaCl solutions in 0.3% agarose.
As shown in Fig. 3, the data from the literature are well fitted by the equation:
| (12) |
where DCa is measured in cm2 s−1 and T is the temperature in kelvin. Equation (12) predicts a value of 9.78 × 10⁻⁶ cm2 s−1 at 34°C, which is slightly higher than our experimental value of 9.4 × 10⁻⁶ cm2 s−1, probably because the ionic strength and composition of our medium (150 mm NaCl in 0.3% agarose) differs from that of the pure aqueous solution used in the studies that form the basis for eqn (12). Because the higher ionic strength is appropriate to brain measurements, we used our experimental value in estimating tortuosity later in this paper. Equation (12) may be compared with a similar expression established for TMA+ (see eqn (57) in Nicholson, 2001) but note that the TMA+ equation also was based on measurements in 150 mm NaCl in 0.3% agar.
Diffusion of Ca2+ in gel containing CS
Because the primary goal of this paper was to explore the effect of the endogenous CS component of the ECM on Ca2+ diffusion in brain tissue, we made diffusion measurements in agarose gels containing CS to confirm that the presence of this polyelectrolyte could indeed slow Ca2+ diffusion. Control measurements using RTP in Hepes-agarose (see Methods) gave a value for DCa of (7.4 ± 0.29) × 10−6 cm2 s−1 (n= 8) at 23°C, which was essentially the same as that obtained in our normal agarose that only contained 150 mm NaCl. Thus the presence of the added Ca2+, Mg2+ and Hepes did not affect Ca2+ diffusion. Similar measurements then were made in Hepes-agarose containing 0.05% CS and the value of DCa dropped to (4.9 ± 0.85) × 10−6 cm2 s−1 (n= 15). This concentration of CS was chosen to replicate concentrations used by Magdelénat et al. (1974) and Maroudas et al. (1988) in their biophysical experiments. Magdelénat et al. (1979) noted that this concentration of CS could be equated with 3.4 mequiv of Na+. Assuming an Mr for the disaccharide group of 457 (Bathe et al. 2005), a 0.05% solution amounts to 2.2 mm, or 4.4 mequiv if the disaccharide is assumed to have two negative charges per group. In fact, Maroudas et al. (1988; see eqn (1) of that paper) assumed two charges and an Mr of 513 for the Na salt of CS. The disaccharide groups typically are linked into repeating unbranched chains each with an Mr of 5000–50 000 so using an Mr of 500 and a CS concentration of ∼2 mm, these chains would have a concentration of 20–200 μm.
Diffusion of Ca2+ in brain ECS
We began measurements in rat brain slices by quantifying the diffusion of Ca2+ in the ECS of somatosensory neocortex and in the stratum radiatum of the CA1 region of the hippocampus (Fig. 1). Both these brain regions have been shown to be isotropic (Hrabětová, 2005) so measurements in a single geometrical axis suffice to determine the diffusion properties. For simplicity, these regions will be referred to as neocortex and hippocampus. Both injection micropipette and Ca2+-ISM were inserted to a depth of 200 μm below the slice surface with the inter-tip distance set at 100–130 μm and measurements made at 34°C. Representative records of Ca2+ diffusion curves in neocortex and hippocampus are shown in Fig. 4A. The effective diffusion coefficient  , tortuosity (λCa) and non-specific clearance or loss (k′) obtained in all experiments are summarized in Table 1. There was no significant difference in
  between the two regions studied (P > 0.05, t test) and consequently no significant difference in λCa, which had an average value of 2.1. The value of k′ was significantly higher in hippocampus than neocortex (P < 0.001, t test).
Figure 4. Diffusion of Ca2+ before and after CS glycan had been cleaved with chABC.

All diffusion records obtained with RTP method, time of injection marked by black dot in graphs. A, representative records of Ca2+ diffusion curves obtained in neocortex and hippocampus under normal conditions. B, staining of oligosaccharide stubs confirms the cleavage of chondroitin sulphate (CS) glycan with chondroitinase ABC (chABC). C, representative records of Ca2+ diffusion curves obtained in neocortex and hippocampus after slices had been treated with chABC. D, theoretical diffusion curves scaled to match the maximal amplitudes show faster diffusion after chABC treatment (vertical dashed lines indicate time of maxima). E, summary of Ca2+ diffusion data. *P < 0.001, t test; P < 0.05, ANOVA.
Table 1.
Ca2+ diffusion parameters measured in the somatosensory neocortex and in the stratum radiatum of the CA1 region of the hippocampus in rat brain slices using the RTP method
| Region | chABC | D*× 10−6 cm2 s−1 | λ | λ value | k′× 10−3 s−1 | n | No. of slices | No. of rats |
|---|---|---|---|---|---|---|---|---|
| Neocortex | No | 2.26 ± 0.22 | λCa | 2.05 ± 0.10 | 2.6 ± 5.1 | 30 | 7 | 7 |
| Neocortex | Yes | 2.71 ± 0.30 | λI | 1.86 ± 0.10 | 1.6 ± 1.9 | 23 | 5 | 3 |
| Hippocampus | No | 2.16 ± 0.26 | λCa | 2.10 ± 0.13 | 8.8 ± 7.6 | 33 | 9 | 6 |
| Hippocampus | Yes | 3.10 ± 0.45 | λI | 1.75 ± 0.11 | 2.5 ± 2.6 | 24 | 6 | 4 |
Diffusion of Ca2+ when CS glycan is cleaved with chABC
Slices were treated with chABC (see Methods) followed by diffusion measurements. In every experiment, several slices were processed by immunohistochemistry to confirm the cleavage of CS glycan (Fig. 4B). Representative records of Ca2+ diffusion curves in neocortex and hippocampus of slices treated with chABC are shown in Fig. 4C. To enable a direct visual comparison of Ca2+ diffusion curves in treated and control slices, the theoretical curves shown for hippocampus in Fig. 4A and C were scaled to match their peak amplitudes (Fig. 4D). Clearly, in chABC-treated hippocampus, the Ca2+ diffusion curve rises and falls faster, reflecting a higher D*. Values of and k′ obtained in all experiments are summarized in Table 1. Within each brain region, we found in slices treated with chABC to be higher than the value of in the control slices (P < 0.001, t test; Fig. 4E) and this is reflected in the average values of λ, which were 1.86 in the treated neocortex and 1.75 in the treated hippocampus. The loss, k′, was significantly smaller in chABC-treated than in control hippocampus (P < 0.001, t test) but similar in treated and control neocortex (P > 0.05, t test).
The central question addressed in this study is the interaction between CS glycan and Ca2+ diffusing in the ECS. But another interesting aspect is a comparison of the two brain regions studied. For this purpose, we applied two-factor ANOVA analysis to the data to test for the possible correlation between the treatment with chABC and brain region. The two-factor ANOVA confirmed the outcome of the t test and revealed an additional finding. As we had already established with the t test, there was no difference between measured in neocortex and hippocampus of control slices, while chABC treatment resulted in a value of that was increased significantly when compared to the control value within each region. Applying a two-factor ANOVA we found that the chABC effect was more pronounced in hippocampus than neocortex; (hippocampus, chABC) > (neocortex, chABC) (P < 0.05) (Fig. 4E).
In summary, our experiments showed that cleavage of CS glycan facilitated Ca2+ diffusion in the ECS indicating an interaction between Ca2+ and the CS glycan and this effect was more pronounced in hippocampus.
TMA+ measurements to confirm ECS structure after chABC treatment
It may be asked if enzymatic removal of CS glycan might alter the biophysical properties of the ECS leading to alternative interpretations of our findings. Indeed, ECM molecules may play a critical role in maintaining the structure of the ECS; for example Sykováet al. (2005) reported a decrease in volume fraction and tortuosity of the ECS in the neocortex and hippocampus of tenascin-R-deficient and HNK-1 (human natural killer-1) sulphotransferase-deficient mice.
We addressed this question by using the RTI method to measure the diffusion of TMA+, a small monovalent cation that has become a standard extracellular diffusion probe (Nicholson & Phillips, 1981; Kaur et al. 2008; Syková & Nicholson, 2008). An advantage of this method is that it enables the quantification of the volume fraction of the ECS, α, in addition to λ and k′. As in Ca2+ experiments, two groups of slices were studied, one treated with chABC and the other a control group without treatment. Both the iontophoretic microelectrode and the ISM again were inserted to a depth 200 μm below the slice surface with the inter-tip distance 100–130 μm and measurements made at 34°C. Representative records of TMA+ diffusion curves in hippocampus in chondroitinase-treated and control slices are shown in Fig. 5. The cleavage of CS glycan was again confirmed by immunohistochemistry (data not shown). The values of α, λ and k′ obtained in all experiments are summarized in Table 2 and are consistent with other diffusion studies in these regions using the RTI-TMA method (see Syková & Nicholson, 2008 for review). Within each brain region, no significant differences between treated and control slices were found in any parameter. In summary, the cleavage of CS glycan did not alter the structure of the ECS, as measured by α and λTMA. Note that λTMA < λCa (after chABC) < λCa (before chABC) in both brain regions; this inequality will be addressed in the Discussion.
Figure 5. Diffusion of TMA+ measured with real-time iontophoresis (RTI) method to confirm extracellular space (ECS) properties before and after chABC treatment.

Diffusion of TMA+ in normal hippocampal slices (data, grey; theoretical curve, dashed line) and after chABC treatment (data, green; theoretical curve, dashed). Grey and green curves have similar shape and amplitude indicating that similar ECS parameters (λTMA, α and k′) were obtained in the two experimental conditions. It is noteworthy that the volume fraction, α, is unchanged after chABC treatment. Iontophoresis duration indicated by black bar.
Table 2.
TMA+ diffusion parameters measured in the somatosensory neocortex and in the stratum radiatum of CA1 region of the hippocampus in rat brain slices using the RTI method
| Region | chABC | λTMA | α | k′× 10−2 s−1 | n | No. of slices | No. of rats |
|---|---|---|---|---|---|---|---|
| Neocortex | No | 1.64 ± 0.08 | 0.24 ± 0.02 | 1.1 ± 0.3 | 16 | 6 | 4 |
| Neocortex | Yes | 1.68 ± 0.08 | 0.24 ± 0.02 | 1.2 ± 0.4 | 21 | 7 | 5 |
| Hippocampus | No | 1.49 ± 0.04 | 0.23 ± 0.03 | 1.4 ± 0.4 | 16 | 5 | 5 |
| Hippocampus | Yes | 1.53 ± 0.08 | 0.23 ± 0.04 | 1.5 ± 0.3 | 21 | 7 | 5 |
Data are expressed as mean ±s.d. Measurements were made at 34°C and DTMA= 12.4 × 10⁻⁶ cm2 s−1 was used to calculate λTMA. The number of measurements was n and several were made in each slice.
Discussion
The value of DCa
We determined that the value of DCa at 34°C was 9.4 × 10⁻⁶ cm2 s−1 in 150 mm NaCl and 0.3% agarose and showed that it was consistent with several other determinations in the literature. Previous values of DCa obtained by Nicholson & Rice (1987) using earlier RTP methodology now appear too low.
It is instructive to compare the value of DCa at 34°C with that of DTMA at the same temperature. The value and temperature dependence of DTMA has been established using the RTI method (see eqn (57) in Nicholson, 2001) and DTMA at 34°C in 150 mm NaCl and 0.3% agarose is 12.4 × 10⁻⁶ cm2 s−1. Thus the free diffusion coefficient for TMA+ is some 30% greater than that of Ca2+ despite the fact that the Mr for TMA+ is 74 while that of Ca2+ is 40. This paradoxical result is often explained by assuming that ions are accompanied to varying degrees by a shell of water molecules, held in the vicinity of the ion by electrostatic forces so that the apparent radius of the diffusing Ca2+ ion, as calculated from the Stokes–Einstein equation (Syková & Nicholson, 2008) appears larger than that of TMA+. The interaction between water and ions is now thought to be more complex (Hille, 2001, Cussler, 2009) but the essence of the explanation still resides in the interaction between these small ions and the surrounding water molecules.
Effect of CS on DCa
When DCa is measured in Hepes-agarose gel containing 0.05% CS at 23°C, the effective diffusion coefficient is reduced to 4.9 × 10⁻⁶ cm2 s−1, from the control value of 7.4 × 10⁻⁶ cm2 s−1 in agarose without CS. This represents a reduction to 66% of the value of DCa. It is interesting to compare this result with those obtained by prior studies using radiotracers. Magdelénat et al. (1974) used the chloride salt of 85Sr2+ at a temperature of 25°C and a concentration of 0.6 mm in a solution of 0.05% CS, which had 1.5 mm Na+ as counter-ion. To this low ionic strength solution Magdelénat et al. (1974) added increasing amounts of NaCl. As the added NaCl rose, the value of DSr increased monotonically and at 150 mm added NaCl, DSr approached the value that it would have had in the absence of CS (see Fig. 3 in Magdelénat et al. 1974). Here we are assuming that Sr2+ interacts with CS in the same way as does Ca2+, which may be open to question. A more quantitative study was carried out by Maroudas et al. (1988) who used 45Ca2+ and a variety of CS concentrations and ionic strengths. Using 0.05% CS, 2.5 mm Ca2+ with 150 mm NaCl added, at 4°C, DCa was 3.2 × 10⁻⁶ cm2 s−1 compared to 4.9 × 10⁻⁶ cm2 s−1 in the presence of the added NaCl but without CS (Table 5 in Maroudas et al. 1988). This represents a reduction to 65% of the value obtained without the CS, which agrees closely with our result (the values of DCa differ because of the difference in temperatures at which the two sets of measurements were made). It may also be noted that this same study found that 0.05% hyaluronan (HA) in the presence of 150 mm NaCl reduced DCa to 3.9 × 10⁻⁶ cm2 s−1 (Table 5 in Maroudas et al. 1988). Taken together all these results indicate that we can expect 0.05% CS to significantly reduce DCa, even in the presence of 150 mm NaCl, and HA may also be expected to have an effect in the same direction, if present at sufficient concentration.
Values of α and λTMA in brain
The RTI-TMA method provided measurements of the volume fraction (α) in neocortex and hippocampus as well as values for λTMA. As noted earlier, both these brain regions are isotropic so measurements of α and λ may be obtained from measurements in a single geometrical axis.
A value of 0.24 was obtained for α in the neocortex (Table 2) and this was consistent with previous values obtained in brain slices (Kume-Kick et al. 2002; Hrabětová, 2005) and in the young adult in vivo (Lehmenkühler et al. 1993). Similarly, a value of 0.23 was measured for α in the stratum radiatum of the hippocampus, which also agrees with previous measurements in slices (Hrabětová, 2005) and in vivo (Mazel et al. 1998). We note that two earlier measurements of α in this brain region (McBain et al. 1990; Pérez-Pinzón et al. 1995) obtained values of 0.13. We have no obvious explanation for these values except to note that the calculation of α depends more heavily on accurate calibrations and other factors than does λ and is more susceptible to error and tissue state; we can now say that the vast majority of measurements in several different brain regions have yielded α≥ 0.2 (Syková & Nicholson, 2008). An important finding of the present study was that the chABC treatment did not alter the volume fraction in either brain region. This suggests that the removal of CS side-chains does not bring about a significant restructuring of the ECS and contrasts with results obtained in mice deficient in tenascin-R where the elimination of this ECM component reduces the volume fraction by 22–26% (Sykováet al. 2005).
The value of λTMA for cortex was 1.64 and was consistent with other measurements in slices (Pérez-Pinzón et al. 1995; Kume-Kick et al. 2002) and in vivo (Lehmenkühler et al. 1993).
For the hippocampus (CA1 stratum radiatum) we obtained a value of 1.49 for λTMA, which was similar to previously published values obtained in brain slices (Pérez-Pinzón et al. 1995; Hrabětová, 2005). This is also consistent with the value of 1.44 (calculated from the usual definition as λ= (<D>/<D*>)0.5 where <> indicates mean value) obtained by Zheng et al. (2008) in slices using multiphoton imaging and the small fluorescent dye Alexa Fluor 350 hydrazide (Mr= 349). Using an in vivo preparation, Mazel et al. (1998) obtained evidence for anisotropy in λ in this region and a significantly higher λ value associated with the axis perpendicular to the brain surface; working with slices, Hrabětová (2005) found no evidence for anisotropy and suggested that the result obtained by Mazel et al. (1998) might have been caused by the source and measuring micropipettes straddling a brain boundary. Finally we note that McBain et al. (1990) also measured a high value of λ; however, from the forgoing discussion, we think this early study may have been anomalous (see also Hrabětová, 2005).
In our study we saw that values of λTMA in both neocortex and hippocampus rose slightly after chABC treatment but this was not statistically significant. We note that the value of λTMA is lower in the stratum radiatum of the hippocampus than in the neocortex and it has been hypothesized that this may reflect a simpler glial organization in hippocampus compared to neocortex (Hrabětová, 2005). The lack of effect of chABC on the diffusion of TMA+ confirms that small monovalent cations do not interact significantly with CS in the presence of the normal ionic environment of the brain ECS.
Values of D*Ca and λCa in brain
The values of in the neocortex and stratum radiatum of the hippocampus were 2.26 × 10⁻⁶ cm2 s−1 and 2.16 × 10⁻⁶ cm2 s−1, respectively, and they were not significantly different, so the corresponding values of λCa in the two regions were also not significantly different; the respective values were 2.05 and 2.10. In contrast, λTMA in the neocortex was 1.64 and in the hippocampus it was 1.49 and these values are typical of λTMA measured in many brain regions in normal tissue (Syková & Nicholson, 2008). Thus the value of λCa is markedly greater than λTMA in both regions and this may be interpreted as meaning that the diffusion of Ca2+ is more hindered or slowed than the classic monovalent probe ion TMA+. It is worth noting that the present study shows that the value of λTMA in the hippocampus is less than that in the neocortex and this difference has been reported previously (Hrabětová, 2005). This regional difference, however, is not seen in λCa.
The values of λCa measured by Nicholson & Rice (1987) in the rat neocortex, estimated again using the more accurate value of DCa obtained in this study, were similar to those of λTMA and not as high as the present values. The earlier studies, however, were based on a small data set and used an earlier, less sophisticated, version of the RTP analysis method.
Change of D*Ca and λCa brought about by chABC
The application of chABC brings about an increase in in both the neocortex and hippocampus and corresponding fall in λCa. Interestingly, λCa is reduced to 1.86 in the neocortex and 1.75 in the hippocampus and these differences are statistically significant. Thus the distinction between regions seen in λTMA begins to manifest itself in λCa (Fig. 6). This suggests that the elevated tortuosity measured with Ca2+ may be dominated by the hindrance imposed by CS but this effect is more pronounced in hippocampus possibly suggesting larger quantities of CS glycan in the ECS of this brain region.
Figure 6. Comparison of λCa and λTMA in neocortex and hippocampus of brain slices before (Control) and after treatment with chABC (Chondroitinase).

Although λCa drops below control values after chABC application, it remains elevated above λTMA. *P < 0.001, t test.
It is noteworthy that even after chABC treatment of both brain regions, λCa calculated for chABC-treated slices (Table 1; Fig. 6) was significantly higher than λTMA implying that Ca2+ may continue to interact with other components of the ECM such as HA and HSPG, although chABC also may cleave HA (Lin et al. 2008). It is possible also that not all the extracellular CS is removed in the treated tissue. Furthermore, heparan sulphate may be expected to have a higher charge density than CS (Comper & Laurent, 1978) so any HSPG in the ECS may interact with Ca2+ even more strongly than CSPG and HSPG is not cleaved by chABC. Jenkins & Bachelard (1988) established the presence of HSPG in brain tissue and a recent diffusion study (Thorne et al. 2008) using lactoferrin confirmed the presence of HSPGs in the ECS of rat neocortex.
Mechanism of interaction of CS with Ca2+
It is thought that mobile cationic counterions associate with the numerous negative charges on polyelectrolyte chains through electrostatic interactions (Daune, 1999). Taking 0.05% CS as a benchmark, the concentration of counterions will typically be about 1.5 mm of Na+ (Magdelénat et al. 1974) and this represents a low ionic strength medium where the counterions tend to remain in the vicinity of the negative charges. When comparable amounts (i.e. a few millimolar) of CaCl2 or other divalent salt are added to such a polyelectrolyte solution, the stronger positive charge density on the small divalent ion causes it to be preferentially associated with the negative charges on the polyelectrolyte and Na+ is displaced. The process of ion association and displacement can be described quantitatively by a simplified version of the Poisson–Boltzmann equation, invoking counter-ion condensation, where a critical charge parameter ξ is maintained; this approach has been most extensively developed by Manning (1972, 1979). Magdelénat et al. (1974, 1979) and Parker et al. (1988) have shown that Manning's theory adequately accounts for Na+ and Ca2+ interaction with CS under the low ionic strength regime defined above. In the presence of the 150 mm of added NaCl typically encountered in physiological environments, Manning's theory is no longer applicable and resort must be made to a full Poisson–Boltzmann formulation (Nilsson et al. 1985; Parker et al. 1988; Daune, 1999) with the so-called ‘rod in cell’ model described by Katchalsky (1971) that treats the polyelectrolyte chains as an ensemble of parallel line charges within a cylindrical volume of solvent. Although this approach does predict that the diffusion of monovalent cations will be largely unaffected by polyelectrolytes while divalent cations will see some hindrance in the presence of 150 mm NaCl, it is not wholly satisfactory in its predictions for the behaviour of the mobile co-ions (i.e. Cl−; Parker et al. 1988). Moreover, the assumption that polyelectrolytes form straight rods is based on the repulsive effects of their fixed negative charges; however, this may be questioned because, at the ionic strength in physiological medium, the Debye length associated with a single ionic charge is only about 1 nm (Hille, 2001) which suggests that beyond that distance the electric field generated by an ion is largely screened by counter-ions. Furthermore, we have little idea of the local molecular organization of the GAGs in the ECS, for example there is evidence that CSPGs, HA and tenascin combine to form structures (Yamaguchi, 2000) and pericellular nets harbour a variety of CSPGs and HSPGs as well as HA (Deepa et al. 2006).
We also note that our methods reflect volume-averaged diffusion properties on a relatively macroscopic scale (∼100 μm) whereas variations in the composition of the ECM and in the distribution of Ca2+ sources and sinks on a smaller scale (∼ 1–10 μm) are likely to dominate the relationships between extracellular Ca2+ mobility in some local microenvironments such as the synapse (Rusakov & Fine, 2003).
A further issue concerns the nature of the binding between Ca2+ and CS polyelectrolytes. As noted above, the prevailing concept is that the binding is electrostatic (Daune, 1999) and the bound cations only spend a brief time in the vicinity of the fixed negative charges (Preston et al. 1983). It is possible, however, that there are preferred sites on the CS chains that involve additional steric interaction (Rodríguez-Carvajal et al. 2003) or that Ca2+ may be involved in linking together ECM matrix proteins (Diao & Tajkhorshid, 2008). Finally, it has been recognized that when CS becomes sufficiently concentrated, the main impediment to diffusion of ions is likely to be steric hindrance resulting from the density of the polymers (Parker et al. 1988) that may be described by the original theory of Ogston et al. (1973). For all these reasons it seems premature to attempt any biophysical model to account for our results.
Decomposition of λCa
Although it is not yet appropriate to attempt a detailed theoretical analysis of the origins of hindrance it is still possible to arrive at some semi-quantitative estimates of the different influencing factors by decomposing the tortuosity into several components.
The experiments in neocortex and hippocampus before chABC treatment by definition provide
 |
(13) |
After the chABC treatment, a new value of the effective diffusion coefficient was measured that represents intermediate diffusion properties after the CS component has been removed and that we designate as  . This leads to a new tortuosity:
 |
(14) |
Finally, because λI is greater than the tortuosity value, λTMA, obtained with TMA, we believe that Ca2+ continues to interact with residual charge groups that do not influence TMA+ at this ionic strength and so we postulate that, if these groups were removed, we could measure a basic effective diffusion coefficient with Ca2+,  and its corresponding tortuosity
 |
(15) |
This leads to a formal decomposition of λCa
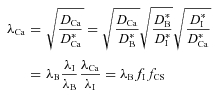 |
(16) |
that amounts to saying that the basic tortuosity λB is multiplied by two factors fI and fCS that account for the influence of the residual charge interaction and the specific CS components, respectively. In terms of the reaction constant R defined in eqn (2), it follows from eqn (4) and eqn (16) that
| (17) |
The factors in eqn (16) and eqn (17) can be calculated from the ratios of measured tortuosities provided that λB is known. We can achieve this if we postulate that the basic tortuosity measured with Ca2+, assuming we were able to make that measurement, would be the same as that measured with TMA+ i.e. we postulate that  .
.
Using this decomposition we calculate the various components of λCa as shown in Table 3. The results reveal that in the neocortex the intermediate component actually contributes more than the CS component to λCa whereas in the hippocampus the situation is reversed and the CS contribution dominates.
Table 3.
Decomposition of tortuosity into components
| Region | λB=λTMA | fI=λI/λB | fCS=λCa/λI | λCa |
|---|---|---|---|---|
| Neocortex | 1.64 | 1.13 | 1.10 | 2.05 |
| Hippocampus | 1.49 | 1.17 | 1.20 | 2.10 |
Conclusions
We have shown that normal Ca2+ diffusion in the brain ECS is slowed in comparison to that of the monovalent cation TMA+ and this retardation can be reduced through application of the well-characterized enzyme, chABC, to cleave the extracellular matrix glycan CS. The increase in D* was more pronounced in hippocampus (44% change) than in neocortex (20% change). This finding is of physiological importance given the fundamental role of CS and Ca2+ in cell migration, axonal sprouting, regeneration and plasticity (Dityatev & Schachner, 2003; Silver & Miller, 2004; Galtrey & Fawcett, 2007). It is plausible that the interaction with the ECM reduces the flux of Ca2+ available in the synaptic (Nicholson, 1980; Rusakov & Fine, 2003) and dendritic (Egelman & Montague, 1998) microenvironment under normal conditions. We note also that Härtig et al. (1999) suggested that the ECM in pericellular nets might buffer Na+ and K+; it would seem equally, or even better, suited to transiently sequester Ca2+.
Based on our own experiments and several studies in the literature (Magdelénat et al. 1974, 1979; Maroudas et al. 1988; Parker et al. 1988) we think it most likely that the fundamental interaction between the CS and Ca2+ is electrostatic but an adequate quantitative theory applicable to the fairly high ionic strength (150 mm NaCl) in brain ECS is lacking. There are, however, well-documented precedents for a charge-based interaction between transported molecules and the microenvironment in cartilage (Maroudas, 1970; Comper & Laurent, 1978) and in the glycocalyx surface layer on capillary endothelial cells (Stace & Damiano, 2001).
This is the first study to quantify the diffusion of divalent and monovalent cations when a component of the brain ECM is selectively manipulated. It should be emphasized that both the diffusion measurements and enzymatic cleavage were done in the living tissue and thus the data reflect the situation in the interstitial compartment rather than a tissue homogenate. Importantly, our control measurements show that this enzymatic treatment does not affect ECS geometry as defined by the volume fraction and tortuosity measured by the well-characterized small monovalent cation TMA+. By combining the quantitative measurements of the effective diffusion coefficients of Ca2+ and TMA+ before and after chABC treatment we can arrive at a decomposition of the respective tortuosities that provides a semi-quantitative estimate of the influence of the various factors.
Our study prompts many intriguing questions about the role of diffusion of calcium in the ECS. Notably the nature of interactions with the ECM in the developing brain when the composition and quantity of the ECM is different (Bandtlow & Zimmermann, 2000), as well as under pathological conditions when, for example, CS proteoglycans are overproduced and prevent the axonal regeneration after injury (Galtrey & Fawcett, 2007).
Acknowledgments
This work was supported by NIH NINDS grants NS047557 (S.H.) and NS028642 (C.N.). The authors thank Ms Mei Lan Chao from the laboratory of Professor Margaret Rice at NYU School of Medicine for performing the immunohistochemistry.
Glossary
Abbreviations
- ACSF
artificial cerebrospinal fluid
- AF
Alexa Fluor 488
- BSA
bovine serum albumin
- chABC
chondroitinase ABC
- CS
chondroitin sulphate
- CSPG
chondroitin sulphate proteoglycan
- DIC
differential interference contrast
- ECM
extracellular matrix
- ECS
extracellular space
- GAG
glycosaminoglycan
- HA
hyaluronan
- HNK
human natural killer
- HS
heparan sulphate
- HSPG
heparan sulphate proteoglycan
- IOI
integrative optical imaging
- ISM
ion-selective microelectrode
- RTI
real-time iontophoresis
- RTP
real-time pressure
- TMA
tetramethylammonium
Appendix
This Appendix will outline the effect of slice boundaries on the diffusion analysis and provide a confirmatory demonstration for the existence of rapid equilibrium binding.
Effect of slice boundaries on analysis
The size of a typical injection volume prompts the question of whether the proximity of the slice boundaries will have any influence on the diffusion analysis. Both the injection and the measuring micropipettes were placed 200 μm below the slice surface and separated by at least 100 μm. Solution flowed over both surfaces and under ideal conditions it may be assumed that the surface concentrations were clamped at the concentration of the bathing medium, which was 1.5 mm for Ca2+. This is equivalent to assuming that any released molecule that reached the slice surfaces was absorbed and can be modelled using an image procedure (Carslaw & Jaeger, 1959, Section 10.10).
Considering only one surface for simplicity (and it will be shown that this is adequate) and representing the slice as a semi-infinite medium with an absorbing boundary and a single finite spherical source (Fig. 7A, left diagram) this can be replaced by an infinite medium with the same source together with a sink of equal and opposite magnitude and geometry reflected in the plane defined by the previous boundary (Fig. 7A, right diagram). This type of analysis was described for the RTI method and a point source by Hrabětová & Nicholson (2007). In the present study the analysis was applied to a finite volume source and the RTP method. The actual concentration measured by the ISM is represented by the contribution of the source minus the contribution of the sink using eqn (7) to calculate the two contributions with appropriate distances to the measuring location (Fig. 7A, right diagram). It is easy to see that if a measurement is made anywhere on the plane defining the original boundary then the two contributions will cancel and any released molecule will be effectively absorbed at that location, fulfilling the original boundary condition.
We took average values representing the parameters obtained under four sets of conditions: neocortex control and treated, hippocampus control and treated. We computed diffusion curves in an infinite medium with a single source, as defined in eqn (7) and with an absorbing boundary condition at the surface of the slice, using the image method. The release and recording electrodes were at a depth of 200 μm spaced apart between 110 and 130 μm, as described above. The resulting eight theoretical records were then analysed with the same program (Walter) that we use to analyse the experimental data. The infinite media data of course resulted in the same fitting parameters as those used to compute them. In the records simulating absorbing boundaries the fits were also very good and the errors in λ never exceeded 6% while the error in b never exceeded 1 μm. An example of two such curves, based on average values obtained in control cortex experiments, is shown in Fig. 7B. It is seen that the effect of the boundary is to reduce the amplitude of the late falling phase of the curve; this may be accounted for by the fact that as time goes by an increasing number of molecules reach the boundary and are absorbed and so do not arrive at the measuring location. These calculations indicate that the boundary has negligible effect for these electrode configurations (a similar result was obtained in the TMA iontophoresis calculations by Hrabětová & Nicholson (2007)). Because the effect of a single boundary is negligible, the addition of a second, lower, boundary would also be negligible. In practice the boundaries would not be perfectly absorbing but would have a stagnant layer of solution several tens of micrometres thick, further reducing any error.
The lack of significant effect of the boundary was further substantiated in experiments where we made dual measurement of λCa and λTMA with the RTP method. The micropipette used for Ca2+ injection was always filled with 20 mm CaCl2 (but the effective concentration was 18 mm, see Methods), 20 mm TMA-chloride and 100 mm NaCl. In these experiments, using untreated slices from two animals, separate ISMs for Ca2+ and TMA+ were used to measure simultaneously the diffusion of both ions (Fig. 7C). These experiments gave average values for neocortex λCa= 1.98 (n= 7), λTMA= 1.63 (n= 8) and for hippocampus λCa= 2.13 (n= 12), λTMA= 1.45 (n= 16). These experiments showed that the RTP method used with TMA+ gave similar λ-values to those obtained with the RTI method (Table 2) while simultaneously returning λ-values for Ca2+ that agreed with the values measured with the rest of the RTP data (Table 1). These measurements provided an additional test because the TMA+-ISM was often as much as 200 μm from the injection micropipette, which would have accentuated any boundary effect. Additionally, these dual-measurement data show that λTMA measured with the RTP method in the presence of diffusing Ca2+ is similar to that obtained for TMA+ with the RTI method, when no excess Ca2+ is present, confirming the results obtained with the IOI techniques as described in Methods. Because of the difficulty of these dual experiments we did not attempt them on a regular basis and so the sample is too small to include as paired data in the main results, although the individual data are part of the included data set and will be mentioned again below.
In order to better understand the lack of influence of both the boundary and the Ca2+ injection on the analysis it is instructive to compute the spatial profile of Ca2+ to visualize the evolution of the profiles at different times. These are shown in Fig. 7D, where the computation was based on eqn (7) and employed the same parameters as those used in Fig. 7B. The main point is that the initial concentration of Ca2+ decays very quickly as the ion diffuses out in 3-D space so that the exposure of the tissue to substantially elevated Ca2+ is dissipated within seconds. This may largely account for the results discussed above and for the lack of effect of added Ca2+ in the IOI test experiments outlined in Methods. Note that in practice, many injections were smaller in volume than those modelled in Fig. 7D.
Confirmatory demonstration for rapid equilibrium binding
As noted above we did some experiments where we made dual Ca2+/TMA+ measurements (Fig. 7C). In these experiments the same volume of each ion was injected and the Ca2+ diffusion curve would be weighted by a factor 1/(R+ 1), from the definition of given in eqn (5), while the TMA+ curve would not. By eliminating the common initial volume (represented by the radius of injection b) between these two measurements R should be recoverable. In its simplest form this comparison would utilize eqn (11). This equation does not involve the effective diffusion coefficient but is based only on the maximum concentrations (subscript ‘max’), injected concentrations (subscript ‘f’) and distances (r). This assumes that non-specific loss was a negligible factor, which is true for the early part of the curve and that the point-source approximation is reasonable. Let Cf, Cmax, rc all refer to Ca2+ and Mf, Mmax, rm refer to TMA+ then it follows that
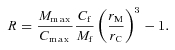 |
(18) |
Based on experiments in two animals using both Ca2+- and TMA+-selective ISMs, with n records we obtained for neocortex:R= 0.97 ± 0.45 (mean ±s.d., n= 6) and for hippocampus R= 0.88 ± 0.39 (n= 7). The large s.d.s reflect both the limited data and the inherent errors in this approach but the results still serve as a useful corroborative demonstration.
Because these estimates are independent of estimates based on the effective diffusion coefficient, we can use the latter data to also obtain values for R, using eqn (17) and the data in Table 3 to obtain R= 0.55 for neocortex and R= 0.96 for hippocampus.
We conclude that the similarities of these two sets of independent values are consistent with the hypothesis of fast reversible binding. We note the caveat that this comparison assumes that all the reduction in , compared to the diffusion of TMA+, is caused by fast reversible binding; our study shows that a component of the reduction can be ascribed to the presence of CS, for which such binding kinetics are plausible. There is an additional component that also probably originates in other constituents of the extracellular matrix but that remains to be established.
Author contributions
S.H. and C.N. conceived and designed the project and wrote the paper, S.H., D.M., L.T. and F.X. conducted the experiments and analysed data. All authors participated in the interpretation of the data, revised the article and approved the final version for publication. The RTP and RTI experiments were done in the Department of Physiology, New York University School of Medicine, 550 First Avenue, New York, NY 10016, USA and the IOI experiments were done in the Department of Anatomy and Cell Biology, The Robert F. Furchgott Center for Neural and Behavioral Science, SUNY Downstate Medical Center, Brooklyn, NY, USA.
References
- Aquino DA, Margolis RU, Margolis RK. Immunocytochemical localization of a chondroitin sulfate proteoglycan in nervous tissue. I. Adult brain, retina, and peripheral nerve. J Cell Biol. 1984;99:1117–1129. doi: 10.1083/jcb.99.3.1117. [DOI] [PMC free article] [PubMed] [Google Scholar]
- Bandtlow CE, Zimmermann DR. Proteoglycans in the developing brain: new conceptual insights for old proteins. Physiol Rev. 2000;80:1267–1290. doi: 10.1152/physrev.2000.80.4.1267. [DOI] [PubMed] [Google Scholar]
- Bathe M, Rutledge GC, Grodzinsky AJ, Tidor B. Osmotic pressure of aqueous chondroitin sulfate solution: a molecular modeling investigation. Biophys J. 2005;89:2357–2371. doi: 10.1529/biophysj.105.067918. [DOI] [PMC free article] [PubMed] [Google Scholar]
- Benson GC, Gordon AR. The conductance of aqueous solutions of calcium chloride at temperatures from 15° to 45°. J Chem Phys. 1945;13:470–472. [Google Scholar]
- Borst JG, Sakmann B. Depletion of calcium in the synaptic cleft of a calyx-type synapse in the rat brainstem. J Physiol. 1999;521:123–133. doi: 10.1111/j.1469-7793.1999.00123.x. [DOI] [PMC free article] [PubMed] [Google Scholar]
- Brückner G, Brauer K, Härtwig W, Wolff JR, Rickmann MJ, Derouiche A, Delpech B, Girard N, Oertel WH, Reichenbach A. Perineuronal nets provide a polyanionic, glia-associated form of microenvironment around certain neurons in many parts of the rat brain. Glia. 1993;8:183–200. doi: 10.1002/glia.440080306. [DOI] [PubMed] [Google Scholar]
- Brückner G, Bringmann A, Härtwig W, Köppe G, Delpech B, Brauer K. Acute and long-lasting changes in extracellular-matrix chondroitin-sulphate proteoglycans induced by injection of chondroitinase ABC in the adult rat brain. Exp Brain Res. 1998;121:300–310. doi: 10.1007/s002210050463. [DOI] [PubMed] [Google Scholar]
- Bukalo O, Schachner M, Dityatev A. Modification of extracellular matrix by enzymatic removal of chondroitin sulfate and by lack of tenascin-R differentially affects several forms of synaptic plasticity in the hippocampus. Neuroscience. 2001;104:359–369. doi: 10.1016/s0306-4522(01)00082-3. [DOI] [PubMed] [Google Scholar]
- Caterson B, Christner JE, Baker JR, Couchman JR. Production and characterization of monoclonal antibodies directed against connective tissue proteoglycans. Fed Proc. 1985;44:386–393. [PubMed] [Google Scholar]
- Carslaw HS, Jaeger JC. Conduction of Heat in Solids. 2nd edn. Oxford: Clarendon Press; 1959. [Google Scholar]
- Comper WD, Laurent TC. Physiological function of connective tissue polysaccharides. Physiol Rev. 1978;58:255–315. doi: 10.1152/physrev.1978.58.1.255. [DOI] [PubMed] [Google Scholar]
- Crank J. The Mathematics of Diffusion. 2nd edn. Oxford: Clarendon Press; 1975. [Google Scholar]
- Crespo D, Asher RA, Lin R, Rhodes KE, Fawcett JW. How does chondroitinase promote functional recovery in the damaged CNS? Exp Neurol. 2007;206:159–171. doi: 10.1016/j.expneurol.2007.05.001. [DOI] [PubMed] [Google Scholar]
- Cussler EL. Diffusion. Mass Transfer in Fluid Systems. 3rd edn. Cambridge: Cambridge University Press; 2009. [Google Scholar]
- Daune M. Molecular Biophysics. Oxford: Oxford University Press; 1999. [Google Scholar]
- Deepa SS, Carulli D, Galtrey C, Rhodes K, Fukuda J, Mikami T, Sugahara K, Fawcett JW. Composition of perineuronal net extracellular matrix in rat brain: a different disaccharide composition for the net-associated proteoglycans. J Biol Chem. 2006;281:17789–17800. doi: 10.1074/jbc.M600544200. [DOI] [PubMed] [Google Scholar]
- Diao J, Tajkhorshid E. Indirect role of Ca2+ in the assembly of extracellular matrix proteins. Biophys J. 2008;95:120–127. doi: 10.1529/biophysj.108.129106. [DOI] [PMC free article] [PubMed] [Google Scholar]
- Dityatev A, Schachner M. Extracellular matrix molecules and synaptic plasticity. Nat Rev Neurosci. 2003;4:456–468. doi: 10.1038/nrn1115. [DOI] [PubMed] [Google Scholar]
- Egelman DM, Montague PR. Computational properties of peri-dendritic calcium fluctuations. J Neurosci. 1998;18:8580–8589. doi: 10.1523/JNEUROSCI.18-21-08580.1998. [DOI] [PMC free article] [PubMed] [Google Scholar]
- Egelman DM, Montague PR. Calcium dynamics in the extracellular space of mammalian neural tissue. Biophys J. 1999;76:1856–1867. doi: 10.1016/s0006-3495(99)77345-5. [DOI] [PMC free article] [PubMed] [Google Scholar]
- Galtrey CM, Fawcett JW. The role of chondroitin sulfate proteoglycans in regeneration and plasticity in the central nervous system. Brain Res Rev. 2007;54:1–18. doi: 10.1016/j.brainresrev.2006.09.006. [DOI] [PubMed] [Google Scholar]
- Härtig W, Derouiche A, Welt K, Brauer K, Grosche J, Mäder M, Reichenbach A, Brückner G. Cortical neurons immunoreactive for the potassium channel Kv3.1b subunit are predominantly surrounded by perineuronal nets presumed as a buffering system for cations. Brain Res. 1999;842:15–29. doi: 10.1016/s0006-8993(99)01784-9. [DOI] [PubMed] [Google Scholar]
- Heinemann U, Lux HD, Gutnick MJ. Extracellular free calcium and potassium during paroxysmal activity in the cerebral cortex of the cat. Exp Brain Res. 1977;27:237–243. doi: 10.1007/BF00235500. [DOI] [PubMed] [Google Scholar]
- Hille B. Ionic Channels of Excitable Membranes. 3rd edn. Sunderland, MA, USA: Sinauer Associates; 2001. [Google Scholar]
- Hrabětová S. Extracellular diffusion is fast and isotropic in the stratum radiatum of hippocampal CA1 region in rat brain slices. Hippocampus. 2005;15:441–450. doi: 10.1002/hipo.20068. [DOI] [PubMed] [Google Scholar]
- Hrabětová S, Nicholson C. Biophysical properties of brain extracellular space explored with ion-selective microelectrodes, integrative optical imaging and related techniques. In: Michael AC, Borland LM, editors. Electrochemical Methods for Neuroscience. Boca Raton: CRC Press, Taylor Francis Group; 2007. pp. 167–204. [PubMed] [Google Scholar]
- Jenkins HG, Bachelard HS. Developmental and age-related changes in rat brain glycosaminoglycans. J Neurochem. 1988;51:1634–1640. doi: 10.1111/j.1471-4159.1988.tb01134.x. [DOI] [PubMed] [Google Scholar]
- Katchalsky A. Polyelectrolytes. Pure Appl Chem. 1971;26:327–373. [Google Scholar]
- Katzman R, Pappius HM. Brain Electrolytes and Fluid Metabolism. Baltimore: Williams & Wilkins; 1973. [Google Scholar]
- Kaur G, Hrabětová S, Guilfoyle DN, Nicholson C, Hrabe J. Characterizing molecular probes for diffusion measurements in the brain. J Neurosci Methods. 2008;171:218–225. doi: 10.1016/j.jneumeth.2008.03.007. [DOI] [PMC free article] [PubMed] [Google Scholar]
- Kume-Kick J, Mazel T, Voříšek I, Hrabětová S, Tao L, Nicholson C. Independence of extracellular tortuosity and volume fraction during osmotic challenge in rat neocortex. J Physiol. 2002;542:515–527. doi: 10.1113/jphysiol.2002.017541. [DOI] [PMC free article] [PubMed] [Google Scholar]
- Lanter F, Steiner RA, Ammann D, Simon W. Critical evaluation of the applicability of neutral carrier-based calcium selective microelectrodes. Anal Chim Acta. 1982;135:51–59. [Google Scholar]
- Lehmenkühler A, Syková E, Svoboda J, Zilles K, Nicholson C. Extracellular space parameters in the rat neocortex and subcortical white matter during postnatal development determined by diffusion analysis. Neuroscience. 1993;55:339–351. doi: 10.1016/0306-4522(93)90503-8. [DOI] [PubMed] [Google Scholar]
- Lin R, Kwok JC, Crespo D, Fawcett JW. Chondroitinase ABC has a long-lasting effect on chondroitin sulphate glycosaminoglycan content in the injured rat brain. J Neurochem. 2008;104:400–408. doi: 10.1111/j.1471-4159.2007.05066.x. [DOI] [PubMed] [Google Scholar]
- McBain CJ, Traynelis SF, Dingledine R. Regional variation of extracellular space in the hippocampus. Science. 1990;249:674–677. doi: 10.1126/science.2382142. [DOI] [PubMed] [Google Scholar]
- Magdelénat H, Turq P, Chemla M. Study of the self-diffusion coefficients of cations in the presence of an acidic polysaccharide. Biopolymers. 1974;13:1535–1548. doi: 10.1002/bip.1974.360130803. [DOI] [PubMed] [Google Scholar]
- Magdelénat H, Turr P, Tivant P, Chemla M, Menez R, Drifford M. The effect of counter-ion substitution on the transport properties of polyelectrolyte solutions. Biopolymers. 1979;18:187–201. [Google Scholar]
- Manning GS. Polyelectrolytes. Ann Rev Phys Chem. 1972;23:117–140. [Google Scholar]
- Manning GS. Counterion binding in polyelectrolyte theory. Acc Chem Res. 1979;12:443–449. [Google Scholar]
- Maroudas A. Distribution and diffusion of solutes in articular cartilage. Biophys J. 1970;10:365–379. doi: 10.1016/S0006-3495(70)86307-X. [DOI] [PMC free article] [PubMed] [Google Scholar]
- Maroudas A, Weinberg PD, Parker KH, Winlove CP. The distributions and diffusivities of small ions in chondroitin sulphate, hyaluronate and some proteoglycan solutions. Biophys Chem. 1988;32:257–270. doi: 10.1016/0301-4622(88)87012-1. [DOI] [PubMed] [Google Scholar]
- Mazel T, Šimonová Z, Syková E. Diffusion heterogeneity and anisotropy in rat hippocampus. Neuroreport. 1998;9:1299–1304. doi: 10.1097/00001756-199805110-00008. [DOI] [PubMed] [Google Scholar]
- Morris ME, Krnjević K. Slow diffusion of Ca2+ in the rat's hippocampus. Can J Physiol Pharmacol. 1981;59:1022–1025. doi: 10.1139/y81-156. [DOI] [PubMed] [Google Scholar]
- Nicholson C. Modulation of extracellular calcium and its functional implications. Fed Proc. 1980;39:1519–1523. [PubMed] [Google Scholar]
- Nicholson C. Diffusion from an injected volume of a substance in brain tissue with arbitrary volume fraction and tortuosity. Brain Res. 1985;333:325–329. doi: 10.1016/0006-8993(85)91586-0. [DOI] [PubMed] [Google Scholar]
- Nicholson C. Quantitative analysis of extracellular space using the method of TMA+ iontophoresis and the issue of TMA+ uptake. Can J Physiol Pharmacol. 1992;70:S314–S322. doi: 10.1139/y92-278. [DOI] [PubMed] [Google Scholar]
- Nicholson C. Ion-selective microelectrodes and diffusion measurements as tools to explore the brain cell microenvironment. J Neurosci Methods. 1993;48:199–213. doi: 10.1016/0165-0270(93)90092-6. [DOI] [PubMed] [Google Scholar]
- Nicholson C. Diffusion and related transport properties in brain tissue. Rep Prog Phys. 2001;64:815–884. [Google Scholar]
- Nicholson C, Phillips JM. Ion diffusion modified by tortuosity and volume fraction in the extracellular microenvironment of the rat cerebellum. J Physiol. 1981;321:225–257. doi: 10.1113/jphysiol.1981.sp013981. [DOI] [PMC free article] [PubMed] [Google Scholar]
- Nicholson C, Rice ME. Calcium diffusion in the brain cell microenvironment. Can J Physiol Pharmacol. 1987;65:1086–1091. doi: 10.1139/y87-170. [DOI] [PubMed] [Google Scholar]
- Nicholson C, Tao L. Hindered diffusion of high molecular weight compounds in brain extracellular microenvironment measured with integrative optical imaging. Biophys J. 1993;65:2277–2290. doi: 10.1016/S0006-3495(93)81324-9. [DOI] [PMC free article] [PubMed] [Google Scholar]
- Nicholson C, ten Bruggencate G, Steinberg R, Stöckle H. Calcium modulation in brain extracellular microenvironment demonstrated with ion-selective micropipette. Proc Natl Acad Sci U S A. 1977;74:1287–1290. doi: 10.1073/pnas.74.3.1287. [DOI] [PMC free article] [PubMed] [Google Scholar]
- Nilsson LG, Nordenskioeld L, Stilbs P, Braunlin WH. Macroscopic counterion diffusion in solutions of cylindrical polyelectrolytes. J Phys Chem. 1985;89:3385–3391. [Google Scholar]
- Oehme M, Simon W. Microelectrode for K+ based on a neutral carrier and comparison of its characteristics with a cation exchanger sensor. Anal Chim Acta. 1976;86:21–25. [Google Scholar]
- Ogston AG, Preston BN, Wells JD. On the transport of compact particles through solutions of chain-polymers. Proc R Soc Lond A Math Phys Sci. 1973;333:297–316. [Google Scholar]
- Parker KH, Winlove CP, Maroudas A. The theoretical distributions and diffusivities of small ions in chondroitin sulphate and hyaluronate. Biophys Chem. 1988;32:271–282. doi: 10.1016/0301-4622(88)87013-3. [DOI] [PubMed] [Google Scholar]
- Paxinos G, Watson C. The Rat Brain in Stereotaxic Coordinates. 3rd edn. Amsterdam: Academic Press; 1997. [Google Scholar]
- Pérez-Pinzón MA, Tao L, Nicholson C. Extracellular potassium, volume fraction, and tortuosity in rat hippocampal CA1, CA3, and cortical slices during ischemia. J Neurophysiol. 1995;74:565–573. doi: 10.1152/jn.1995.74.2.565. [DOI] [PubMed] [Google Scholar]
- Preston BN, Laurent TC, Comper WD. Transport of molecules in connective tissue polysaccharide solutions. In: Arnott S, Rees DA, Morris ER, editors. Molecular Biophysics of the Extracellular Matrix. Clifton, NJ, USA: Humana Press; 1983. pp. 119–162. [Google Scholar]
- Pumain R. Calcium ions. In: Boulton AA, Baker GB, Walz W, editors. The Neuronal Microenvironment. Clifton, NJ, USA: Humana Press; 1988. pp. 589–650. [Google Scholar]
- Rodriguez-Carvajal MA, Imberty A, Perez S. Conformational behavior of chondroitin and chondroitin sulfate in relation to their physical properties as inferred by molecular modeling. Biopolymers. 2003;69:15–28. doi: 10.1002/bip.10304. [DOI] [PubMed] [Google Scholar]
- Roitbak T, Syková E. Diffusion barriers evoked in the rat cortex by reactive astrogliosis. Glia. 1999;28:40–48. doi: 10.1002/(sici)1098-1136(199910)28:1<40::aid-glia5>3.0.co;2-6. [DOI] [PubMed] [Google Scholar]
- Rusakov DA. The role of perisynaptic glial sheaths in glutamate spillover and extracellular Ca2+ depletion. Biophys J. 2001;81:1947–1959. doi: 10.1016/S0006-3495(01)75846-8. [DOI] [PMC free article] [PubMed] [Google Scholar]
- Rusakov DA, Fine A. Extracellular Ca2+ depletion contributes to fast activity-dependent modulation of synaptic transmission in the brain. Neuron. 2003;37:287–297. doi: 10.1016/s0896-6273(03)00025-4. [DOI] [PMC free article] [PubMed] [Google Scholar]
- Schmitt FO, Samson FE. The brain cell microenvironment. Neurosci Res Prog Bull. 1969;7:277–417. [Google Scholar]
- Schwiening CJ, Thomas RC. Relationship between intracellular calcium and its muffling measured by calcium iontophoresis in snail neurones. J Physiol. 1996;491:621–633. doi: 10.1113/jphysiol.1996.sp021244. [DOI] [PMC free article] [PubMed] [Google Scholar]
- Silver J, Miller JH. Regeneration beyond the glial scar. Nat Rev Neurosci. 2004;5:146–156. doi: 10.1038/nrn1326. [DOI] [PubMed] [Google Scholar]
- Stace TM, Damiano ER. An electrochemical model of the transport of charged molecules through the capillary glycocalyx. Biophys J. 2001;80:1670–1690. doi: 10.1016/S0006-3495(01)76139-5. [DOI] [PMC free article] [PubMed] [Google Scholar]
- Syková E, Nicholson C. Diffusion in brain extracellular space. Physiol Rev. 2008;88:1277–1340. doi: 10.1152/physrev.00027.2007. [DOI] [PMC free article] [PubMed] [Google Scholar]
- Syková E, Voříšek I, Mazel T, Antonova T, Schachner M. Reduced extracellular space in the brain of tenascin-R- and HNK-1-sulphotransferase deficient mice. Eur J Neurosci. 2005;22:1873–1880. doi: 10.1111/j.1460-9568.2005.04375.x. [DOI] [PubMed] [Google Scholar]
- Thorne RG, Lakkaraju A, Rodriguez-Boulan E, Nicholson C. In vivo diffusion of lactoferrin in brain extracellular space is regulated by interactions with heparan sulfate. Proc Natl Acad Sci U S A. 2008;105:8416–8421. doi: 10.1073/pnas.0711345105. [DOI] [PMC free article] [PubMed] [Google Scholar]
- Wang JU. Tracer-diffusion in liquids. IV. Self-diffusion of calcium ion and chloride ion in aqueous calcium chloride solutions. J Am Chem Soc. 1953;75:1769–1770. [Google Scholar]
- Xiao F, Hrabětová S. Enlarged extracellular space of aquaporin-4-deficient mice does not enhance diffusion of Alexa Fluor 488 or dextran polymers. Neuroscience. 2009;161:39–45. doi: 10.1016/j.neuroscience.2009.03.017. [DOI] [PMC free article] [PubMed] [Google Scholar]
- Yamaguchi Y. Lecticans: organizers of the brain extracellular matrix. Cell Mol Life Sci. 2000;57:276–289. doi: 10.1007/PL00000690. [DOI] [PMC free article] [PubMed] [Google Scholar]
- Zheng K, Scimemi A, Rusakov DA. Receptor actions of synaptically released glutamate: The role of transporters on the scale from nanometers to microns. Biophys J. 2008;95:4584–4596. doi: 10.1529/biophysj.108.129874. [DOI] [PMC free article] [PubMed] [Google Scholar]