Abstract
Background and Purpose
Gradient recalled echo MRI (GRE) has been shown to be as accurate as CT for the detection of acute intracerebral hemorrhage (ICH). However, because of the differences in the signal parameter being detected, apparent hemorrhage size is expected to vary by imaging modality, with GRE providing larger volumes attributable to susceptibility effects.
Methods
Image data from patients participating in 3 ICH studies were retrospectively reviewed. Patients with acute ICH were included if (1) concurrent MRI and CT were performed within 72 hours of symptom onset, and (2) each modality was performed within 240 minutes of each other. ICH volumes were calculated using a semiautomated image analysis program. The least squares method was used to develop a conversion equation based on a linear regression of GRE volume on CT volume.
Results
Thirty-six patients met inclusion criteria. MRI was performed first in 18, CT first in 18. Mean hemorrhage volume was 25.2cc (range 0.1 to 83.9cc) on CT and 32.7cc (range 0.1 to 98.7cc) measured on GRE. A linear relationship defined by CT Volume=GRE Volume*0.8 (Spearman’s correlation coefficient=0.992, P<0.001) was derived.
Conclusions
Acute ICH volumes as measured on GRE pulse sequences are consistently larger than CT volumes. A simple mathematical conversion model has been developed: CT volume=0.8*GRE volume. This formula can be used in studies using both imaging modalities, across different studies, or to track ICH growth over time independent of imaging modality in an individual patient.
Keywords: intracerebral hemorrhage, MRI, CT
Despite promising therapeutic approaches, intracerebral hemorrhage (ICH) remains a devastating disease treated predominantly with supportive therapy.1 Initial hematoma size and hematoma growth on imaging are predictors of morbidity and mortality.2 Although computed tomography (CT) has traditionally been the standard of care for assessing acute ICH, MRI is increasingly being advocated as a comprehensive multimodal imaging approach for patients presenting with acute stroke symptoms.3–5 Patients frequently undergo both MRI and CT scanning as part of routine clinical care and research protocols. However, gradient recalled echo (GRE) MRI is known to overestimate hematoma volume because of susceptibility effects.6 The objective of this study is to provide a quantitative assessment of the relationship between the volume of the hemorrhage identified by each modality.
Methods
A retrospective analysis was performed using eligible patients enrolled in 3 ICH research protocols: the Hemorrhage and Early MRI Evaluation (HEME) study, the HEME Surgery trial, and the NIH ICH natural history study. These studies encompass 3 centers (The National Institutes of Health Stroke Center at Suburban Hospital, The National Institutes of Health Stroke Program at Washington Hospital Center, and UCLA Medical Center).
Specific inclusion criteria for the current analysis were: (1) diagnosis of primary intracerebral hemorrhage with both a gradient echo MRI and CT performed within 72 hours of admission and before any acute interventions, (2) both scans performed within 240 minutes of each other, and (3) no clinical deterioration between scans. Demographic and imaging data were reviewed. Order of scans and interval were recorded.
MR images were acquired using a Gradient Recalled Echo pulse sequence on a mixture of 1.5T and 3T systems with a representative range of parameters. Gradient echo MRI parameters were similar at all 3 centers and were designed to replicate those used for the HEME study.3 Typical imaging parameters included 7-mm slices, 256×192 matrix, and 24-cm field of view. Echo times varied between 15 and 20 milliseconds, whereas flip angle varied from 30° to 45°. CT images were acquired with 5-mm thickness.
Two of the authors (C.K. and R.B.) concurrently reviewed blinded and randomly ordered CT or GRE images. Regions of interest (ROIs) on each slice within each volume were identified using semiautomated image segmentation tools (Cheshire, Perceptive Informatics, Inc) on each slice within each volume. Perihematomal edema, chronic hemorrhages, microbleeds, and areas of intraventricular hemorrhage were manually excluded.
A linear regression using the least squares method and zero intercept was performed to analytically generate the equation governing the relationship between CT and GRE volumes.
Results
A total of 36 patients met inclusion criteria. Mean age was 64 (range 36 to 88). Median time from symptom onset to first scan was 150 minutes (range 23 to 835), and the median time difference between scans was 69 minutes (range 14 to 240). Eighteen patients had MRI performed before CT, 18 patients had CT performed before MRI. Mean hemorrhage volume was 25.2cc (range 0.1 to 83.9cc) on CT and 32.7cc (range 0.1 to 98.7cc) on GRE.
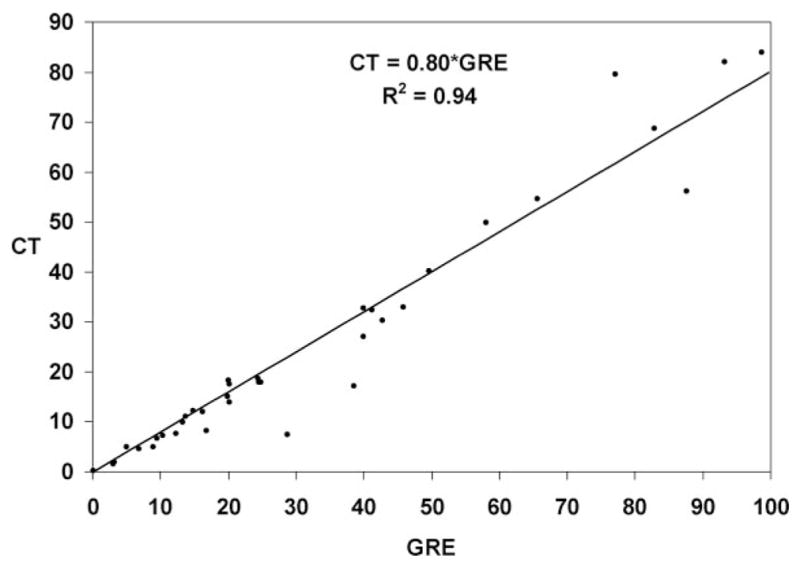
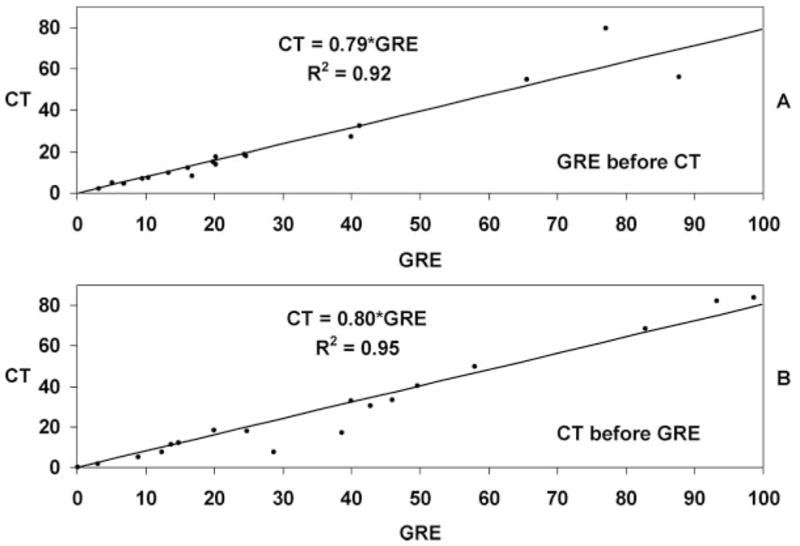
A linear relationship defined by CT volume=GRE volume× 0.8 (Spearman correlation coefficient=0.992, P<0.001) was derived from the dataset as seen in Figure 1. The calculated mean volume was significantly correlated with measured mean volume (Spearman correlation coefficient=0.978, P<0.001). Subgroup analysis of the relationship between CT and GRE volumes for only the group of patients who received the CT after the MRI and conversely that subset receiving the CT before the MRI both confirmed the 0.8 multiplier as seen in Figure 2. To further assess the effects of order and timing of scans on the difference in apparent volume, time between scans was added as an additional regression parameter for both cases of ordering. There was no linear relationship between the ratio of GRE and CT volumes and the intrascan duration for either the CT before GRE (R2=0.1337) or GRE before CT (R2=0.01) subsets.
Figure 1.

Fitted linear regression of hemorrhage volume measured with CT vs GRE.
Figure 2.

Refitted linear regression of hemorrhage volumes after the data has been divided into 2 parts showing patients imaged first with GRE in part A (regression coefficient=0.79), and patients imaged first with CT in part B (regression coefficient=0.80).
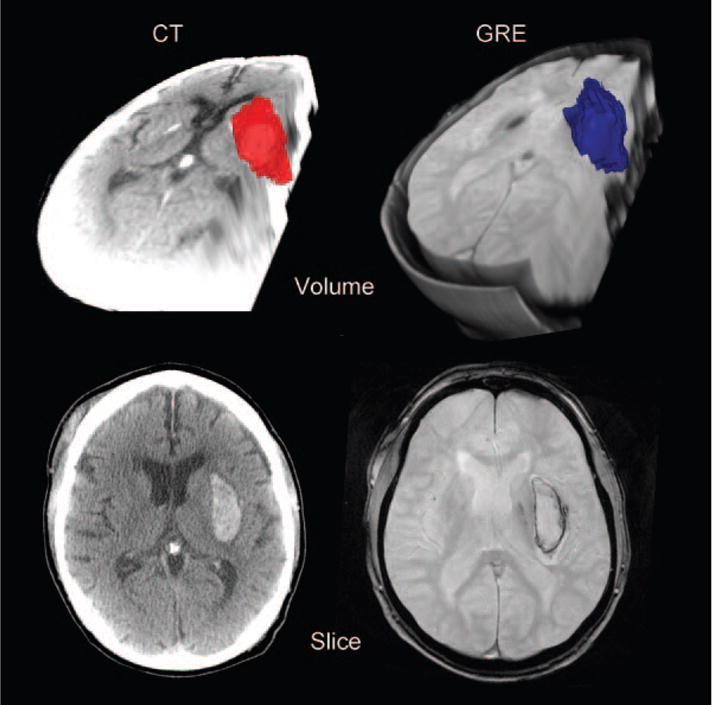
An illustrative example is provided in Figure 3 showing the MRI and CT volumes in 3 dimensions and in cross section.
Figure 3.

Representative images from one patient showing CT data in the left column, GRE on the right. The bottom row shows a single slice through the hemorrhage, whereas the top row shows a volume reconstruction.
Discussion
Robust comparison of hematoma size between scanning modalities (GRE MRI versus CT) is essential. This is important on an individual patient level because hematoma size correlates with prognosis and hematoma growth is associated with early neurological deterioration and poor outcome.2,7,8 For research studies, a conversion method would allow greater flexibility in imaging and allow for pooling or comparing data.
However, the apparent size of hemorrhage lesions on MRI and CT are not expected to be equal because of the underlying detector technology. We postulated that the relationship between hematoma volumes between modalities could be described by mathematical model. CT uses concatenated X-ray projections and a back-projection reconstruction algorithm to generate image slices. MRI relies on carefully shaped magnetic field gradients to spatially encode proton relaxation characteristics. The blood-sensitive gradient echo MRI (GRE) pulse sequences detect the paramagnetic effects of blood and blood breakdown products such as deoxyhemoglobin and hemosiderin. The presence of blood and blood products produces a strong highly nonlinear spatial gradient in the magnetic field because of the paramagnetic susceptibility of these materials. The induced gradient is so large that the magnetic field is not uniform within individual voxels, and this leads to profound signal loss in the affected voxels because of incoherent evolution of the proton spins within the voxels (dephasing) during the TE period in a GRE pulse sequence. The magnetic distortion produced by the blood products is distributed over space, and therefore tissue regions that lie beyond the actual hematoma surface can be affected. Accordingly MRI tends to overestimate the actual size of a hematoma.
Previous studies have demonstrated the resulting overestimation of hematoma size on MRI as compared to CT. Schellinger and colleagues examined 9 ICH patients within 6 hours of symptom onset.6 They noted an average CT volume 0.82 times that found on MRI. Our data closely confirm this finding but strengthen the inference by encompassing a larger number of patients, a tighter interscan duration, a broader range of imaging parameters, and variable modality order. Confining our study to clinically stable patients reduced confounding by hemorrhage growth, as demonstrated by the uniform findings among the CT first and the MR first patient subgroups.
It is likely that differences in MRI characteristics, including field strength, slice thickness, and sequence parameters might impact the findings. For example, higher field strength may contribute to greater blooming artifact. However, because of small sample size, it is beyond the scope of this study to further analyze these factors. Because our study included a heterogeneous population in these regards, it is reassuring that the results are so robust.
In summary, we have demonstrated that acute intracerebral hemorrhage volumes as measured on GRE pulse sequences are consistently larger than CT volumes and that a simple mathematical model can be used to convert volumetric measures from one modality to the other: CT volume=0.8*GRE volume. This formula can be applied in studies using both imaging modalities, across different studies, or to track ICH growth over time independent of imaging modality in an individual patient.
Acknowledgments
The authors would like to acknowledge Kyle Singleton, BS, for his help in creating Figure 3.
Sources of Funding
The Division of Intramural Research of the National Institutes of Health and the National Institute of Neurological Disorders and Stroke supported this research. In addition this work was supported by a grant from the Division of Extramural Research of the National Institutes of Health: P50-NS044378 (to J.R.A., P.V., N.M., J.L.S., C.S.K.).
Footnotes
Disclosures
None.
References
- 1.Mayer SA, Brun NC, Begtrup K, Broderick J, Davis S, Diringer MN, Skolnick BE, Steiner T. Recombinant activated factor vii for acute intracerebral hemorrhage. N Engl J Med. 2005;352:777–785. doi: 10.1056/NEJMoa042991. [DOI] [PubMed] [Google Scholar]
- 2.Davis SM, Broderick J, Hennerici M, Brun NC, Diringer MN, Mayer SA, Begtrup K, Steiner T. Hematoma growth is a determinant of mortality and poor outcome after intracerebral hemorrhage. Neurology. 2006;66:1175–1181. doi: 10.1212/01.wnl.0000208408.98482.99. [DOI] [PubMed] [Google Scholar]
- 3.Kidwell CS, Chalela JA, Saver JL, Starkman S, Hill MD, Demchuk AM, Butman JA, Patronas N, Alger JR, Latour LL, Luby ML, Baird AE, Leary MC, Tremwel M, Ovbiagele B, Fredieu A, Suzuki S, Villablanca JP, Davis S, Dunn B, Todd JW, Ezzeddine MA, Haymore J, Lynch JK, Davis L, Warach S. Comparison of mri and ct for detection of acute intracerebral hemorrhage. JAMA. 2004;292:1823–1830. doi: 10.1001/jama.292.15.1823. [DOI] [PubMed] [Google Scholar]
- 4.Fiebach JB, Schellinger PD, Jansen O, Meyer M, Wilde P, Bender J, Schramm P, Juttler E, Oehler J, Hartmann M, Hahnel S, Knauth M, Hacke W, Sartor K. Ct and diffusion-weighted mr imaging in randomized order: Diffusion-weighted imaging results in higher accuracy and lower interrater variability in the diagnosis of hyperacute ischemic stroke. Stroke. 2002;33:2206–2210. doi: 10.1161/01.str.0000026864.20339.cb. [DOI] [PubMed] [Google Scholar]
- 5.Chalela JA, Kidwell CS, Nentwich LM, Luby M, Butman JA, Demchuk AM, Hill MD, Patronas N, Latour L, Warach S. Magnetic resonance imaging and computed tomography in emergency assessment of patients with suspected acute stroke: A prospective comparison. Lancet. 2007;369:293–298. doi: 10.1016/S0140-6736(07)60151-2. [DOI] [PMC free article] [PubMed] [Google Scholar]
- 6.Schellinger PD, Jansen O, Fiebach JB, Hacke W, Sartor K. A standardized mri stroke protocol: Comparison with ct in hyperacute intracerebral hemorrhage. Stroke. 1999;30:765–768. doi: 10.1161/01.str.30.4.765. [DOI] [PubMed] [Google Scholar]
- 7.Broderick JP, Brott TG, Duldner JE, Tomsick T, Huster G. Volume of intracerebral hemorrhage. A powerful and easy-to-use predictor of 30-day mortality. Stroke. 1993;24:987–993. doi: 10.1161/01.str.24.7.987. [DOI] [PubMed] [Google Scholar]
- 8.Mayer SA, Sacco RL, Shi T, Mohr JP. Neurologic deterioration in noncomatose patients with supratentorial intracerebral hemorrhage. Neurology. 1994;44:1379–1384. doi: 10.1212/wnl.44.8.1379. [DOI] [PubMed] [Google Scholar]


