

Abstract
Purpose
To identify the best combination of Stratus optical coherence tomography (OCT) retinal nerve fiber layer (RNFL) thickness parameters for the detection of glaucoma.
Design
Observational cross-sectional study.
Participants
Eighty-nine age-matched normal and perimetric glaucoma participants enrolled in the Advanced Imaging for Glaucoma Study.
Methods
The Zeiss Stratus OCT system was used to obtain the circumpapillary RNFL thickness in both eyes of each participant. Right and left eye clock-hour data are analyzed together, assuming mirror-image symmetry. The RNFL diagnostic parameters were combined using either or-logic or and-logic approaches.
Main Outcome Measures
Area under the receiver operating characteristic curve (AROC), sensitivity, and specificity are used to evaluate diagnostic performance.
Results
Overall average RNFL thickness has the highest AROC value (0.89) of all single parameters evaluated, followed by the inferior and superior quadrants (0.88 and 0.86, respectively). The clock hours with the best AROC values are in the inferior and superior quadrants. The highest AROC (0.92) was achieved by the or-logic combination of overall, inferior, and superior quadrant RNFL thicknesses. The 3-parameter combination was significantly better than the overall average alone (P = 0.01) The addition of more quadrants or clock hours to the combination reduced diagnostic performance.
Conclusions
The best stand-alone diagnostic strategy for Stratus OCT RNFL data is to classify an eye as glaucomatous if the overall, inferior quadrant, or superior quadrant RNFL thickness average is below normal.
Glaucoma is an optic neuropathy characterized by irreversible loss of neural tissue and visual field (VF). Currently, definitive glaucoma diagnosis is based on VF testing. However, between 30% and 50% of the ganglion cells may be lost before abnormalities appear in perimetric testing.1,2 Another standard glaucoma diagnostic method is the detection of optic nerve head cupping, rim thinning, and retinal nerve fiber layer (RNFL) defect by ophthalmoscopy or stereo disc photography. However, less than optimal agreement has been reported in subjective assessment of optic disc photographs performed by different observers and even among glaucoma specialists.3 Because early diagnosis may lead to early treatment and, thus, minimize glaucomatous damage to the optic nerve, modalities that can provide objective and accurate measurement of the optic nerve head and RNFL thickness are of great diagnostic significance. Quantitative imaging techniques such as optical coherence tomography (OCT),4 scanning laser topography,5 and scanning laser polarimetry6 are promising methods for objective anatomic diagnosis of glaucoma.
Optical coherence tomography, first described by Huang et al,4 is the only imaging modality with sufficiently fine depth resolution to measure the RNFL thickness directly. Measurements of the circumpapillary RNFL are reproducible7-9 and useful in the early diagnosis of glaucoma.10-19 Stratus (Carl Zeiss Meditec, Inc., Dublin, CA) is the most widely used OCT system for glaucoma diagnosis. Stratus measures the RNFL thickness profile along a 3.4-mm-diameter circle around the optic disc. Based on the profile, the averages of overall, quadrant, and clock-hour RNFL thickness are computed and displayed. At present, the clinician has no clear guideline on whether one, several, or all of these diagnostic parameters should be used in the clinical diagnosis of glaucoma. Based on the area under the receiver operating characteristic curve (AROC), some studies have shown the overall RNFL thickness average to be the best diagnostic parameter.11,13,14,16,19 Other studies have shown the inferior10,17,20 or superior21 quadrant RNFL thickness average to be the best, in agreement with clinical observation that glaucomatous optic nerve damage seems to begin in the inferotemporal or superotemporal area.22-24 It is logical that optimal glaucoma detection might best employ a combination of several parameters. Using combinations of RNFL parameters to evaluate Stratus OCT detection of perimetric glaucoma, Budenz et al11 determined that the best combinations of sensitivity and specificity seem to be any quadrants abnormal or clock hours abnormal at the fifth percentile level. In this study, we performed a more detailed analysis of whether a selective combination of Stratus RNFL parameters could further optimize glaucoma diagnosis. We placed the emphasis on or-logic combinations that could easily be used by clinicians using the Stratus OCT printout with no external computational aid.
Methods and Materials
Study Population and Database
This investigation is based on the Advanced Imaging for Glaucoma Study (AIGS), a multicenter bioengineering partnership and clinical study sponsored by the National Eye Institute, part of the National Institutes of Health. All study procedures adhered to the principles outlines in the Declaration of Helsinki for research involving human subjects. Written informed consent was obtained from all participants. Institutional review board/ethics committee approval was obtained from the institutional review boards of all participating institutions. The AIGS is a prospective longitudinal study that began enrollment in 2004. Data from the baseline visits are used in the present analysis. Study participants are classified into normal, glaucoma suspect, pre-perimetric glaucoma, and perimetric glaucoma (PG) groups. Only age-matched normal and PG participants are used here. All participants were between the ages of 40 and 79 at baseline.
Participants were assigned to the normal group if both eyes had intraocular pressure of <21 mmHg, a normal Humphrey Swedish Interactive Threshold Algorithm 24-2 VF (defined as having mean deviation [MD] and pattern standard deviation [PSD] within 95% limits of the normal reference and a glaucoma hemifield test within 97% limits), a central corneal thickness > 500 μm, an open anterior chamber angle, normal-appearing optic nerve head and RNFL by ophthalmoscopy, and no history of chronic corticosteroid use or corneal surgery.
Participants were classified as PG if at least one eye fulfilled the criteria abnormal VF (defined as an abnormal PSD [P<0.05] or glaucoma hemifield test [P<0.01] in a consistent glaucomatous pattern on 2 qualifying VFs) and glaucomatous optic nerve head abnormality detected on stereo disc photography (defined as diffuse or localized rim thinning, notch in the rim, vertical cup-to-disc ratio greater than the fellow eye by >0.2, RNFL defect or progressive excavation of the disc, or thinning of the neuroretinal rim).
One aim of the AIGS is to evaluate glaucoma diagnostic accuracy using the latest generation of quantitative image instruments. The diagnostic parameters evaluated in this article were RNFL thickness, as measured by the Stratus OCT system (software version 4.0, Carl Zeiss Meditec, Inc., Dublin, CA). At baseline, the fast RNFL scan was performed twice on the same day, and the resulting RNFL thickness parameters were averaged. The photographers operating Stratus OCT were instructed to obtain scans with a signal strength score of >7 if possible. Scans with signal strength < 6 were excluded from analysis. Data from both eyes were used. Right and left eye clock-hour data are analyzed together, assuming mirror-image symmetry.
To prevent bias due to the age difference between the normal and PG groups, an age-matching selection was performed. Each PG participant was randomly matched to a normal participant within a ±5-year age range until suitable matches could not be found. The age-matched samples were then used for further analysis.
A more detailed description of the study protocols can be found in the AIGS manual of procedures, which can be downloaded from the Web site http://www.AIGStudy.net.
Statistical Analysis
For comparison between the normal and PG groups, 2-tailed t tests were used for continuous variables and chi-square tests were used for categorical variables. Normal distribution was verified for the continuous variables by inspection of histogram plots.
The RNFL diagnostic parameters were combined using or-logic, and-logic, or linear discriminant function (LDF) approaches. Because there are too many possible combinations among 17 RNFL parameters, we grouped the parameter on 3 different levels: overall, quadrants, and clock hours. Combinations of the 3 groups were evaluated for diagnostic accuracy. The best 2 of the 4 quadrants and best 6 of the 12 clock hours constituted an additional 2 groups. Their combinations with the overall average were also evaluated.
In the or-logic combination, glaucoma diagnosis is made if any of the component parameters were abnormal according to a preset cutoff defined by standardized deviate percentile equivalent. For example, the or-logic combination of overall, superior, and inferior RNFL parameters at the fifth percentile level would classify an eye as having glaucoma if any of the parameters are more than 1.65 standard deviations (SDs) below the average value of the normal reference group. In the and-logic combination, all of the component parameters must be judged abnormal for the combination to be classified as abnormal.
In the LDF approach, several diagnostic parameters are multiplied by different weight coefficients and then summed into one number. The weights are computed so the summed parameter is optimized for discrimination (in this case, between normal and PG groups). Because we wish to use the weight coefficients to judge the diagnostic importance of the component parameter, we must first normalize them to the same scale. The normalization was performed by converting quadrant and clock-hour RNFL thickness parameters to fractional deviations from normal—the parameter’s value in each eye is subtracted by its mean value in the normal group—and then dividing by the same mean. The resulting weight coefficients reflect the diagnostic importance of the parameters without being biased by the variation in RNFL thickness between the different quadrants and clock hours.
The AROC, sensitivity, and specificity were used to compare the diagnostic power of RNFL parameters. To compute the AROC of or-logic combinations, we transformed the value of each parameter into the standardized deviate—the value is subtracted by the mean value of the normal group and divided by the SD of the normal group. Then, according to the or-logic concept, the minimum standardized deviate value was used to construct the ROC curve. For example, if the combination of overall, inferior, and superior RNFL thickness parameters of a particular eye has standardized deviate values of -1.70, -1.60, and -1.50, respectively, then the minimum value of -1.70 is selected for the eye. The ROC curve is then constructed by computing the sensitivity and specificity along a continuum of cutoff standardized deviate values. Sensitivities were also computed at fifth percentile and first percentile cutoffs according to the formula meanN + zα SDN, in which meanN and SDN are the mean and SD of the normal group. Assuming normal distribution, zα = -1.65 for the fifth percentile cutoff and zα = -2.33 for the first percentile cutoff.
The study was based on hypothesis generation, and the criterion for significance was set at P<0.05. To use both eyes of each participant in analysis, the intereye correlation was adjusted by generalized estimating equations,25 robust variance estimation (Huber-White sandwich estimator),26,27 or formulas derived for clustered samples. The generalized estimating equations approach was used in t tests. The robust variance estimation method was used to compute covariance and SD values used in LDF, sensitivity, and specificity calculations. The AROC was computed based on the formula in Obuchowski28 that extended the nonparametric method of DeLong et al29 applied to clustered data, whereas the standard error of sensitivity and specificity was computed based on the formula for clustered binary data derived by Rao and Scott.30 The generalized estimating equations, t test, and chi-square tests were done in SAS 9.1 (SAS Inc., Cary, NC), and the other analyses were written in MATLAB 7.0 (MathWorks, Inc., Natick, MA).
Results
Analyses were performed on 89 normal and 89 PG age-matched participants selected from a database of 99 normal (194 eyes) and 132 PG (196 eyes) participants. The characteristics of the selected study populations are listed in Table 1 (available at http://aaojournal.org). There were not significant differences between the normal and PG groups in terms of age and gender. There were more Caucasians in the normal group. However, there was no significant difference between the racial groups in terms of RNFL thickness parameters. In the PG group, 93 eyes (69.9%) had MD ≥ -6.0 decibels (early glaucoma), 29 eyes (21.8%) had MD between -6.01 and -12.0 decibels (moderate glaucoma), and 11 eyes (8.3%) had MD <-12 decibels (advanced glaucoma).
Table 1.
Characteristics of the Study Populations
| Parameter/Group | Normal | PG | All | P Value* |
|---|---|---|---|---|
| No. of subjects | 89 | 89 | 198 | |
| No. of eyes† | 174 | 133 | 307 | |
| Age [Mean ± standard deviation (range)] | 56±9 (40-76) | 58±7 (41-71) | 57±8 (40-76) | 0.13 |
| Female (% total) | 69 | 61 | 65 | 0.35 |
| Race (Caucasian) | 94% | 72% | 83% | <0.0001 |
PG = perimetric glaucoma.
Based on comparing normal and PG groups.
In the normal group, 4 participants had only one eye with signal strength score > 5.
As shown in Table 2 (available at http://aaojournal.org), the RNFL was thinner in the PG group than in the normal group, overall and in every quadrant and clock hour except for 9 right eye (R)/3 left eye (L).
Table 2.
Comparison of the Retinal Nerve Fiber Layer (RNFL) Thickness Parameter in Normal and Perimetric Glaucoma (PG) Groups
| RNFL Thickness (μm) | Normal | PG | P Value* |
|---|---|---|---|
| Overall average | 99.3 ± 9.6 (74.6-131.4) | 77.9 ± 15.1 (41.9-127.5) | <0.0001 |
| Superior quadrant | 121.0 ± 15.0 (69.0-156.0) | 92.0 ± 22.5 (35.0-146.5) | <0.0001 |
| Nasal quadrant | 78.4 ± 16.3 (39.0-121.0) | 65.3 ± 16.1 (35.0-127.5) | <0.0001 |
| Inferior quadrant | 127.9 ± 15.8 (92.0-173.0) | 92.8 ± 25.3 (45.5-193.0) | <0.0001 |
| Temporal quadrant | 69.4 ± 13.7 (42.5-119.0) | 61.6 ± 16.9 (25.0-99.5) | 0.0004 |
| Clock hour 11 R/1 L | 130.0 ± 19.6 (75.0-183.5) | 97.8 ± 9.7 (35.5-172.5) | <0.0001 |
| Clock hour 12 R/12 L | 122.3 ± 22.7 (58.5-177.5) | 90.3 ± 31.6 (33.0-280.0) | <0.0001 |
| Clock hour 1 R/11 L | 109.9 ± 20.0 (53.0-164.5) | 89.0 ± 25.3 (33.0-160.5) | <0.0001 |
| Clock hour 2 R/10 L | 91.8 ± 21.2 (39.0-142.0) | 76.2 ± 21.0 (33.5-137.5) | <0.0001 |
| Clock hour 3 R/9 L | 65.1 ± 16.2 (35.0-114.0) | 54.5 ± 15.7 (30.5-123.0) | <0.0001 |
| Clock hour 4 R/8 L | 77.3 ± 17.7 (35.0-129.5) | 64.3 ± 7.8 (32.5-130.5) | <0.0001 |
| Clock hour 5 R/7 L | 109.4 ± 22.1 (52.0-168.0) | 86.3 ± 22.1 (32.0-205.0) | <0.0001 |
| Clock hour 6 R/6 L | 140.3 ± 25.2 (83.5-225.5) | 98.8 ± 30.6 (37.0-191.5) | <0.0001 |
| Clock hour 7 R/5 L | 133.9 ± 20.9 (83.0-190.5) | 93.3 ± 35 (26.5-184.5) | <0.0001 |
| Clock hour 8 R/4 L | 70.5 ± 15.8 (42.0-121.5) | 60.1 ± 7.9 (26.5-105.5) | <0.0001 |
| Clock hour 9 R/3 L | 54.6 ± 11.2 (33.0-101.5) | 53.0 ± 14.0 (18.0-88.5) | 0.4 |
| Clock hour 10 R/2 L | 83.5 ± 18.1 (48.0-153.5) | 72.5 ± 24.9 (24.0-139.5) | 0.0003 |
RNFL = retinal nerve fiber layer.
Parameter values are listed as mean ± standard deviation (range). The left eye (L) and right eye (R) clock-hour RNFL thickness parameters are combined assuming mirror symmetry.
Based on generalized estimating equations-adjusted 2-sided t test for a comparison between normal and PG groups.
Quadrant LDF analysis (Table 3 [available at http://aaojournal.org]) showed that the superior and inferior quadrants received more weight than nasal and temporal quadrants. Clock-hour LDF analysis (Table 4 [available at http://aaojournal.org]) showed that the following clock hours have the most positive weight: 11 R/1 L, 6 R/L, 12 R/L, 7 R/5 L, 8 R/4 L, and 0.4 R/8 L.
Table 3.
Composition of the Linear Discriminant Function (LDF) Based on Quadrant Parameters
| RNFL Thickness Parameter | Normalized LDF Weight* |
|---|---|
| Superior quadrant | 9.6 |
| Nasal quadrant | -2.7 |
| Inferior quadrant | 10.9 |
| Temporal quadrant | -3.3 |
RNFL = retinal nerve fiber layer.
Linear discriminant function coefficients computed after the RNFL parameters are transformed into fractional deviation.
Table 4.
Composition of the Linear Discriminant Function (LDF) Based on Clock-Hour Parameters
| RNFL Thickness Parameter | Normalized LDF Weight* |
|---|---|
| Clock hour 11 R/1 L | 7.9 |
| Clock hour 12 R/12 L | 4.8 |
| Clock hour 1 R/11 L | -1.9 |
| Clock hour 2 R/10 L | -0.2 |
| Clock hour 3 R/9 L | -0.1 |
| Clock hour 4 R/8 L | 1.2 |
| Clock hour 5 R/7 L | -2.3 |
| Clock hour 6 R/6 L | 7.4 |
| Clock hour 7 R/5 L | 3.5 |
| Clock hour 8 R/4 L | 1.8 |
| Clock hour 9 R/3 L | -4.8 |
| Clock hour 10 R/2 L | -2.2 |
L = left eye; R = right eye; RNFL = retinal nerve fiber layer.
Linear discriminant function coefficients computed after the RNFL parameters are transformed into fractional deviation.
The AROC values listed in Table 5 (available at http://aaojournal.org) show that the overall RNFL thickness average had the highest diagnostic power as a single parameter, followed by the inferior quadrant, superior quadrant, and clock hour 6. The overall average was significantly better than all the other parameters. The clock-hour sectors within the superior and inferior quadrants showed a higher AROC than those within the nasal and temporal quadrants.
Table 5.
Area under the Receiver Operating Characteristic Curve (AROC) Analysis for Single Retinal Nerve Fiber Layer (RNFL) Parameters
| RNFL Thickness | AROC (SE) | P Value* |
|---|---|---|
| Overall average | 0.890 (0.025) | |
| Superior quadrant | 0.857 (0.027) | 0.095 |
| Nasal quadrant | 0.727 (0.035) | <0.0001 |
| Inferior quadrant | 0.882 (0.024) | 0.669 |
| Temporal quadrant | 0.631 (0.041) | <0.0001 |
| Clock hour 11 R/1 L | 0.823 (0.03) | 0.003 |
| Clock hour 12 R/ L | 0.82 (0.029) | 0.017 |
| Clock hour 1 R/11 L | 0.754 (0.035) | <0.0001 |
| Clock hour 2 R/10 L | 0.703 (0.035) | <0.0001 |
| Clock hour 3 R/9 L | 0.694 (0.036) | <0.0001 |
| Clock hour 4 R/8 L | 0.712 (0.035) | <0.0001 |
| Clock hour 5 R/7 L | 0.791 (0.03) | 0.0001 |
| Clock hour 6 R/ L | 0.853 (0.026) | 0.146 |
| Clock hour 7 R/5 L | 0.829 (0.03) | 0.011 |
| Clock hour 8 R/4 L | 0.667 (0.037) | <0.0001 |
| Clock hour 9 R/3 L | 0.534 (0.043) | <0.0001 |
| Clock hour 10 R/2 L | 0.649 (0.041) | <0.0001 |
L = left eye; R = right eye; SE = standard error.
Based on comparison with overall RNFL.
In our search for the best diagnostic combination of RNFL parameters, we tried several strategies: (1) combining the best quadrants or clock hours, (2) combining all quadrants or clock hours, and (3) adding the overall average to the previous combinations. The best quadrants and best clock hours were chosen based on their AROC values as single parameters (Table 5). The best quadrants were inferior and superior. The best clock hours lay in the inferior and superior quadrants: 6 R/L, 7 R/5 L, 11 R/1 L, 12 R/L, 5 R/7 L, and 1 R/11 L. The LDF weights also agreed that these were the most important parameters, except for the higher weight of 8 R/4 L and 4 R/8 L compared with 5 R/7 L and 1 R/11 L. We deemed the AROC ranking more reliable because the LDF weights could be affected by the high correlation between clock-hour parameters. Therefore, the inferior and superior clock hours were chosen as the select clock hours for the combination analysis. The results using the combined parameters are shown in Table 6. The best or-logic diagnostic criteria, according to AROC ranking, was to classify an eye as glaucomatous if the overall, inferior, or superior RNFL thickness was abnormally low. This combination has a significantly higher AROC than the best single parameter (P = 0.01), as well as the or-logic combination of all quadrants (P = 0.001), all clock hours (P = 0.005), or all parameters (P = 0.006). Beyond the top 3 parameters, the addition of more parameters into the combination using or-logic made AROC worse rather than better.
Table 6.
Area under the Receiving Operator Characteristic Curve (AROC) Sensitivity and Specificity Analyses for Combined Retinal Nerve Fiber Layer (RNFL) Parameters
| RNFL Thickness Parameters | AROC (SE) | Sensitivity < 5%* | Specificity < 5%* | Sensitivity < 1%† | Specificity < 1%† |
|---|---|---|---|---|---|
| Overall | 0.890 (0.025) | 0.406 (0.05) | 1.0 (0) | 0.180 (0.041) | 1.0 (0) |
| Inferior or superior quadrant | 0.921 (0.02) | 0.654 (0.046) | 0.966 (0.016) | 0.421 (0.046) | 0.994 (0.006) |
| Any quadrant | 0.893 (0.023) | 0.662 (0.046) | 0.937 (0.02) | 0.421 (0.046) | 0.994 (0.006) |
| Overall, inferior, or superior quadrant | 0.922 (0.021) | 0.654 (0.046) | 0.966 (0.016) | 0.421 (0.046) | 0.994 (0.006) |
| Overall or any quadrant | 0.894 (0.023) | 0.662 (0.046) | 0.937 (0.02) | 0.421 (0.046) | 0.994 (0.006) |
| Select clock hours | 0.90 (0.023) | 0.782 (0.04) | 0.839 (0.032) | 0.579 (0.047) | 0.971 (0.015) |
| Any clock hour | 0.892 (0.024) | 0.797 (0.04) | 0.799 (0.035) | 0.579 (0.047) | 0.966 (0.016) |
| Overall or select clock hours‡ | 0.90 (0.023) | 0.782 (0.04) | 0.839 (0.032) | 0.579 (0.047) | 0.971 (0.015) |
| Overall or any clock hour | 0.892 (0.024) | 0.797 (0.04) | 0.799 (0.035) | 0.579 (0.047) | 0.966 (0.016) |
| Overall or any quadrants or any clock hour | 0.893 (0.024) | 0.797 (0.04) | 0.793 (0.036) | 0.586 (0.046) | 0.966 (0.016) |
| LDF of quadrants | 0.922 (0.02) | 0.737 (0.043) | 0.943 (0.022) | 0.541 (0.048) | 0.989 (0.008) |
| LDF of clock hours | 0.932 (0.019) | 0.820 (0.038) | 0.897 (0.029) | 0.699 (0.045) | 0.977 (0.011) |
LDF = linear discriminant function; SE = standard error.
Based on fifth percentile cutoff criteria.
Based on first percentile cutoff criteria.
Clock hours: 6 right eye (R)/left eye (L), 7 R/5 L, 11 R/1 L, 12 R/L, 5 R/7 L, 1 R/11 L.
We also investigated the use of and-logic to combine parameters. The AROC values of and-logic combinations were uniformly worse than the equivalent or-logic combination. The numerical results are not shown.
Venn diagram analysis of the or-logic combination of overall, inferior, and superior RNFL thickness parameters at fifth percentile cutoff is shown in Figures 1 and 2.
Figure 1.
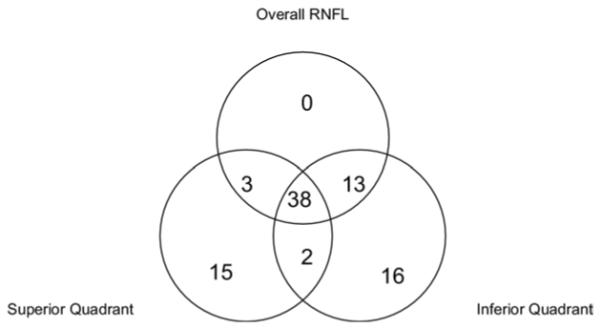
Of 133 glaucoma eyes, 87 (65.4%) were correctly classified using the or-logic combination (overall, inferior, superior) for glaucoma diagnosis. RNFL = retinal nerve fiber layer.
Figure 2.

Of 174 normal eyes, 168 (96.6%) were correctly classified using the or-logic combination (overall, inferior, superior) for glaucoma diagnosis. RNFL = retinal nerve fiber layer.
Using LDF to combine the quadrant parameters or clock-hour parameters (Table 6) yielded a slightly higher AROC than the or-logic combinations. But the best LDF combination (clock-hour LDF) was not significantly better (P = 0.41) than the best or-logic combination (overall, inferior, or superior).
The sensitivity and specificity values listed in Table 6 were based on cutoff values generated from the normal group of the AIGS. This differs slightly from the diagnostic classification thresholds used in the Stratus software (version 4.0), which are based on a normative database compiled by the manufacturer and stratified by age. Because clinicians generally have access only to the Stratus classifications, we also provide the sensitivity and specificity values based on Stratus criteria for the top 3 or-logic combinations (Table 7). The Stratus criteria (Table 7) yielded slightly higher sensitivities and lower specificities than AIGS criteria at the same percentile cutoff thresholds. Using the Stratus criteria, the or-logic combination of overall, inferior, or superior at the fifth percentile cutoff had the best combination of sensitivity and specificity (Table 7).
Table 7.
Sensitivity and Specificity Analyses for Retinal Nerve Fiber Layer (RNFL) Parameters Based on the Stratus Age-Adjusted Normative Reference
| RNFL Thickness Parameters | Sensitivity<5% | Specificity<5% | Sensitivity<1% | Specificity<1% |
|---|---|---|---|---|
| Overall | 0.579 (0.049) | 0.994 (0.006) | 0.361 (0.047) | 1.0 (0) |
| Inferior or superior | 0.714 (0.044) | 0.937 (0.022) | 0.571 (0.049) | 0.989 (0.008) |
| Overall or inferior or superior | 0.729 (0.044) | 0.937 (0.022) | 0.579 (0.05) | 0.989 (0.008) |
Value (standard error). Stratus age-adjusted normative reference cutoff values at 1 and 5 percentile points provided by Jennifer Lipyanik, senior clinical research scientist, Carl Zeiss Meditec.
Discussion
Stratus OCT is a valuable aid in differentiating glaucomatous from normal eyes.19,20,31-39 Optical coherence tomography provides objective, quantitative, reproducible measurements of RNFL thickness.11,19 Compared with VF testing, OCT scanning demands little effort from the patients and thus eliminates subjective performance variations and increases testing reliability and reproducibility. However, Stratus OCT does not provide a single diagnostic parameter that summarizes all information, making diagnostic decisions more difficult. Overall RNFL thickness is a global parameter but may not be sensitive in detecting focal or regional RNFL loss. In this study, we investigate the best method for combining the 17 diagnostic parameters on the Stratus RNFL printout. We emphasized or-logic and and-logic methods of combination because they do not require complicated computational aids. The parameters were grouped by the 3 levels of division: overall, quadrants, and clock hours. The best 2 quadrants and the best 6 clock hours were also analyzed as separate groups. We searched the combination of these groups for the best diagnostic performance. Although this is not as comprehensive as searching all 680 combinations of the 17 parameters, it was more comprehensive than any previous search. We were likely to have found the best diagnostic combination with this approach, because the trend showed that the best possible combination contained only the 3 best parameters and adding more parameters to the combination decreased diagnostic accuracy (AROC).
Budenz et al11 investigated the combination of Stratus OCT RNFL diagnostic parameters in glaucoma diagnosis. They also evaluated or-logic combinations of quadrants or clock-hour sectors. Diagnostic power was assessed by diagnostic sensitivity and specificity for or-logic combinations. Budenz et al11 recommended that ≥1 clock hour or ≥1 quadrant abnormalities were reasonable parameters for diagnosing glaucoma. However, it was unclear which combination was best because they did not provide AROC calculations for the parameter combinations. When more parameters are used, sensitivity improves while specificity gets worse. It is unclear what combination of sensitivity and specificity represents the optimal. In our study, AROC values for or-logic combinations were computed for a more impartial ranking. We also employed a larger number of participants in our clinical study. Our results showed that the AROC value was optimized with an or-logic combination of the 3 best RNFL thickness parameters: overall average, superior quadrant, and inferior quadrant (we refer to this as the OSI combination). The AROC values got worse as more diagnostic parameters were added to the mix—the improvement in sensitivity was outweighed by the decrease in specificity. The OSI combination had significantly greaterdiagnostic accuracy (AROC) than the combinations recommended by Budenz.
We noted that there were more Caucasians in the normal group than in the PG group. To confirm our inference was not biased due to racial imbalance, we reanalyzed the data using only Caucasian participants. The OSI combination remained at the top of the AROC ranking (details not shown).
We used the Venn diagrams (Figs 1, 2) to gain insight into how the 3 parameters—superior, inferior, and overall— contributed to glaucoma diagnosis. When a true positive is detected by a single parameter, it is most often inferior thickness (16 cases), followed by superior (15) (Fig 1). This is expected because glaucoma tends to damage the RNFL in the inferior quadrant more severely.24 When a false positive is due to a single parameter, it is likely due to the inferior or superior parameters (5 and 1) but never to the overall (Fig 2). We suspect that these false-positive misclassifications were caused by centration error during OCT scanning, as we frequently observe some degree of misalignment between the OCT scan circle and optic disc. Because the RNFL thickness decreases with distance from the optic disc, consistent centration is important for RNFL measurements and comparisons. Misalignment affects the quadrant RNFL values more than the overall value. For example, if the scan circle is positioned superiorly relative to the disc, then the scan will pass closer to the inferior disc margin and farther from the superior disc margin. This causes the inferior RNFL to appear thicker and the superior RNFL to appear artifactually thinner, whereas the overall value is minimally affected. We believe that if centration could be improved by better operator technique, eye tracking technology, or faster OCT scanning, then quadrant or sectoral RNFL measurements would assume greater diagnostic importance. But with the Stratus performance as it is, the overall RNFL value remains the most reliable anchoring diagnostic parameter.
It was possible to generate even higher AROC values using the LDF approach. However, these results need to be interpreted with caution, as the LDFs were evaluated using the same dataset they were trained on. The LDF is optimized to the training set, and the AROC value tends to decrease when an independent set of data is tested. This problem is ameliorated when a large training set is used. We recommend that the manufacturer use a larger body of data to investigate whether an LDF could improve diagnostic performance. Nonlinear discriminant functions40 and expert systems such as relevance vector machine41 and support vector machine42,43 approaches could also be used to combine parameters. All these more sophisticated approaches require calculations on a computer. Therefore, they need to be implemented on the Stratus OCT’s computer system to be useful to clinicians. Until then, we recommend using the simpler or-logic for diagnostic combinations.
Based on our results, we recommend that physicians interpret Stratus RNFL measurement by primarily looking at the overall, superior, and inferior RNFL thicknesses. Glaucoma should be suspected when any of these 3 parameters are abnormal at the fifth percentile level. And glaucoma is very likely when any of these 3 parameters are abnormal at the first percentile level. Of course, the clock-hour parameters remain useful when correlation is needed for focal optic nerve head rim notching or focal VF defect. But taken alone, the OSI combination appeared to be an optimal distillation of the Stratus OCT RNFL scan. In the AIGS, we will adopt the OSI combination as the diagnostic criterion for Stratus RNFL thickness. This criterion will be used in further investigations in combination with Stratus optic disc and macular parameters. It will also be used in comparative studies with parameters generated by other instruments, such as scanning laser topography and scanning laser polarimetry. Previous comparative studies used only the best single parameter to evaluate the diagnostic performance of OCT.10,11,13,14,16,17,19-21 This underestimates the diagnostic power of OCT. The OSI combination will significantly improve OCT’s diagnostic performance in both clinical studies and clinical practice.
Acknowledgments
Supported by the National Institute of Health, Bethesda, Maryland (grant nos. R01 EY013516, P30 EY03040), and a grant from Research to Prevent Blindness, New York, New York.
Drs Huang and Schuman receive royalties from the Massachusetts Institute of Technology derived from an optical coherence tomography patent licensed to Carl Zeiss Meditec. Dr Huang has research grants from, stock options in, a consulting relationship with, travel support from, and potential patent royalty interest in Optovue, Inc.
References
- 1.Quigley HA, Addicks EM, Green WR. Optic nerve damage in human glaucoma. III. Quantitative correlation of nerve fiber loss and visual field defect in glaucoma, ischemic neuropathy, papilledema, and toxic neuropathy. Arch Ophthalmol. 1982;100:135–46. doi: 10.1001/archopht.1982.01030030137016. [DOI] [PubMed] [Google Scholar]
- 2.Mikelberg FS, Yidegiligne HM, Schulzer M. Optic nerve axon count and axon diameter in patients with ocular hypertension and normal visual fields. Ophthalmology. 1995;102:342–8. doi: 10.1016/s0161-6420(95)31019-6. [DOI] [PubMed] [Google Scholar]
- 3.Nicolela MT, Martinez-Bello C, Morrison CA, et al. Scanning laser polarimetry in a selected group of patients with glaucoma and normal controls. Am J Ophthalmol. 2001;132:845–54. doi: 10.1016/s0002-9394(01)01215-6. [DOI] [PubMed] [Google Scholar]
- 4.Huang D, Swanson EA, Lin CP, et al. Optical coherence tomography. Science. 1991;254:1178–81. doi: 10.1126/science.1957169. [DOI] [PMC free article] [PubMed] [Google Scholar]
- 5.Chauhan BC, Blanchard JW, Hamilton DC, LeBlanc RP. Technique for detecting serial topographic changes in the optic disc and peripapillary retina using scanning laser tomography. Invest Ophthalmol Vis Sci. 2000;41:775–82. [PubMed] [Google Scholar]
- 6.Choplin NT, Lundy DC, Dreher AW. Differentiating patients with glaucoma from glaucoma suspects and normal subjects by nerve fiber layer assessment with scanning laser polarimetry. Ophthalmology. 1998;105:2068–76. doi: 10.1016/S0161-6420(98)91127-7. [DOI] [PubMed] [Google Scholar]
- 7.Blumenthal EZ, Williams JM, Weinreb RN, et al. Reproducibility of nerve fiber layer thickness measurements by use of optical coherence tomography. Ophthalmology. 2000;107:2278–82. doi: 10.1016/s0161-6420(00)00341-9. [DOI] [PubMed] [Google Scholar]
- 8.Budenz DL, Chang RT, Huang X, et al. Reproducibility of retinal nerve fiber thickness measurements using the stratus OCT in normal and glaucomatous eyes. Invest Ophthalmol Vis Sci. 2005;46:2440–3. doi: 10.1167/iovs.04-1174. [DOI] [PubMed] [Google Scholar]
- 9.Paunescu LA, Schuman JS, Price LL, et al. Reproducibility of nerve fiber thickness, macular thickness, and optic nerve head measurements using Stratus OCT. Invest Ophthalmol Vis Sci. 2004;45:1716–24. doi: 10.1167/iovs.03-0514. [DOI] [PMC free article] [PubMed] [Google Scholar]
- 10.Leung CK, Chan WM, Yung WH, et al. Comparison of macular and peripapillary measurements for the detection of glaucoma. An optical coherence tomography study. Ophthalmology. 2005;112:391–400. doi: 10.1016/j.ophtha.2004.10.020. [DOI] [PubMed] [Google Scholar]
- 11.Budenz DL, Michael A, Chang RT, et al. Sensitivity and specificity of the StratusOCT for perimetric glaucoma. Ophthalmology. 2005;112:3–9. doi: 10.1016/j.ophtha.2004.06.039. [DOI] [PubMed] [Google Scholar]
- 12.Burgansky-Eliash Z, Wollstein G, Chu T, et al. Optical coherence tomography machine learning classifiers for glaucoma detection: a preliminary study. Invest Ophthalmol Vis Sci. 2005;46:4147–52. doi: 10.1167/iovs.05-0366. [DOI] [PMC free article] [PubMed] [Google Scholar]
- 13.Guedes V, Schuman JS, Hertzmark E, et al. Optical coherence tomography measurement of macular and nerve fiber layer thickness in normal and glaucomatous human eyes. Ophthalmology. 2003;110:177–89. doi: 10.1016/s0161-6420(02)01564-6. [DOI] [PMC free article] [PubMed] [Google Scholar]
- 14.Sihota R, Sony P, Gupta V, et al. Comparing glaucomatous optic neuropathy in primary open angle and chronic primary angle closure glaucoma eyes by optical coherence tomography. Ophthalmic Physiol Opt. 2005;25:408–15. doi: 10.1111/j.1475-1313.2005.00304.x. [DOI] [PubMed] [Google Scholar]
- 15.Williams ZY, Schuman JS, Gamell L, et al. Optical coherence tomography measurement of nerve fiber layer thickness and the likelihood of a visual field defect. Am J Ophthalmol. 2002;134:538–46. doi: 10.1016/s0002-9394(02)01683-5. [DOI] [PubMed] [Google Scholar]
- 16.Wollstein G, Schuman JS, Price LL, et al. Optical coherence tomography (OCT) macular and peripapillary retinal nerve fiber layer measurements and automated visual fields. Am J Ophthalmol. 2004;138:218–25. doi: 10.1016/j.ajo.2004.03.019. [DOI] [PubMed] [Google Scholar]
- 17.Medeiros FA, Zangwill LM, Bowd C, et al. Evaluation of retinal nerve fiber layer, optic nerve head, and macular thickness measurements for glaucoma detection using optical coherence tomography. Am J Ophthalmol. 2005;139:44–55. doi: 10.1016/j.ajo.2004.08.069. [DOI] [PubMed] [Google Scholar]
- 18.Schuman JS, Hee MR, Arya AV, et al. Optical coherence tomography: a new tool for glaucoma diagnosis. Curr Opin Ophthalmol. 1995;6:89–95. doi: 10.1097/00055735-199504000-00014. [DOI] [PubMed] [Google Scholar]
- 19.Chen HY, Huang ML. Discrimination between normal and glaucomatous eyes using Stratus optical coherence tomography in Taiwan Chinese subjects. Graefes Arch Clin Exp Ophthalmol. 2005;243:894–902. doi: 10.1007/s00417-005-1140-y. [DOI] [PubMed] [Google Scholar]
- 20.Huang ML, Chen HY. Development and comparison of automated classifiers for glaucoma diagnosis using stratus optical coherence tomography. Invest Ophthalmol Vis Sci. 2005;46:4121–9. doi: 10.1167/iovs.05-0069. [DOI] [PubMed] [Google Scholar]
- 21.Nouri-Mahdavi K, Hoffman D, Tannenbaum DP, et al. Identifying early glaucoma with optical coherence tomography. Am J Ophthalmol. 2004;137:228–35. doi: 10.1016/j.ajo.2003.09.004. [DOI] [PubMed] [Google Scholar]
- 22.Mabuchi F, Aihara M, Mackey MR, et al. Regional optic nerve damage in experimental mouse glaucoma. Invest Ophthalmol Vis Sci. 2004;45:4352–8. doi: 10.1167/iovs.04-0355. [DOI] [PubMed] [Google Scholar]
- 23.Jonas JB, Bergua A, Schmitz-Valckenberg P, et al. Ranking of optic disc variables for detection of glaucomatous optic nerve damage. Invest Ophthalmol Vis Sci. 2000;41:1764–73. [PubMed] [Google Scholar]
- 24.Jonas JB, Fernandez MC, Sturmer J. Pattern of glaucomatous neuroretinal rim loss. Ophthalmology. 1993;100:63–8. doi: 10.1016/s0161-6420(13)31694-7. [DOI] [PubMed] [Google Scholar]
- 25.Liang KY, Zeger SL. Longitudinal data analysis using generalized linear models. Biometrika. 1986;73:13–22. [Google Scholar]
- 26.White H. A heteroskedasticity-consistent covariance matrix estimator and a direct test for heteroskedasticity. Econometrica. 1980;48:817–30. [Google Scholar]
- 27.Williams RL. A note on robust variance estimation for cluster-correlated data. Biometrics. 2000;56:645–6. doi: 10.1111/j.0006-341x.2000.00645.x. [DOI] [PubMed] [Google Scholar]
- 28.Obuchowski NA. Nonparametric analysis of clustered ROC curve data. Biometrics. 1997;53:567–78. [PubMed] [Google Scholar]
- 29.DeLong ER, DeLong DM, Clarke-Pearson DL. Comparing the areas under two or more correlated receiver operating characteristic curves: a nonparametric approach. Biometrics. 1988;44:837–45. [PubMed] [Google Scholar]
- 30.Rao JN, Scott AJ. A simple method for the analysis of clustered binary data. Biometrics. 1992;48:577–85. [PubMed] [Google Scholar]
- 31.Horn FK, Mardin CY, Viestenz A, Junemann AG. Association between localized visual field losses and thickness deviation of the nerve fiber layer in glaucoma. J Glaucoma. 2005;14:419–25. doi: 10.1097/01.ijg.0000185619.06540.aa. [DOI] [PubMed] [Google Scholar]
- 32.Colen TP, Tang NE, Mulder PG, Lemij HG. Sensitivity and specificity of new GDx parameters. J Glaucoma. 2004;13:28–33. doi: 10.1097/00061198-200402000-00006. [DOI] [PubMed] [Google Scholar]
- 33.Essock EA, Sinai MJ, Bowd C, et al. Fourier analysis of optical coherence tomography and scanning laser polarimetry retinal nerve fiber layer measurements in the diagnosis of glaucoma. Arch Ophthalmol. 2003;121:1238–45. doi: 10.1001/archopht.121.9.1238. [DOI] [PubMed] [Google Scholar]
- 34.Ford BA, Artes PH, McCormick TA, et al. Comparison of data analysis tools for detection of glaucoma with the heidelberg retina tomograph. Ophthalmology. 2003;110:1145–50. doi: 10.1016/S0161-6420(03)00230-6. [DOI] [PubMed] [Google Scholar]
- 35.Nakatsue T, Shirakashi M, Yaoeda K, et al. Optic disc topography as measured by confocal scanning laser ophthalmoscopy and visual field loss in Japanese patients with primary open-angle or normal-tension glaucoma. J Glaucoma. 2004;13:291–8. doi: 10.1097/00061198-200408000-00006. [DOI] [PubMed] [Google Scholar]
- 36.Kiriyama N, Ando A, Fukui C, et al. A comparison of optic disc topographic parameters in patients with primary open angle glaucoma, normal tension glaucoma, and ocular hypertension. Graefes Arch Clin Exp Ophthalmol. 2003;241:541–5. doi: 10.1007/s00417-003-0702-0. [DOI] [PubMed] [Google Scholar]
- 37.Munkwitz S, Funk J, Loeffler KU, et al. Sensitivity and specificity of scanning laser polarimetry using the GDx. Br J Ophthalmol. 2004;88:1142–5. doi: 10.1136/bjo.2003.036756. [DOI] [PMC free article] [PubMed] [Google Scholar]
- 38.Reus NJ, Lemij HG. Relationships between Standard Automated Perimetry, HRT Confocal Scanning Laser Ophthalmoscopy, and GDx VCC Scanning Laser Polarimetry. Invest Ophthalmol Vis Sci. 2005;46:4182–8. doi: 10.1167/iovs.04-1029. [DOI] [PubMed] [Google Scholar]
- 39.Zangwill LM, Chan K, Bowd C, et al. Heidelberg retina tomograph measurements of the optic disc and parapapillary retina for detecting glaucoma analyzed by machine learning classifiers. Invest Ophthalmol Vis Sci. 2004;45:3144–51. doi: 10.1167/iovs.04-0202. [DOI] [PMC free article] [PubMed] [Google Scholar]
- 40.Roth V, Steinhage V. Nonlinear Discriminant Analysis Using Kernel Functions. MIT Press; Cambridge, MA: 2000. pp. 568–74. [Google Scholar]
- 41.Tipping ME. The relevance vector machine. In: Solla SA, Leen TK, Müller K-R, editors. Advances in Neural Information Processing Systems. MIT Press; Cambridge, MA: 2000. pp. 652–8. [Google Scholar]
- 42.Boser BE, Guyon IM, Vapnik VN. A training algorithm for optimal margin classifiers; Proceedings of the 5th Annual ACM Workshop on Computational Learning Theory; Pittsburgh: ACM Press. 1992.pp. 144–52. [Google Scholar]
- 43.Vapnik V. The Nature of Statistical Learning Theory. Springer-Verlag; New York: 1996. pp. 138–45. [Google Scholar]