Abstract
The human cerebral cortex is a highly convoluted structure composed of sulci and gyri, corresponding to the valleys and ridges of the cortical surface respectively. Automatic parcellation of the cortical surface into sulcal regions is of great importance in structural and functional mapping of the human brain. In this paper, a novel method is proposed for automatic cortical sulcal parcellation based on the geometric characteristics of cortical surface including its principal curvatures and principal directions. This method is composed of two major steps: 1) employing the hidden Markov random field model (HMRF) and the expectation maximization (EM) algorithm on the maximum principal curvatures of the cortical surface for sulcal region segmentation, and 2) using a principal direction flow field tracking method on the cortical surface for sulcal basin segmentation. The flow field is obtained by diffusing the principal direction field on the cortical surface mesh. A unique feature of this method is that the automatic sulcal parcellation process is quite robust and efficient, and is independent of any external guidance such as atlas-based warping. The method has been successfully applied to the inner cortical surfaces of twelve healthy human brain MR images. Both quantitative and qualitative evaluation results demonstrate the validity and efficiency of the proposed method.
1. Introduction
The human cerebral cortex is a highly convoluted and complex anatomical structure composed of sulci and gyri, corresponding to the valleys and ridges of the cortical surface representation respectively. Major cortical sulci and gyri are common anatomical landmarks in human brains, even though the precise pattern of sulci and gyri geometry could vary considerably across individuals (Ono et al., 1990). Thus, major cortical sulci and gyri have been extensively used for assisting deformable registration of human brain MR images (Thompson and Toga, 1996; Davatzikos, 1997; Collins et al., 1998; Vaillant and Davatzikos, 1999; Hellier and Barillot, 2003), analyzing the variation of healthy human brain (Mangin et al., 2004a; Mangin et al., 2004b; Fillard et al., 2007; Lohmann et al., 2008; Durrleman et al., 2007; Sun et al., 2007), as well as finding out the difference between normal brain and diseased ones (Ashburner et al., 2003). Since it is very time consuming to manually annotate sulci, even for experienced neuroanatomists, automatic sulci extraction and/or recognition has received increasing attention as a research goal in recent years. Therefore, a wide variety of automatic or semi-automatic methods have been proposed for extraction of sulci (Vaillant and Davatzikos, 1997; Le Goualher et al., 1997; Le Goualher et al., 1999; Zhou et al., 1999; Zeng et al., 1999; Lohmann and von Cramon, 2000; Rivière et al., 2002; Rettmann, et al., 2002; Yang and Kruggel, 2008) or sulcal fundi (Lohmann, 1998; Khaneja et al., 1998; Renault et al., 2000; Bartesaghi and Sapiro, 2001; Tao et al., 2002; Cachia et al., 2003; Lui et al., 2006; Kao et al., 2007; Tu et al., 2007; Shi et al., 2008; Li et al., 2008) either on volumetric MR images or reconstructed cortical surfaces. For example, Lohmann and Cramon 2000 developed a method for sulcal basin segmentation on the human brain MR image using region growing method on sulcal depth map. Rettmann et al. 2002 proposed a method for segmentation of sulcal region and sulcal basin using the watershed algorithm (Vincent and Soille, 1991) on the geodesic depth map on the cortical surface. Yang and Kruggel 2008 also proposed a method for sulcal region segmentation using watershed-like growing method based on the geodesic depth and mean curvature map on the cortical surface. However, the watershed algorithms are inherently sensitive to noise, which usually results in over-segmentation. Therefore, the authors proposed to merge the over-segmentation results based on certain heuristic rules (Rettmann, et al., 2002; Yang and Kruggel, 2008). Recently, Shi et al. 2008 developed a method to partition the cortical surface into sulcal regions and gyral regions using the graph cuts method (Boykov and Kolmogorov, 2004) based on the mean curvature map.
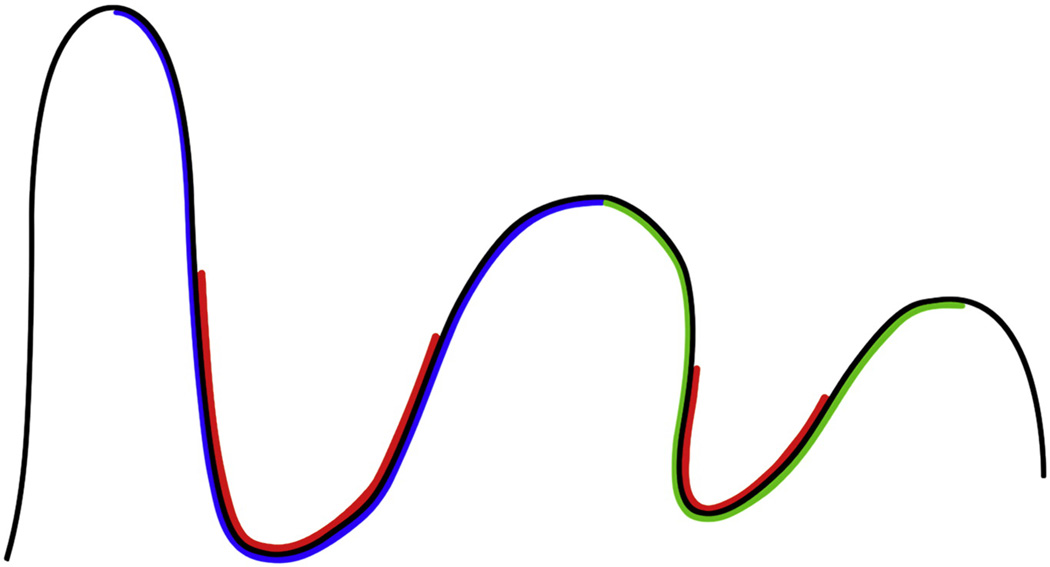
In this paper, we present an original method for parcellation of the cortical surface into sulcal regions and corresponding sulcal basins based on the geometric characteristics of principal curvatures and principal directions. By definitions, sulcal regions are the buried regions surrounding sulcal space on cortical surfaces (Rettmann et al., 2002), while sulcal basins are the regions bounded by gyral crest lines which separate different basins. Thus, adjacent sulcal basins meet at the gyral crest lines on cortical surfaces (Lohmann and von Cramon, 2000). Figure 1 shows a 2D schematic illustration of sulcal regions and sulcal basins. Thus, a partition of the cortical surface into sulcal basins produces a complete parcellation of the cortical surface (Lohmann and von Cramon, 2000). The basic ideas of our method are twofold. Firstly, since the maximum principal curvatures are negative at sulcal regions and positive at gyral regions (note that in the paper we always adopt the outward-oriented normal field), we model the histogram distribution of maximum principal curvatures using finite mixture Gaussian model and employ the hidden Markov random field model (HMRF) and the expectation maximization (EM) algorithm (Zhang et al., 2001) on the maximum principal curvatures of the cortical surface for sulcal region segmentation. Secondly, as the principal directions corresponding to the maximum principal curvatures point either towards or away from sulcal regions at a surface vertex, we follow the principal directions or the opposite directions of principal directions to reach sulcal root regions, which are the bottoms of sulcal regions. The set of vertices that converge to the same sulcal root region are naturally grouped together. Thus, partition of the cortical surface into different sulcal basins is naturally achieved. Notably, the estimated principal direction might be noisy and unreliable at flat cortical areas where both of the two principal curvatures are very small. To deal with this issue, we design a novel principal direction field diffusion method on the triangularized cortical surface by solving a variational equation, in order to generate a smooth tangent flow field from existing noisy principal direction field.
Figure 1.
A 2D schematic illustration of sulcal regions and sulcal basins. The red color parts indicate two sulcal regions. The blue and green parts represent two sulcal basins. As a result, partition of the cortical surface into sulcal basins provides a complete parcellation of the cortical surface (Lohmann and von Cramon, 2000).
The major contributions of this paper are threefold. Firstly, we extended the hidden Markov random field model and the expectation maximization (HMRF-EM) algorithm to triangularized cortical surfaces for the purpose of sulcal region segmentation based on maximum principal curvatures. Secondly, we designed a novel principal direction field diffusion method on the cortical surface to produce a smooth tangent flow field from noisy principal direction field. Finally, we developed a new method, called flow field tracking, for sulcal basin segmentation using the above generated tangent flow field. It should be noted that the methods of principal direction field diffusion and flow field tracking are not limited to the work on cortical surface presented in this paper, but could be potentially generalized for surface mesh segmentation in other applications.
2. Methods
Given a triangularized cortical surface, in general, our method for cortical sulcal parcellation consists of the following steps, as shown in Figure 2. Firstly, the principal curvatures and principal directions of each vertex on the cortical surface are estimated. Then, the HMRF-EM framework is adopted to accomplish sulcal region segmentation on the cortical surface based on maximum principal curvatures. Afterwards, the principal direction field is diffused to produce a smooth tangent flow field on the cortical surface by solving a variational equation. Finally, the flow field tracking method is performed on the tangent flow field to partition the cortical surface into different sulcal basins. In subsequent sections, each step will be explained in detail.
Figure 2.
The flow chart of the proposed cortical sulcal parcellation method.
2.1 Estimating principal curvatures and principal directions
The first step in our sulcal parcellation method is to estimate the principal curvatures and principal directions, since they are fundamental geometric properties for cortical surface analysis in our method. Curvatures, which represent how the normal direction changes from vertex to vertex, is the reciprocal of the circle that best approximates a normal patch of the surface in a given direction. However, due to the non-uniform distribution of the vertices and their neighborhoods in triangularized surfaces, it is not straightforward to estimate them accurately. A variety of methods have been proposed for estimating curvatures on the surface, including mean curvature, Gaussian curvature and principal curvatures. In our method, we adopt a robust and efficient finite difference approach to estimate the principal curvatures, the corresponding principal directions and curvature derivatives along with the principal directions (Rusinkiewicz, 2004). The basic idea of this method is as follows. Since the principal curvatures and principal directions at each vertex are the eigenvalues and eigenvectors of the Weingarten matrix of normal direction respectively, the Weingarten matrix in each triangle face is calculated first before estimating the Weingarten matrix at each vertex. Then, the Weingarten matrix at each vertex is computed as the weighted average in one ring of adjacent faces. More details are referred to Rusinkiewicz 2004.
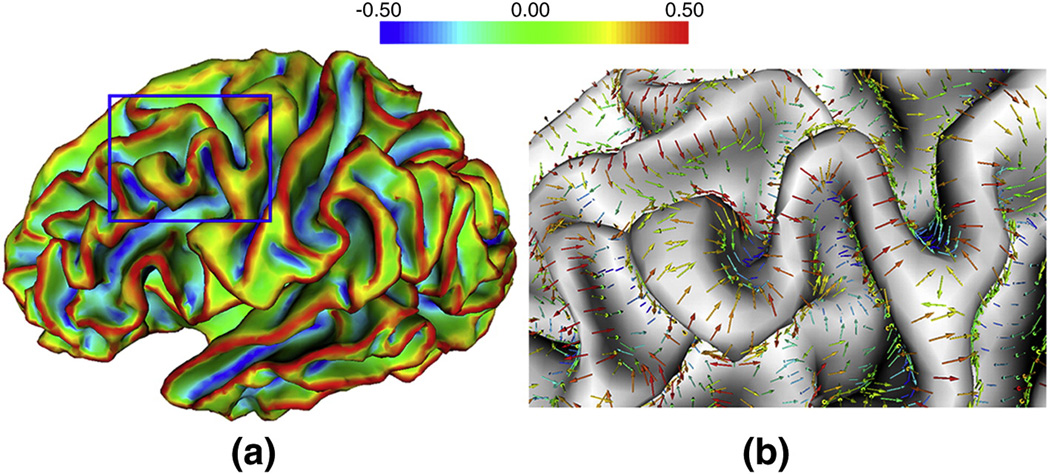
For the purpose of sulcal region and sulcal basin segmentation, we are interested both in the maximum principal curvature, which is the principal curvature with the largest absolute value in the two principal curvatures and in its corresponding principal direction (maximum principal direction). The maximum principal curvature and its corresponding principal direction measure the maximum strength and its corresponding direction of the normal direction variation respectively. However, the maximum principal direction is not unique at each vertex, since the opposite direction of the maximum principal direction can also be considered as the maximum principal direction. In order to force the maximum principal directions uniformly point toward sulcal root regions, which are the regions with large negative maximum principal curvatures, we flip the corresponding principal direction to the opposite direction, if the directional derivative of maximum principal curvature along the corresponding principal direction is positive. As a result, the principal directions uniformly point toward the decreasing direction of maximum principal curvature. Figure 3 shows an example of the estimated maximum principal curvature and maximum principal direction on a cortical inner surface of a hemisphere. It is apparent that the maximum principal curvatures are large positive and negative values at gyral crown and sulcal root regions respectively. Meanwhile, the maximum principal directions point towards the sulcal root regions and away from the gyral crown regions.
Figure 3.
An example of the estimated maximum principal curvatures and maximum principal directions on a cortical inner surface of a hemisphere. (a) is the maximal principal curvature of the surface. (b) is the maximum principal direction of the bounded rectangle surface region in blue in (a). Red color means large positive curvature value, while blue color represents large negative curvature value. Color bar is on the top.
2.2 Sulcal region segmentation based on the HMRF-EM
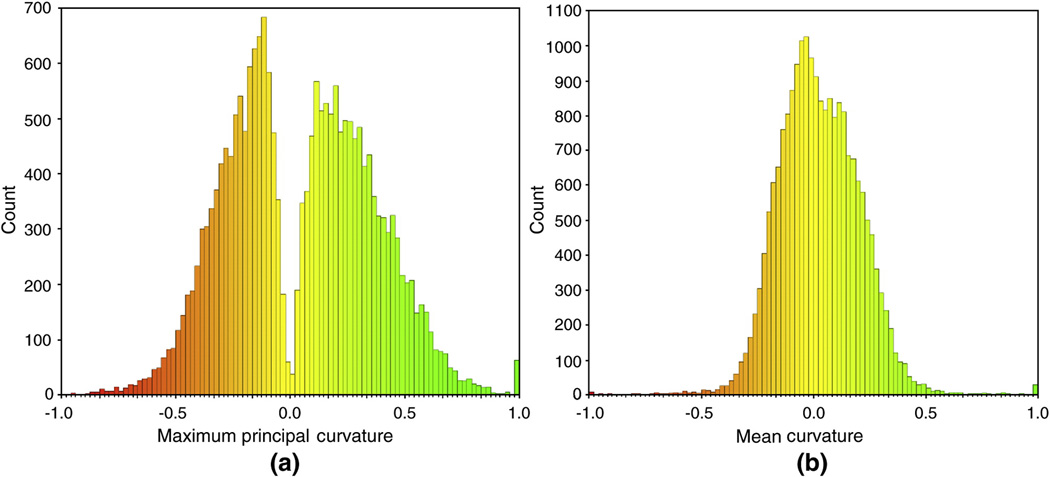
As mentioned before, e.g. in Figure 3, the maximum principal curvatures are negative at sulcal regions and positive at gyral regions. Therefore, we model the histogram distribution of maximum principal curvatures using finite mixture Gaussian model. Herein we employ the maximum principal curvature as a feature for sulcal region segmentation, rather than previously used mean curvature (Yang and Kruggel, 2008; Shi et al., 2008) or sulcal depth (Lohmann, 2000; Rettmann et al., 2002; Kao, et al., 2007; Yang and Kruggel, 2008). Our justification is as follows. Mean curvature is calculated as the average of the maximum and the minimum principal curvatures. However, the minimum principal curvatures might be very small values at both, sulcal and gyral regions. Therefore, minimum principal curvatures might not be good features for distinguishing between sulcal regions and gyral regions. In comparison, the maximum principal curvatures are more discriminative than mean curvature for sulcal region segmentation. To demonstrate this point, Figure 4 shows an example of the histograms of maximum principal curvature and mean curvature of the same cortical surface shown in Figure 3 (a). Obviously, compared to the histogram distribution of mean curvature, which s more like a single Gaussian distribution (was also observed in Shi et al., 2008), it is much easier to determine the threshold for sulcal and gyral region segmentation from the histogram distribution of maximum principal curvature, which is observed as a distribution of two Gaussian mixtures. We did not adopt the sulcal depth as feature because: 1) the outer hull of cortical surface is not easy to define as the cortex could be concave; 2) both the sulcal regions and deep gyri in sulcal regions could be very deep, therefore, sulcal depth might not be able to distinguish them. In order to encode both statistical and spatial information into the Gaussian mixture model, we extended the hidden Markov random field and the expectation maximization framework, which is an elegant method originally developed for tissue segmentation in human brain MR volumetric images (Zhang et al., 2001), on cortical surfaces as follows.
Figure 4.
The histogram distributions of maximum principal curvature and mean curvature of the cortical surface as in Figure 3 (a). (a) is the histogram of maximum principal curvature; (b) is the histogram of mean curvature. It is apparent that the maximum principal curvature is more discriminative than mean curvature for distinguishing sulcal and gyral regions.
yi is the maximum principal curvature value and xi ∈ {0, 1} is the class label at vertex i, where 0 represents sulcal region and 1 represents gyral region. The problem of sulcal and gyral region segmentation is formulated as maximizing a posteriori (MAP) probability P(X | Y), where X = (x1,…, xn) and Y = (y1,…, yn) and n is the total vertex number on the cortical surface. According to the Bayes theory and MAP criterion (Zhang et al., 2001), the segmentation problem can be re-formulated as seeking the true class label X̂ = (x̂1,…, x̂n), which satisfies:
| (1) |
Given a label xi = l, the observed values of yi follow a Gaussian distribution with the parameter θ = (µl,σl). In the Gaussian hidden Markov random field (GHMRF) model, the distribution of yi dependent on the parameter θ and XNi is calculated as:
| (2) |
where xNi is the set of neighborhood of vertex i, L represents all of the possible labels and g(yi;θl) is a Gaussian function:
| (3) |
According to the Hammersley-Clifford theorem (Besag, 1974; Geman and Geman, 1984), a Markov random field (MRF) can equivalently be characterized by a Gibbs distribution:
| (4) |
Where Z is a normalizing constant and U(X) is the energy function computed as the sum of clique potential of all possible cliques:
| (5) |
where Vc (X) is a clique potential, and C represents all of the possible cliques. In the paper, a clique is defined as a vertex pair in which the vertices are neighbors and only cliques of a size up to two are considered, and the clique potential function is defined as:
| (6) |
where vi and vj are the spatial locations of a pair of vertex neighbors in a clique.
To estimate both of the class label and model parameters, we adopt the expectation maximization (EM) algorithm (Dempster et al., 1977). Basically, the EM algorithm is composed of two simultaneously running steps: estimate the unobservable data to form a complete data set using current parameters, and then estimate new parameters by maximizing the expected likelihood function for this complete data set. The HMRF-EM method for sulcal region segmentation on the cortical surface is summarized as follows:
Obtain the initial sulcal and gyral region segmentation results X(0) and estimate the initial model parameters θ(0);
- Estimate the class labels by MRF-MAP estimation
- Estimate the new model parameter θ( t+1 )
Where S indicates the set of all of the vertices on the cortical surface and the posterior distribution is calculated as Replace t with t + 1 and repeat steps 2–3 until the label change is small or enough iterations have been carried out.
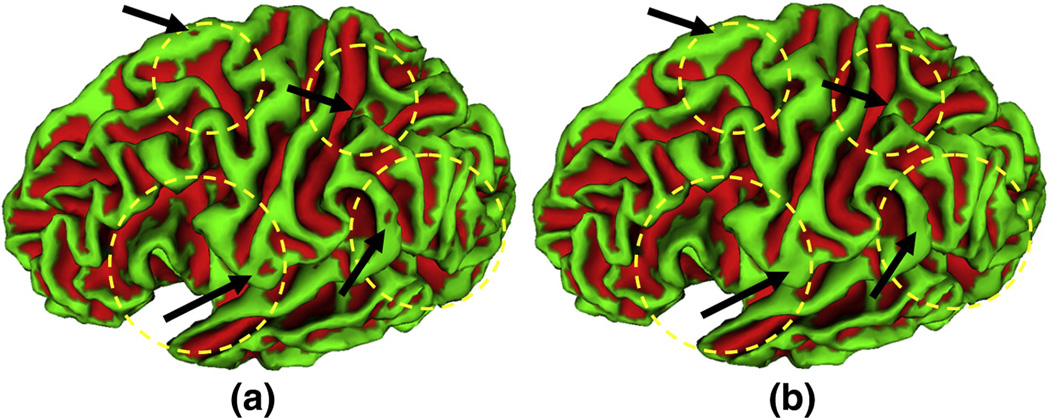
To determine the initial parameters for the mixture Gaussian models and obtain the initial gyral and sulcal region segmentation results, we adopt the Otsu threshold method (Otsu, 1979), which maximizes the inter-class variance and minimizes the intra-class variance. To apply the Otsu method, we linearly scale the maximum principal curvatures into 256 bins to calculate the histogram of the maximum principal curvatures. Then, we smooth the histogram by neighborhood weighted average. Finally, we use the Otsu method to determine the threshold for dividing gyral and sulcal regions. More details of the Otsu method are referred to (Otsu, 1979). The iterated conditional modes (ICM) (Besag, 1986) is employed for solving the equation in step 2. Figure 5 shows an example of initial and final sulcal region segmentation results, in which the HMRF-EM method eliminates some noise and sharp boundaries in the initial sulcal basin segmentation result. It is evident that the HMRF-EM method achieves reasonably good sulcal region segmentation results. After sulcal region segmentation, we use connective component analysis on the extracted sulcal regions to label each connective sulcal region as a unique value, which will be further used for sulcal basin segmentation.
Figure 5.
An example of initial and final sulcal region segmentation results on a cortical inner surface of a hemisphere. (a) is the initial sulcal region segmentation result using Otsu method. (b) is the final sulcal region segmentation result using the HMRF-EM method. The red color regions represent the extracted sulcal regions. The yellow circles and black arrows highlight exemplar regions in which sulcal segmentation results are obviously improved by the HMRF-EM method.
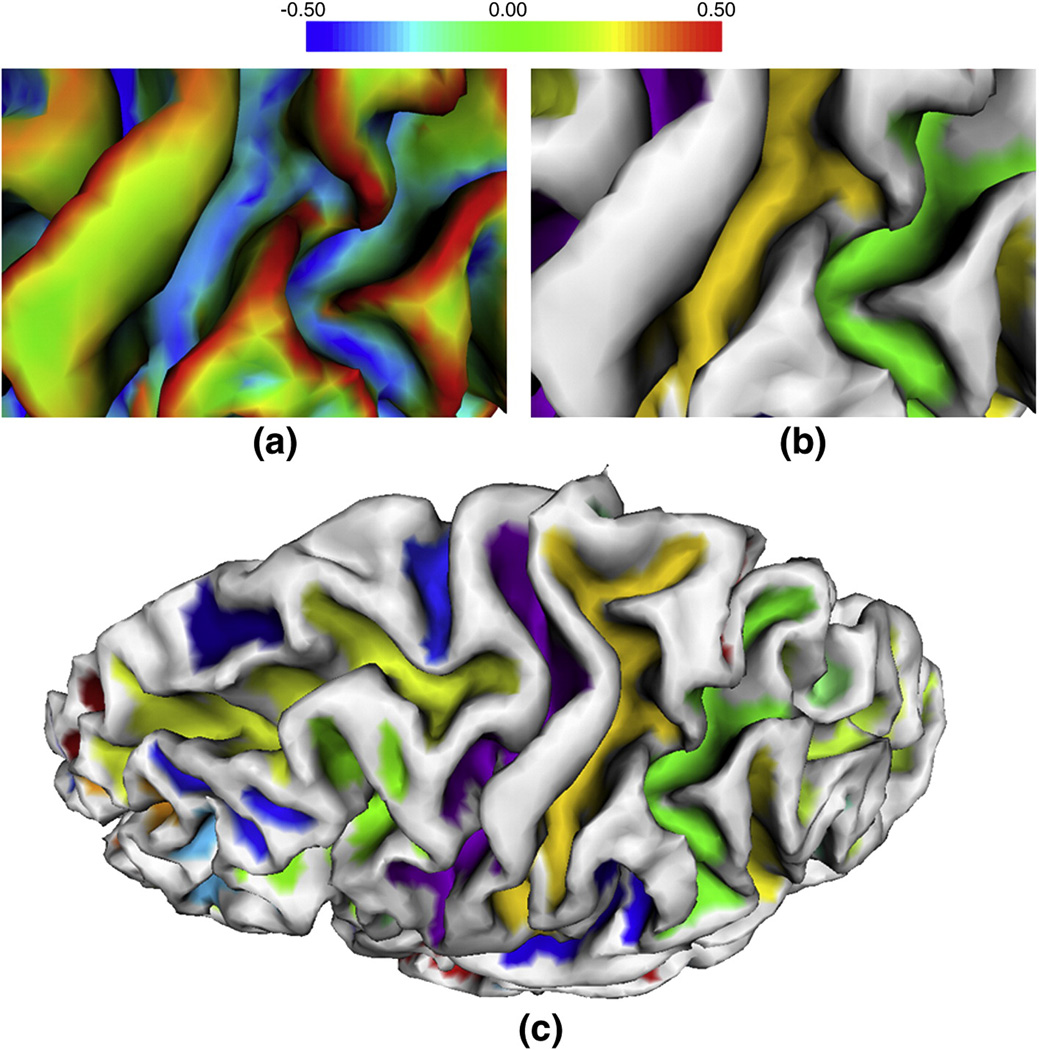
Notably, one characteristic of the HMRF-EM based sulcal region segmentation method is that it is able to handle deep gyri that connect two sulcal regions (Figure 6). This characteristic attributes to the adopted maximum principal curvature feature in the HMRF-EM method, because the deep gyri appear as areas of positive curvature in sulci (Cachia et al., 2003). Thus, the deep gyri will always be segmented as gyral regions in our method, provided the curvatures of deep gyral region are positive. However, this characteristic cannot be achieved by using the sulcal depth (Rettmann et al., 2002; Yang and Kruggel, 2008) as a feature, because both of the deep gyral regions and sulcal regions will be very deep. Figure 6 shows an example of sulcal region segmentation results around buried gyri. It can be seen that our proposed method can correctly extract the sulcal regions separated by deep gyri.
Figure 6.
An example of a sulcal region segmentation result around a deep gyrus on a cortical inner surface of a hemisphere. (a) and (b) are the zoomed maximum principal curvature map and the sulcal region segmentation result in the cortical surface region bounded by the red rectangle in (c) respectively. (c) is the sulcal region segmentation results on the cortical surface, in which each color indicates one sulcal region.
2.3 Principal direction field diffusion
After obtaining the sulcal regions, we adopt our recently developed methodology of flow field tracking (Li et al., 2007) for partitioning the cortical surface into sulcal basins. The central idea is as follows. As the estimated maximum principal directions point towards the maximum principal curvature decreasing directions and gyral crown regions and sulcal root regions have large positive and large negative maximum principal curvatures respectively, we follow the maximum principal directions from gyral crown regions until to sulcal root regions. The set of vertices converging to the same sulcal region are naturally grouped together, and thus we can segment the cortical surface into different sulcal basins. However, even with the state-of-the-art method for principal curvatures and principal directions estimation, the principal directions might be noisy and unreliable at flat cortical areas, where both of the two principal curvatures are very small. To deal with this issue, inspired by the gradient vector diffusion method for intensity images (Xu and Prince, 1998; Li et al., 2007), we designed a novel principal direction field diffusion method on the triangularized cortical surface to produce a smooth tangent flow field from the noisy principal direction field. The essential idea of this principal direction field diffusion method is as follows. By solving a variational equation at sulcal root and gyral crown regions where at least one of the two principal curvatures is large, the produced flow field should be close to the original principal direction field. At other flat cortical regions, the produced flow field should vary smoothly.
Given a triangularized smooth cortical surface with the estimated maximum principal curvatures and maximum principal directions, the tangent flow field v(x) = (u(x),v(x),w(x)) in the world coordinate is defined as the solution that minimizes an energy function:
| (7) |
with respect to: v(x) · n(x) = 0, where λ is a weighting parameter and ∇ is the gradient operator. p(x) is the maximum principal direction at vertex x and f(x) is a monotonically increasing function of the magnitude of maximum principal curvature at vertex x. In the paper, f(x) is set to be: f(x) = |c(x)|, where c(x) is the maximum principal curvature. Here, n(x) is the normal vector at vertex x, and S indicates the set of all of the vertices on the cortical surface. The formula v(x) · n(x) = 0 constrains the flow field in the tangent planes of the surface. According to the energy function at flat or uniform cortical regions, where the magnitudes of maximum principal curvatures are small, the energy is dominated by the first partial derivatives term to enforce that the flow field varies smoothly. While at regions with large magnitudes of maximum principal curvatures, corresponding to sulcal root and gyral crown regions with better reliability in the estimation of principal directions, the energy is dominated by the second term to enforce that the flow field is as close to the original principal direction field as possible. The parameter λ determines the tradeoff between the first smoothing term and the second fidelity term. We set λ as 0.1 in all of our experiments and the optimal setting of the parameter λ will be investigated in our future research work.
To minimize the above energy function in Eq. (7), we use calculus of variation to obtain the following partial differential equation (PDE):
| (8) |
Above PDE is solved by treating v as a function of time:
| (9) |
where vt(x,t) denotes the partial derivative of v(x,t) with respect to time t. The equation can be further decoupled as:
| (10) |
In the paper, we employed a method described in Wardetzky et al., 2007 to estimate the discrete Laplacian term ∇2u(x) on the surface mesh as follows:
| (11) |
where xi is the one-ring adjacent vertices of x, and wx,xi is the weighting coefficient calculated as the reciprocal of distance between vertex x and xi. Similarly, ∇2v(x) and ∇2w(x) is estimated in this manner.
The algorithm of principal direction field diffusion for producing smooth tangent flow field is summarized as follows:
According to v(x, t) ( t = 0, 1, 2… ), solve the decoupled PDE equations to obtain the diffused principal direction field v(x, t + 1);
Project v(x, t + 1) into the tangent plane;
Normalize the projected v(x, t + 1);
Replace v(x, t) with the normalized and projected v(x, t + 1) and repeat steps 1–3 until enough iterations have been carried out.
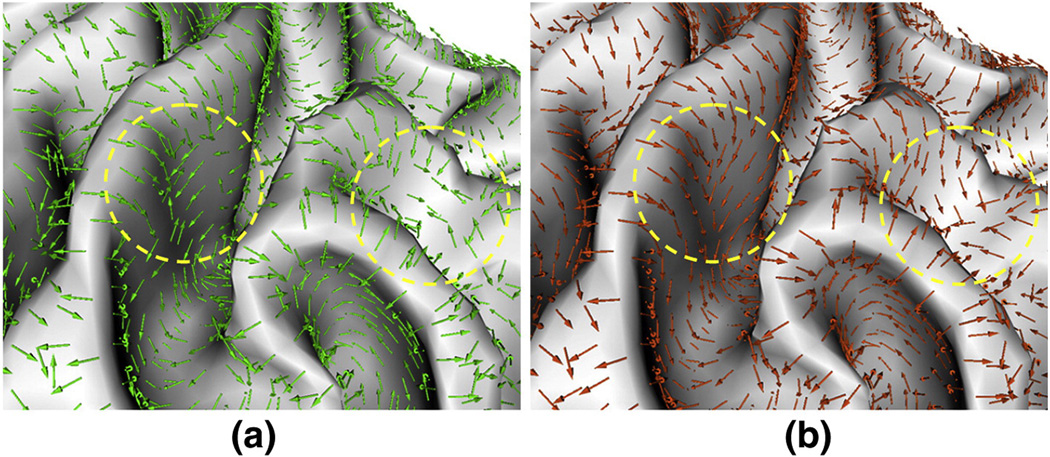
As an example, in Figure 7, we demonstrate a comparison between the original principal direction field and the flow field produced by the proposed principal direction field diffusion method on a cortical surface shown in Figure 3 (a). Apparently, in the diffused principal direction field, vectors flow much more smoothly from gyral crown regions towards sulcal root regions compared to the vectors in the original principal direction field. This elegant property greatly contributes to the success of the sulcal basin segmentation based on flow field tracking as described later.
Figure 7.
An example of principal direction field diffusion on a cortical region cropped from the cortical surface shown in Figure 3 (a). (a) is the original principal direction field. (b) is the diffused principal direction field. The green and orange arrows represent the original principal directions and diffused principal directions respectively. The yellow circles highlight two regions in which the vectors flow much more smoothly towards sulcal root regions in the diffused principal direction field compared to the vectors in the original principal direction field.
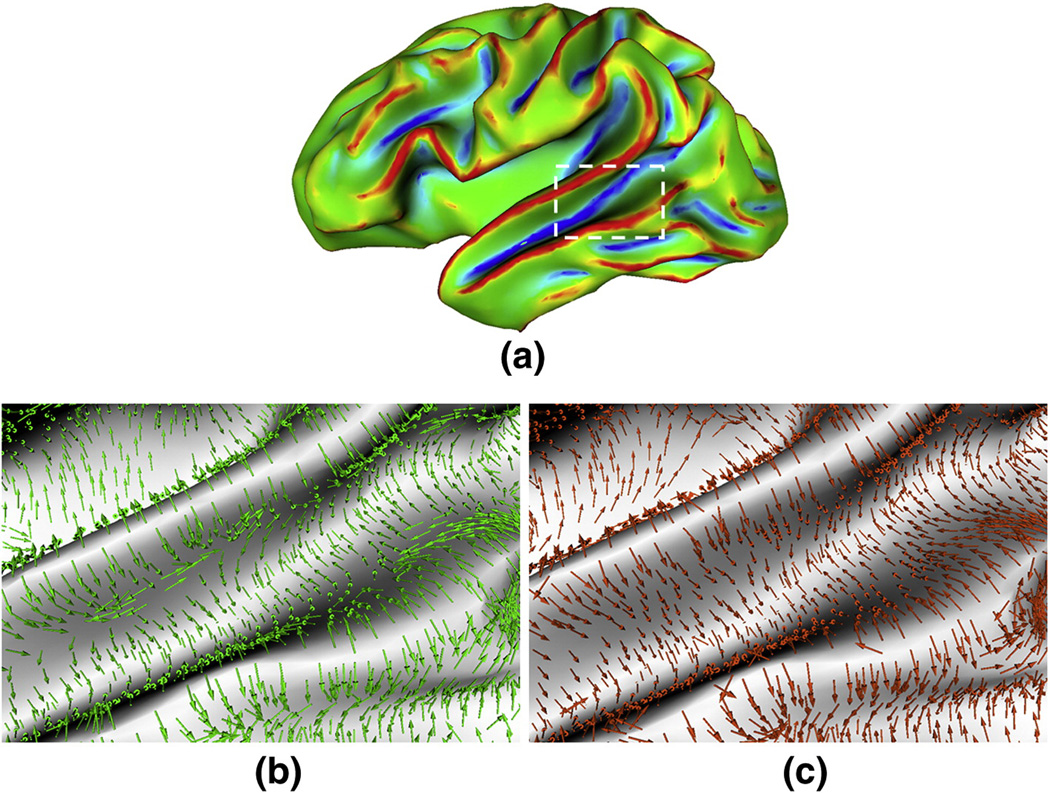
To further demonstrate the validity of the principal direction field diffusion method, we have applied the method to a partially inflated cortical surface obtain by a method similar to (Tosun et al., 2004), since the behavior of the principal direction field can be easily observed in inflated cortical surface in contrast to the original complex convoluted cortical surface. Figure 8 shows a comparison between the original principal direction field (Fig. 8(b)) and the flow field produced by the proposed principal direction field diffusion method (Fig.8 (c)) on a partially inflated cortical surface. Clearly, in the diffused principal direction field, vectors flow much more smoothly from gyral crown regions towards sulcal root regions.
Figure 8.
An example of principal direction field diffusion on a partially inflated cortical surface. (a) is the partially inflated cortical surface. (b) is the original principal direction field in the bounded rectangular region in (a). (c) is the diffused principal direction field in the bounded rectangular region in (a). The green and orange arrows represent the original principal directions and diffused principal directions respectively.
2.4 Sulcal basin segmentation based on the flow field tracking
After the principal direction field diffusion, we adopt our recently developed flow field tracking method (Li et al., 2007) to partition the cortical surface into different sulcal basins. In the diffused principal direction field, the vectors on the tangent plane flow smoothly toward the sinks of the field, which correspond to sulcal root regions on the cortical surface. To follow the vectors until they stop at the sulcal root regions, the flow field tracking procedure on the cortical surface is performed as follows. From a given vertex x with the diffused principal direction v(x), the next vertex x′ that x flows through in the flow field is computed as:
| (12) |
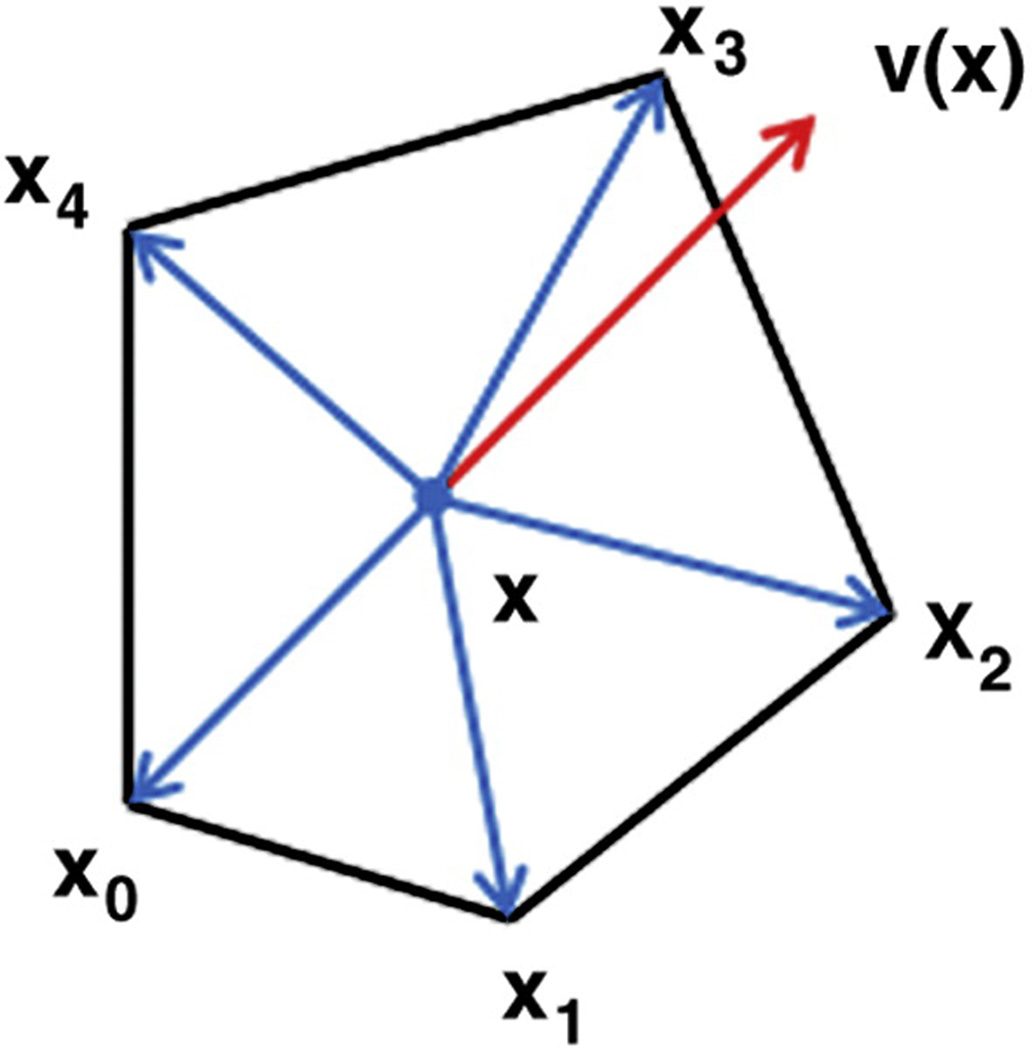
where xi is the one-ring adjacent vertices of x. It means that the next vertex x′ is the vertex in the one-ring neighborhood of x which minimizes the angle between vector v(x) and the direction of edge . Figure 9 provides an illustration of how to determine the next vertex x′ that current vertex x flow through in the flow field.
Figure 9.
An illustration of how to determine the next vertex x′ that current vertex x flows through in the flow field. The red arrow is the flow vector at vertex x, and the blue arrows represent the edges formed by vertex x and its adjacent vertices.
The angle between these two consecutive vectors in the flow path is determined as:
| (13) |
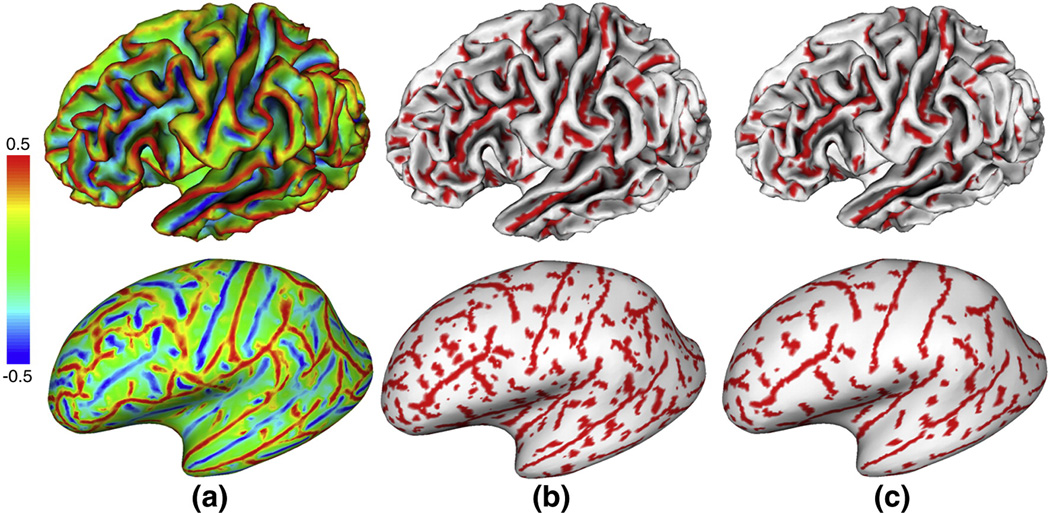
When the angle between two consecutive vectors is less than π / 2 or the inner product between two consecutive vectors is positive, the flow tracking procedure continues. Otherwise, two consecutive vectors will point to each other and the inner product between them will be negative, which is a necessary condition for valley detection in the triangularized surface mesh (Thirion, 1996; Ohtake et al., 2004; Li et al., 2008), and the flow tracking procedure will be stopped. As a result, a sulcal root region is reached. In this way, the vectors at vertices along the flow tracking trajectory define a smooth path leading to a sulcal root region. The set of vertices, which flow to the same sulcal root region, are called the attraction basin of the sulcal root region. In practice, the partition of cortical surface into different sulcal basins can be achieved by starting this flow tracking procedure from each vertex on the cortical surface. All the vertices converging to the same attraction basin are grouped into the same sulcal basins. As all vertices are tracked independently, the sulcal basins can be of arbitrary shape. Figure 10 provides a comparison of the termination vertices on flow tracking trajectories before and after principal direction diffusion on a cortical surface. For the convenience of inspection, Figure 10 also shows the termination vertices on inflated surfaces, which are generated via a method similar to (Tosun et al., 2004). Clearly, after the diffusion procedure, some noisy termination vertices of flow tracking at flat cortical regions are removed effectively. Meanwhile, the termination vertices at sulcal root regions are well preserved. This further demonstrates that the principal direction diffusion procedure is quite important for producing robust and reliable sulcal basin segmentation.
Figure 10.
A comparison of the termination vertices on flow tracking trajectories before and after principal direction field diffusion on a cortical inner surface. The top row images show the cortical surfaces and the bottom row images show the corresponding inflated surfaces. (a) is the maximum principal curvature map. The red color vertices in (b) and (c) are the set of termination vertices of flow tracking on the original principal direction field and the diffused principal direction field respectively. As we can see, after the diffusion procedure, some noisy flow tracking termination vertices at flat cortical regions are removed effectively, while the termination vertices at sulcal root regions are well preserved. This figure further demonstrates the necessity of the principal direction diffusion procedure.
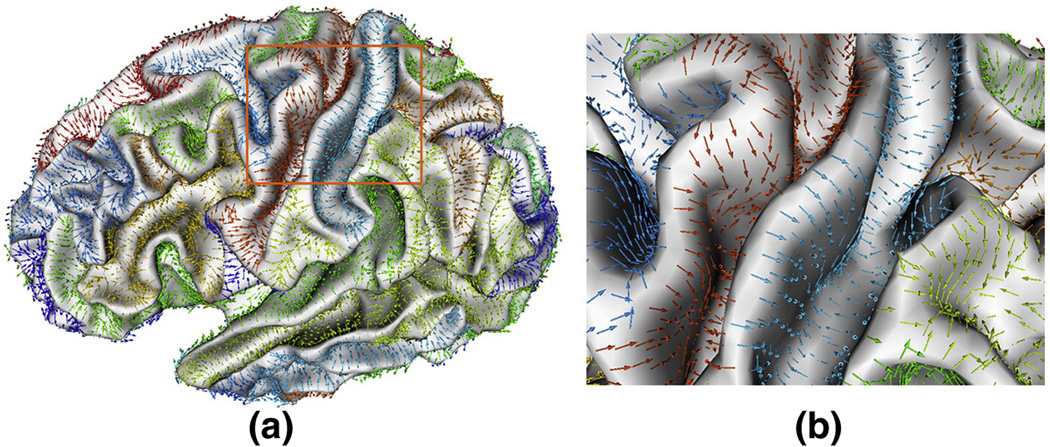
The flow field tracking procedure could be applied to each vertex on the cortical surface to achieve the sulcal basin segmentation. However, it is time-consuming to run the flow tracking procedure for every vertex. Actually, it is not necessary to apply the flow field tracking to the vertices that have already been on the flow trajectories of any previously passed vertices. Instead, these visited vertices can be directly associated with the sulcal root region to which the path flows. This improvement not only speeds up the method, but also yields reproducible segmentation results. Figure 11 shows an example of vector view of the flow field tracking result on a cortical surface, in which the set of vectors flowing to the same sulcal region are labeled with the same color.
Figure 11.
An example of vector view of the sulcal basin parcellation result on a cortical surface, in which the set of vectors in the same sulcal basin are randomly labeled with the same color. (a) is the vector view of sulcal basins segmentation result. (b) is the zoomed view of the bounded region in the orange rectangle in (a). As we can see, the flow field tracking method naturally partitions the cortical surface into different sulcal basins.
The algorithm of the flow field tracking on the cortical surface is summarized as follows:
Start from a new vertex x (not passed on previous trajectories) as the initial vertex x0;
Obtain xn+1 ( n = 0, 1, 2…) using Eq. (12) and xn;
Calculate the angle θn of the diffused vectors between xn+1 and xn with Eq (13). If θn is larger than π / 2, stop. Otherwise, if the xn+1 is already on a flow path, associate vertices from x0 to xn to the corresponding termination vertex of xn+1, stop.
Replace xn with xn+1. Return to step 2.
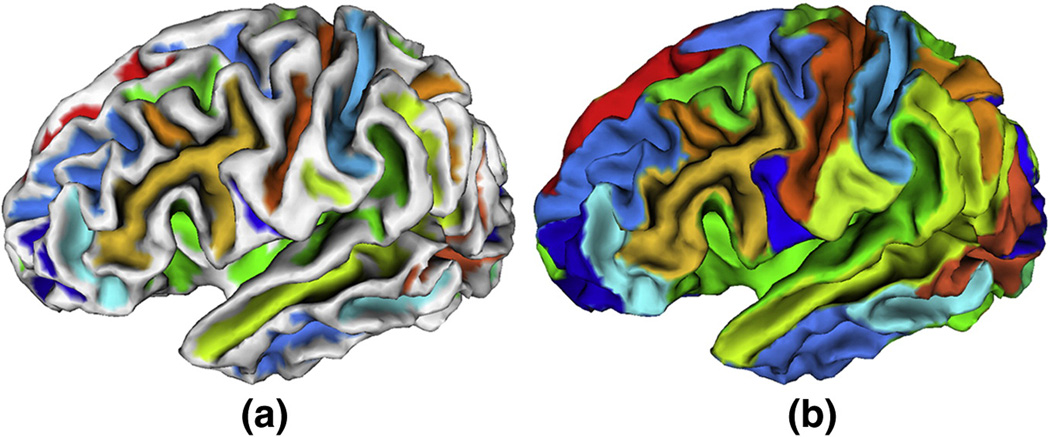
After applying the flow field tracking method to the cortical surface, we obtain a set of regions, in which each one corresponds to a sulcal region. However, due to the high complexity of cortical surface and inevitable numerical computation errors, we may have some very small regions. Thus, if necessary, we prune these small regions and combine them with adjacent regions. To perform the region merging, we build the region adjacent matrix to record the boundary strength between each pair of regions. The boundary strength is defined as the average maximum principal curvature of vertices on the boundary between two regions. If a region is very small, we combine this region to its adjacent region with the smallest boundary strength between them. Figure 12 shows an example of the final sulcal region and sulcal basin segmentation result on a cortical surface.
Figure 12.
An example of sulcal region and sulcal basin segmentation results on a cortical surface. (a) is the sulcal region segmentation result, in which each sulcal region is labeled with a unique color. (b) is the corresponding sulcal basin segmentation result. Some small regions have been merged into adjacent regions.
3. Results
In this section, a set of experiments are conducted to evaluate the proposed sulcal region and sulcal basin segmentation method. Unless otherwise specified, all the topologically correct and geometrically accurate cortical surfaces used in this section and in the whole paper were reconstructed by the BrainVISA software (Cointepas et al., 2001) using the method (Mangin, et al., 1995). The datasets we used were described in our previous publication in (Liu et al., 2006).
3.1 Visual evaluation
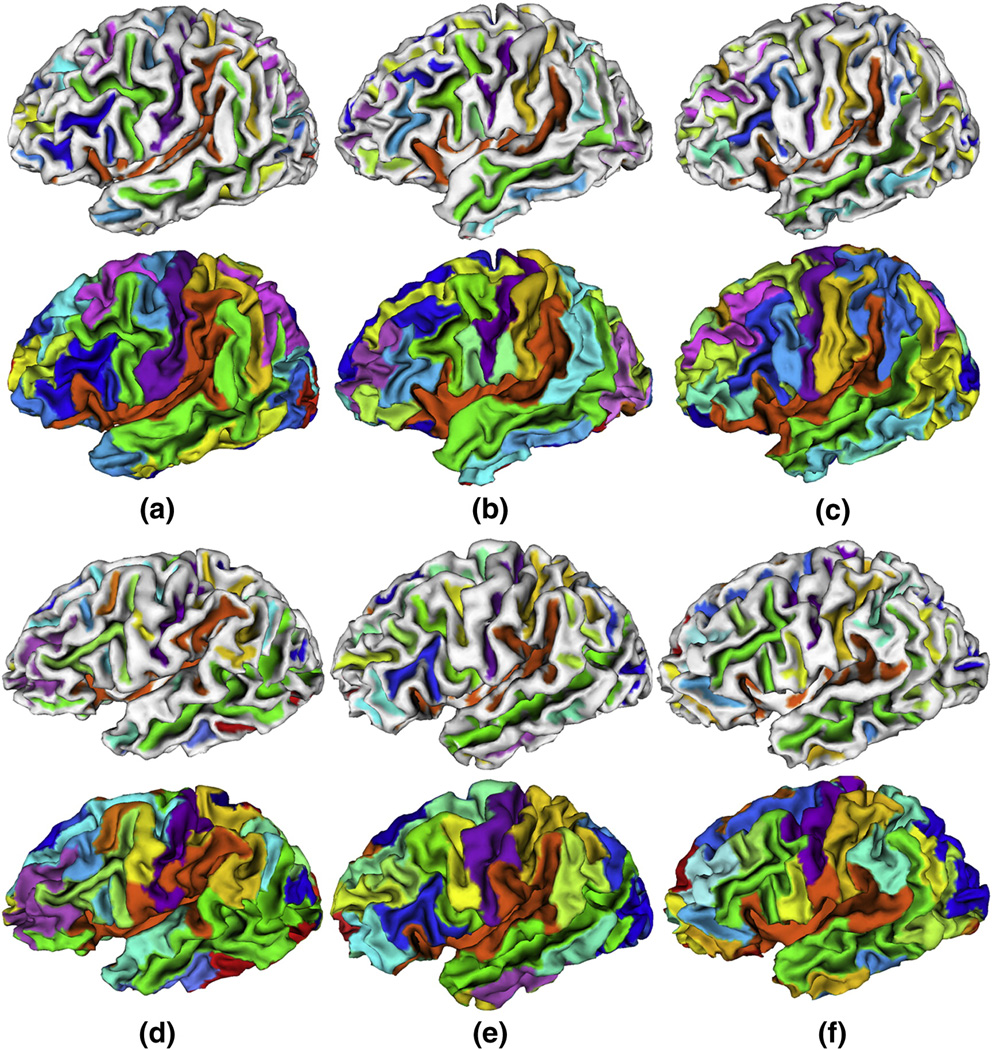
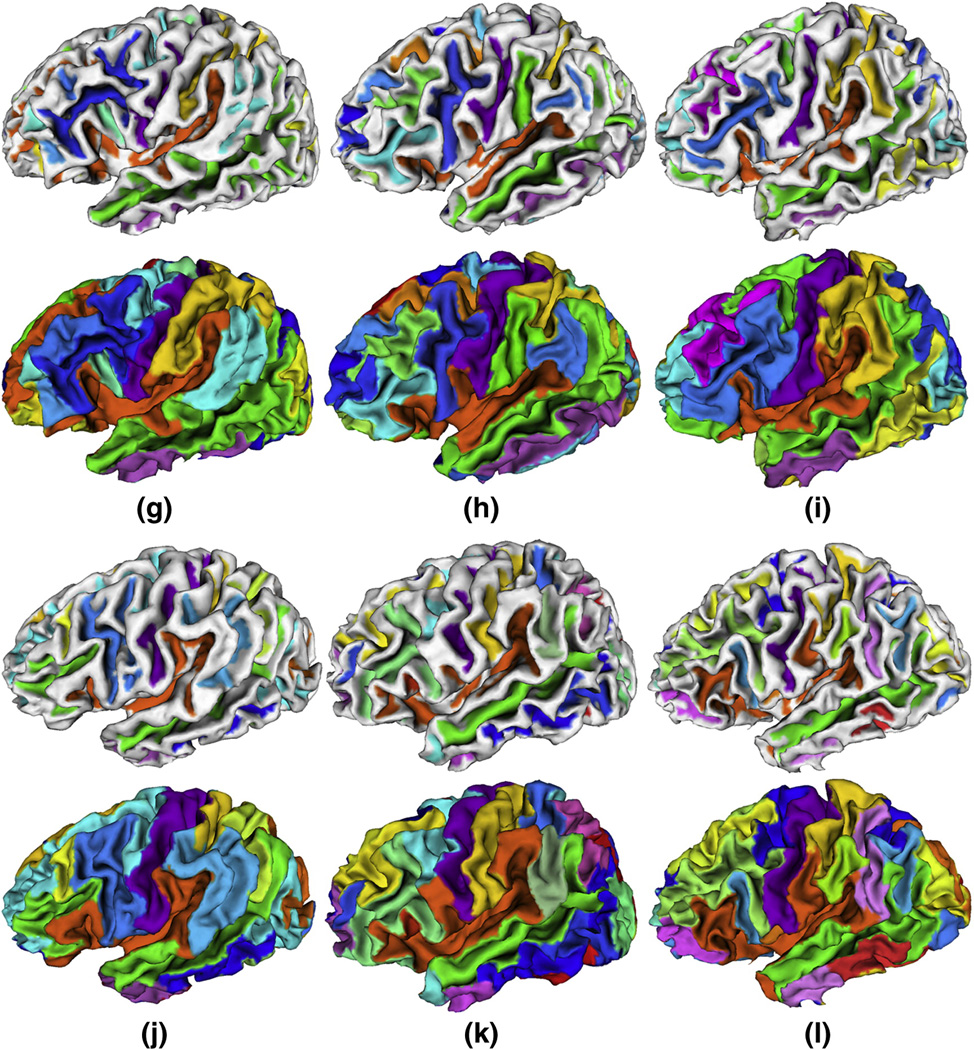
We have applied the method to T1 weighted MR images of twelve normal subjects. On average, the inner cortical surface of a hemisphere comprises around 25000 vertices and 50000 triangles. Figure 13 shows the sulcal region and sulcal basin segmentation results on the inner cortical surfaces of the left hemisphere of the twelve subjects. It is striking that all of the twelve cortical surfaces are consistently segmented into anatomically meaningful sulcal regions and basins by the proposed method. For example, the segmentations of the central and superior temporal sulcal basins in these twelve subjects, represented by purple and green colors respectively, are quite visually reasonable. Currently, we have not reached the stage of automatic recognition of these segmented sulcal regions and basins yet. Thus, each sulcal region and basin in each subject is randomly assigned a color in Figure 13, except that the colors for the central and superior temporal sulcal regions and sulcal basins of these twelve subjects are interactively identified by experts for visualization purpose.
Figure 13.
Sulcal region and sulcal basin segmentation results on the cortical surface of the left hemispheres of twelve normal subjects. For each case, the top row image shows the sulcal region segmentation result, and the bottom row image shows the sulcal basin segmentation result. Each sulcal region and its corresponding sulcal basin are labeled with the same color in each cortical surface. It is noted that anatomically corresponding sulcal regions and sulcal basins in different cases may have different colors because the colors are randomly assigned, except the colors for the central and superior temporal sulcal regions and sulcal basins of these twelve subjects that are interactively identified by experts for visualization purpose.
3.2 Quantitative evaluation
To quantitatively evaluate the sulcal region segmentation results, we use two metrics: the over-segmentation and under-segmentation, which were also adopted in (Yang and Kruggel, 2008) for validation of sulcal region segmentation. The over-segmentation denotes that a sulcal region has been wrongly separated into more than one sulcal region, compared to visual inspection by an expert. The under-segmentation denotes that multiple adjacent sulcal regions have not been appropriately divided. In this paper, we use three major sulci, including central, post-central and superior temporal sulci for validation. In the left hemispheres of the 12 subjects, all of the central and superior temporal sulcal regions are segmented correctly. Therefore, there is no over-segmentation and under-segmentation error. There exists only one over-segmentation error and one under-segmentation error in the post-central sulcal regions of the 12 hemispheres. Since the sulcal basins are extracted based on the sulcal regions and one sulcal basin corresponds to one sulcal region, we have the same performance for sulcal basin segmentation in these 12 subjects. In conclusion, those results indicate quite good performance of our sulcal region and sulcal basin segmentation method.
To further quantitatively evaluate the sulcal basin segmentation results, we have two experts who manually annotated the central sulcal basins, sylvian fissure and calcarine sulcal basins on the inner cortical surfaces of left hemispheres of the twelve subjects, and treat the manual segmentation as the standard. These three sulci were selected because they are quite stable across individuals, as recommended in (Van Essen, 2005). We applied the area overlap measurement between automatically extracted and manually labeled sulcal basins to validate the proposed method. The area overlap is defined as:
| (14) |
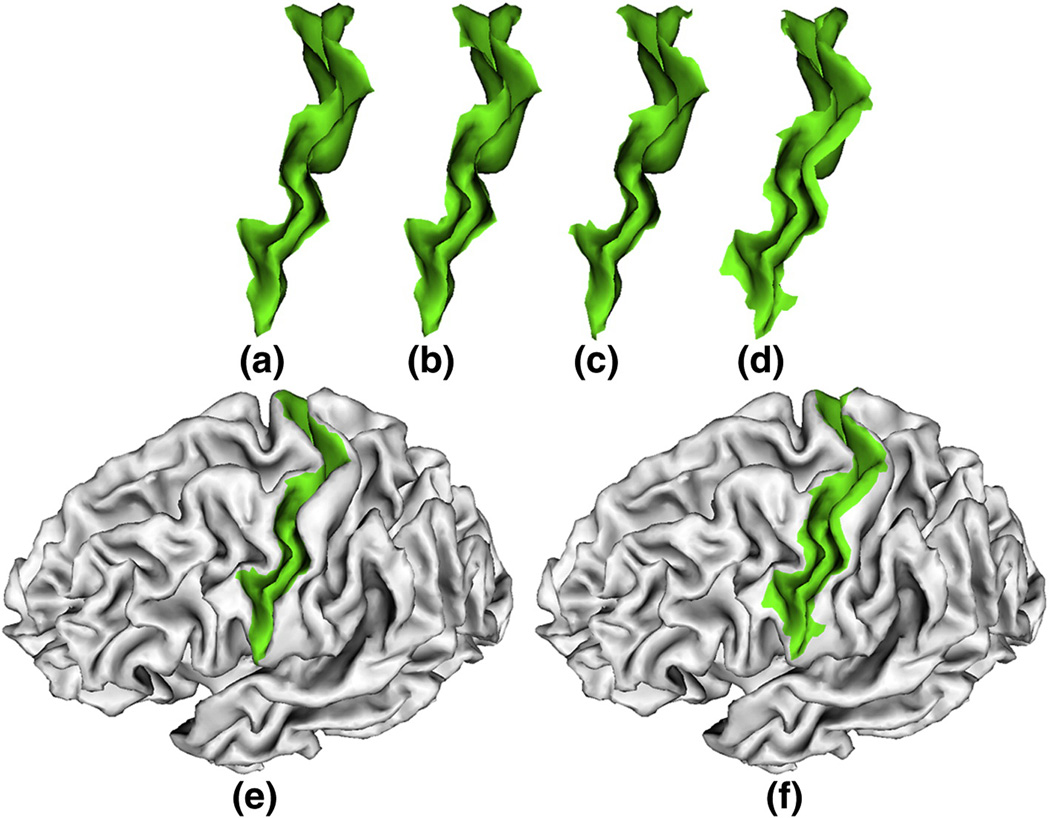
where Ra is the automatically extracted sulcal basin and Rm is the manually labeled sulcal basin. The ∩ operator takes the intersection of the two regions. S(.) is the area of the region. Table 1 shows the details of the area overlap measurement for the central sulcal basins, sylvian fissure and calcarine sulcal basins on left hemispheres of the twelve subjects. The average area overlap of the three sulci for the twelve subjects is around 0.96 for both experts, indicating the relatively accurate performance of our sulcal basin segmentation method. Figure 14 shows an example of comparison of the automatically extracted and manually labeled central sulcal basins on a cortical surface.
Table 1.
The area overlap measurement of the central sulcal basins, sylvian fissure and calcarine sulcal basins on left hemispheres of the twelve subjects.
| Subject | Central sulcal basin |
Calcarine sulcal basin |
Sylvian fissure |
|||
|---|---|---|---|---|---|---|
| Expert 1 | Expert 2 | Expert 1 | Expert 2 | Expert 1 | Expert 2 | |
| 1 | 0.961 | 0.962 | 0.919 | 0.937 | 0.975 | 0.956 |
| 2 | 0.968 | 0.968 | 0.977 | 0.976 | 0.978 | 0.979 |
| 3 | 0.974 | 0.967 | 0.967 | 0.966 | 0.953 | 0.953 |
| 4 | 0.971 | 0.966 | 0.964 | 0.966 | 0.949 | 0.954 |
| 5 | 0.968 | 0.957 | 0.970 | 0.972 | 0.978 | 0.974 |
| 6 | 0.955 | 0.953 | 0.971 | 0.967 | 0.978 | 0.979 |
| 7 | 0.966 | 0.952 | 0.970 | 0.966 | 0.962 | 0.960 |
| 8 | 0.956 | 0.944 | 0.976 | 0.975 | 0.976 | 0.970 |
| 9 | 0.967 | 0.958 | 0.965 | 0.960 | 0.981 | 0.979 |
| 10 | 0.977 | 0.969 | 0.932 | 0.932 | 0.967 | 0.965 |
| 11 | 0.967 | 0.971 | 0.966 | 0.965 | 0.966 | 0.967 |
| 12 | 0.969 | 0.972 | 0.947 | 0.936 | 0.929 | 0.932 |
| Average | 0.967 | 0.962 | 0.960 | 0.960 | 0.966 | 0.964 |
Figure 14.
A comparison of the automatically extracted and the manually labeled left central sulcal basins on a cortical surface. (a) and (b) are the manually labeled sulcal basins by two experts. (c) is the automatically extracted sulcal basin by our proposed method. (d) is the automatically extracted sulcal basin by watersheds based method. (e) is the (c) overlaid on the cortical surface. (f) is the (d) overlaid on the cortical surface. As we can see, the automatically extracted and manually labeled sulcal basins are quite similar. The automatically extracted sulcal basin by our proposed method is slightly better than that of the watersheds based method. For more details, please see section 3.4.
3.3 Reproducibility
In order to evaluate the reproducibility of the proposed method, we employ simulated T1-weighted normal brain images with different noise levels obtained from the BrainWeb website (Cocosco et al., 1997). We generated three simulated images with 1mm slice thickness, 20% intensity non-uniformity, and 181 × 217 × 181 voxel resolution. The noise levels of the three images are set as 3%, 5% and 7%, respectively. The topologically correct and geometrically accurate cortical surfaces, in this section, were generated by the method described in (Liu et al., 2004), which is a marching cubes (Lorensen and Cline, 1987) based method. As each simulated brain image has its own independently reconstructed cortical surface with different vertices and triangle faces, it is not convenient to evaluate the results using area overlap measurement. Instead, we calculated the area agreement of several major sulci, including central, post-central and superior temporal sulci on the inner cortical surface of left hemisphere between each pair of the images. The area agreement is computed as:
| (15) |
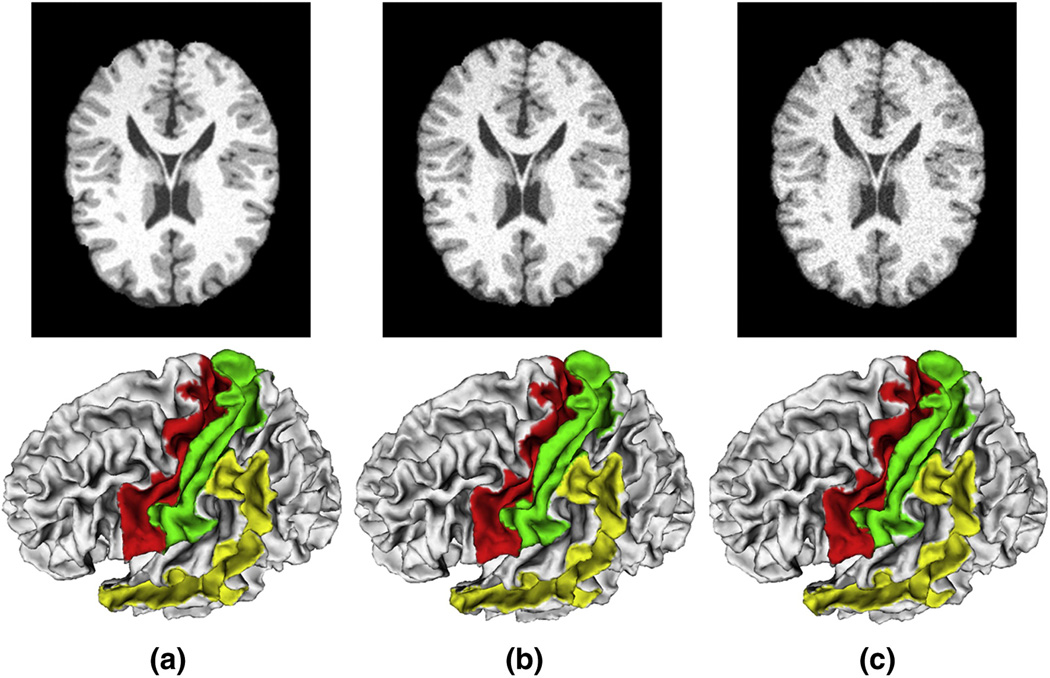
where Sa and Sb refer to the areas of the sulcal basins or sulcal regions obtained by the proposed method on different images. This definition implies that similar segmentation result produces higher area agreement. Table 2 shows the detail results of area agreement measurement of three major sulci on the three simulated images. The average area agreement of the three sulci is very close to 1.0, indicating the good reproducibility of our sulcal region and sulcal basin segmentation method. Figure 15 shows the three simulated images and their corresponding three major sulci segmentation results on the left hemispheres.
Table 2.
The area agreement measurement of three selected sulci on the three simulated human brain MR images. Scan 1, 2 and 3 indicate the three simulated images with noise levels of 3%, 5% and 7%, respectively. We calculated the area agreement between each pair of scans.
| Area agreement | Central sulcus | Post-central sulcus | Superior temporal sulcus | |||
|---|---|---|---|---|---|---|
| Sulcal region |
Sulcal basin |
Sulcal region |
Sulcal basin |
Sulcal region |
Sulcal basin |
|
| Scan 1—Scan 2 | 0.971 | 0.997 | 0.968 | 0.996 | 0.991 | 0.987 |
| Scan 1—Scan 3 | 0.962 | 0.981 | 0.997 | 0.990 | 0.996 | 0.995 |
| Scan 2—Scan 3 | 0.991 | 0.984 | 0.965 | 0.995 | 0.995 | 0.982 |
| Average | 0.974 | 0.987 | 0.976 | 0.993 | 0.994 | 0.988 |
Figure 15.
Three simulated T1 weighed human brain MR images and their corresponding sulcal basin segmentation results. The top row shows the simulated images with the noise levels of 3%, 5% and 7%, respectively. The bottom row shows the corresponding sulcal basin segmentation results. The red, green and yellow color regions represent central, post-central, superior temporal sulcal basins respectively.
To further validate the reproducibility of the proposed method, we adopt the Alzheimer’s Disease Neuroimaging Initiative (ADNI) dataset, in which each subject was scanned twice at the same times point. We randomly chose one subject, which is 86 years old male in normal control group, for validation. The subject was scanned on GE medical systems with the imaging protocol: slice thickness 1.20 mm, acquisition plane sagittal, matrix size 256 × 256 × 166, pixel spacing 0.9375 × 0.9375. Table 3 shows the results of area agreement measurement of three major sulci on both hemispheres of the subject. The area agreements for the three sulci are consistently larger than 0.98, indicating the good reproducibility of the proposed segmentation method. All those results also demonstrate that our sulcal segmentation method has good performance not only on cortical surfaces reconstructed by the BrainVISA, but also on the cortical surfaces reconstructed by other available software or methods, e.g., the methods in (Liu et al., 2004). Our future work involves investigating its performance on cortical surfaces reconstructed by other methods such as the ones in Dale et al., 1999, Shattuck and Leahy, 2002, and Han et al., 2004.
Table 3.
The area agreement measurement of three selected sulcal basins on a subject from ADNI dataset.
| Area agreement | Central sulcus | Post-central sulcus | Superior temporal sulcus | |||
|---|---|---|---|---|---|---|
| Sulcal region |
Sulcal basin |
Sulcal region |
Sulcal basin |
Sulcal region |
Sulcal basin |
|
| Left hemisphere | 0.985 | 0.984 | 0.989 | 0.984 | 0.995 | 0.991 |
| Right hemisphere | 0.990 | 0.982 | 0.992 | 0.998 | 0.992 | 0.996 |
3.4 Comparison
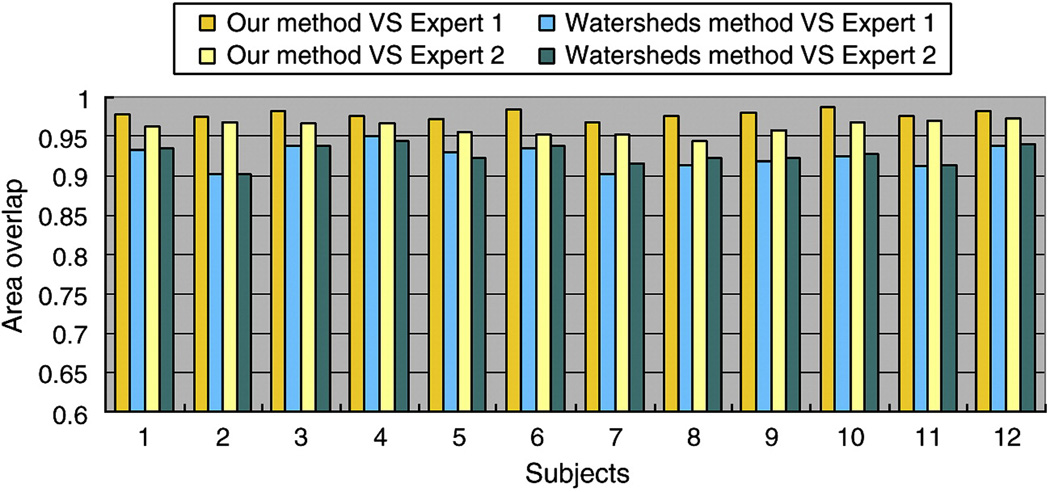
To further evaluate and validate the proposed method, we compare our method with the watersheds based method described in Rettmann et al., 2002, in which the sulcal geodesic depth was adopted as the feature for sulcal segmentation. We chose the central sulcal basins on left hemispheres of the twelve subjects for comparison. We adjusted the merging parameters in the watersheds based method to ensure that there exists no over-segmentation error for the twelve central sulcal basins. Then, we compare the segmentation results with two manually annotated central sulcal basins by experts using area overlap measurement. The detailed comparison results are showed in Figure 16. For the watersheds based method, in comparison with both experts, the average area overlap for the twelve central sulcal basins is around 0.925. This result shows that the watersheds based method can achieve good segmentation results. However, considering the average area overlap of 0.96 in our method, the proposed method in this paper obtains better results than the watersheds based method. Also, the proposed method performs consistently better than the watersheds based method in all of the twelve subjects, as shown in Figure 16.
Figure 16.
The comparison of area overlap measurement between the watersheds based method and our proposed method on twelve left central sulcal basins.
3.5 Implementation
Currently, our cortical sulcal parcellation method is implemented using the C/C++ programming language. On a typical Intel Core2 1.86GHz machine with 2GB memory, on average, it takes around 50 seconds to accomplish the sulcal region and sulcal basin segmentation on the inner cortical surface of a hemisphere. The running time might be further reduced significantly by code optimization in the future. The most time-consuming part in the method is the principal direction field diffusion step, which takes around 30 seconds out of 50 seconds. However, the implementation of this step might be optimized in the future to reduce the computing time.
4. Discussion and Conclusion
In this paper, a novel method for sulcal region and sulcal basin segmentation on the cortical surface is proposed. The method has been applied to twelve normal human brain MR images and three simulated human brain MR images. Our preliminary results in Section 3 demonstrate that the proposed method is able to segment sulcal region and sulcal basin on the cortical surface accurately and effectively.
In the literature, several methods have been proposed for sulcal region or sulcal basin segmentation. In comparison, our method uses both the maximum principal curvature and diffused maximum principal direction information in an effective way. Essentially, the principal direction field diffusion procedure propagates maximum principal direction from sulcal root and gyral crown regions, where the maximum principal directions are more reliable, to the areas with small maximum principal curvatures where the maximum principal directions tend to be noisy. As a result, the inherently noisy principal direction field is smoothed, while the diffused principal direction field still preserves the major geometric structural information of the principal direction field. This property greatly contributes to the success of the sulcal basin segmentation. Another difference of the proposed method compared to existing methods is that we adopt the maximum principal curvature rather than commonly used mean curvature (Yang and Kruggel, 2008; Shi et al., 2008). Our analysis and result demonstrates that the maximum principal curvature is a quite discriminative feature for sulcal region segmentation. As we mentioned before, one characteristic of the HMRF-EM based sulci segmentation method is that it is able to handle deep gyri that connect two different sulcal regions. However, there is one potential risk for the method. Some deep gyri might exist in a single sulcus, for example, a central sulcus contains a deep gyrus. In this situation, our method will extract the deep gyrus and interrupt the central sulcus into two parts. To further improve our method, we are currently working on automatic recognition of the segmented sulci, as the recognized sulci can guide us to effectively merge wrongly interrupted sulci.
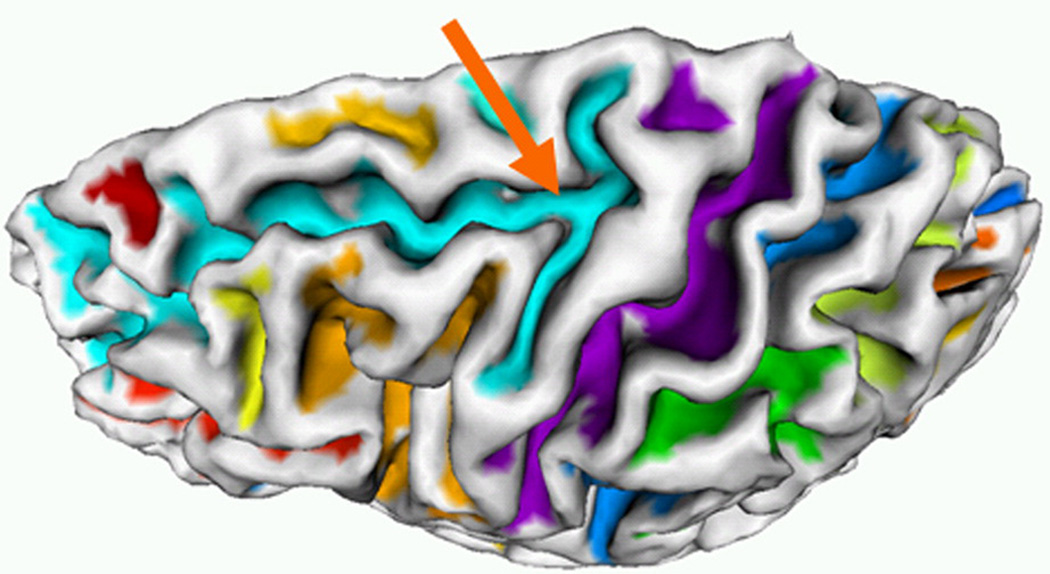
Typically, adjacent sulci are separated by gyri or buried gyri. However, it is possible that some sulci are inherently connected together (Ono et al., 1990). Therefore, there are no gyri or buried gyri separating them. In this situation, two connected sulcal regions will be segmented as one sulcal region using the HMRF-EM method. Figure 17 shows an example of two sulcal regions (superior-frontal sulcus and precentral sulcus) connecting together, as highlighted by the orange arrow. Actually, this is a common problem faced by all existing methods for sulcal region segmentation. To deal with this problem, one might need to develop additional automatic methods or employ semi-automatic methods to interrupt wrongly connected sulci, e.g., that described in (Rettmann et al., 2005), which separates two connecting sulcal regions by generating a curve on the surface by the fast marching method on manifolds (Kimmel and Sethian, 1998).
Figure 17.
An example of two sulcal regions connecting together on a cortical surface. The orange arrow points to the connecting sulcal regions.
An alternative approach for segmentation of cortical structures, e.g., sulci and gyri, is atlas-based warping, in which one-to-one correspondence between the subject image and an atlas is determined by spatial registration methods (e.g., Thompson, 1996; Shen and Davatzikos, 2002; Liu et al., 2004). In these atlas-based warping methods, the labeled cortical structure in the atlas can be transformed into the subject image space (Shen and Davatzikos, 2002; Liu et al., 2004). However, due to the complexity and remarkable inter-individual variability of human cerebral cortex, spatial registration of human brain images still remains as a challenging and open problem (Mangin et al., 2004c), even though a wide variety of spatial registration methods have been developed in the literature (Bajcsy et al., 1983; Evans et al., 1991; Thirion et al., 1992; Gee et al., 1994; Collins et al., 1994; Wells et al., 1996; Sereno et al., 1996; Joshi et al., 1996; Christensen et al., 1996; Woods et al., 1998; Thirion, 1998; Van Essen et al., 1998; Rueckert et al., 1999; Fischl et al., 1999; Shen and Davatzikos, 2002; Fischl et al., 2002; Crum et al., 2003;). In particular, it is quite challenging to register or establish one-to-one anatomical correspondence between different cortical folding patterns that are quite common in human cerebral cortex (Mangin et al., 2004c). Therefore, we hope that our proposed method for sulcal region and sulcal basin segmentation, in this paper, could serve as a preliminary step towards our ultimate goal of self-contained parcellation of the cerebral cortex into anatomically meaningful regions, without the need to perform inter-subject brain image registration. This self-contained cortical parcellation strategy will aim to develop a personalized brain coordinate system for each individual brain, while accounting for both brain variability and regularity. To reach such a goal, our future work includes the following steps. 1) Development of algorithms for automatic recognition of the segmented sulcal regions and basins. It has been reported in the literature that machine learning based method could achieve quite accurate recognition of brains structures (Lohmann and von Cramon, 2000; Fischl et al., 2004; Klein and Hirsch, 2005; Desikan et al., 2006). 2) Integration of cortical connectivity pattern information (Behrens et al., 2003; Perrin et al., 2008) for refinement of cortical parcellation. We expect that integration of brain connectivity pattern information inferred from diffusion tensor MR imaging data will contribute significantly to achieve more biologically meaningful parcellation of the cerebral cortex, as it was reported in (Passingham, et al., 2002) that each brain cytoarchitectonic area has a unique set of extrinsic inputs and outputs, and this is essential in determining the functions that the area can perform. 3) Integration of white matter parcellation (Maddah et al., 2008) with cortical parcellation. We expect that iterative and integrative parcellation of both white matter and cerebral cortex will help to reduce the discrepancy in their segmentation maps and refine the parcellation of the whole brain.
Our future work will also include further improvement and validation of the proposed method on more human subjects scanned in different imaging settings. The extracted sulcal regions and sulcal basins can be used to analyze the normal variability of cortical surfaces in different groups of normal subjects, or to analyze neuropathological changes in diseased groups, including cortical thickness, cortical area and cortical folding analysis in many neurological, neurodegenerative and neuropsychiatric diseases. Those quantitative cortical measurements can serve as imaging biomarkers for studies of brain development and brain aging, as well as for quantitation and prediction of brain disease progression.
Acknowledgement
G Li, J Nie and L Guo were supported by the NWPU Foundation for Fundamental Research. T Liu was supported by the NIH Career Award (EB 006878) and the University of Georgia start-up research funding. The authors would like to thank Mayuresh Kasture for his help in proofreading of this manuscript and the anonymous reviewers for providing constructive suggestions that improved this paper.
References
- Ashburner J, Csernansky JG, Davatzikos C, Fox NC, Frisoni GB, Thompson PM. Computer-assisted imaging to assess brain structure in healthy and diseased brains. Lancet Neurol. 2003;2(2):79–88. doi: 10.1016/s1474-4422(03)00304-1. [DOI] [PubMed] [Google Scholar]
- Bajcsy R, Lieberson R, Reivich M. A computerized system for the elastic matching of deformed radiographic images to idealized atlas images. J. Comput. Assist. Tomogr. 1983;7(4):618–625. doi: 10.1097/00004728-198308000-00008. [DOI] [PubMed] [Google Scholar]
- Bartesaghi A, Sapiro G. A system for the generation of curves on 3D brain images. Hum. Brain. Mapp. 2001;14(1):1–15. doi: 10.1002/hbm.1037. [DOI] [PMC free article] [PubMed] [Google Scholar]
- Behrens TE, Johansen-Berg H, Woolrich MW, Smith SM, Wheeler-Kingshott CA, Boulby PA, Barker GJ, Sillery EL, Sheehan K, Ciccarelli O, Thompson AJ, Brady JM, Matthews PM. Non-invasive mapping of connections between human thalamus and cortex using diffusion imaging. Nat. Neurosci. 2003;6(7):750–757. doi: 10.1038/nn1075. [DOI] [PubMed] [Google Scholar]
- Besag J. Spatial interaction and the statistical analysis of lattice systems (with discussion) J. Roy. Stat. Soc., ser. B. 1974;36(2):192–326. [Google Scholar]
- Besag J. On the statistical analysis of dirty pictures (with discussion) J. of Royal Statist. Soc., ser. B. 1986;48(3):259–302. [Google Scholar]
- Boykov Y, Kolmogorov V. An experimental comparison of Min-Cut/Max-Flow algorithms for energy minimization in vision. IEEE Trans. Pattern. Anal. Mach. Intell. 2004;26(9):1124–1137. doi: 10.1109/TPAMI.2004.60. [DOI] [PubMed] [Google Scholar]
- Cachia A, Mangin JF, Riviere D, Papadopoulos-Orfanos D, Kherif F, Bloch I, Regis J. A generic framework for parcellation of the cortical surface into gyri using geodesic Voronoi diagrams. Med. Image. Anal. 2003a;7(4):403–416. doi: 10.1016/s1361-8415(03)00031-8. [DOI] [PubMed] [Google Scholar]
- Cachia A, Mangin JF, Riviere D, Kherif F, Boddaert N, Andrade A, Papadopoulos-Orfanos D, Poline JB, Bloch I, Zilbovicius M, Sonigo P, Brunelle F, Regis J. A primal sketch of the cortex mean curvature: a morphogenesis based approach to study the variability of the folding patterns. IEEE. Trans. Med. Imag. 2003b;22(6):754–765. doi: 10.1109/TMI.2003.814781. [DOI] [PubMed] [Google Scholar]
- Christensen GE, Rabbit RD, Miller MI. Deformable templates using large deformation kinematics. IEEE Trans. Image Process. 1996;5(10):1435–1447. doi: 10.1109/83.536892. [DOI] [PubMed] [Google Scholar]
- Cocosco CA, Kollokian V, Kwan RKS, Evans AC. BrainWeb: online interface to a 3D MRI simulated brain database. NeuroImage. 1997;5(4):S425. [Google Scholar]
- Cointepas Y, Mangin JF, Garnero L, Poline JB, Benali H. BrainVISA: Software platform for visualization and analysis of multimodality brain data. NeuroImage. 2001;13(6):S98. [Google Scholar]
- Collins DL, Neelin P, Peters TM, Evans AC. Automatic 3D intersubject registration of MR volumetric data in standardized Talairach space. J. Comput. Assist. Tomogr. 1994;18(2):192–205. [PubMed] [Google Scholar]
- Collins DL, Le Goualher G, Evans AC. Non-linear cerebral registration with sulcal constraints. Proc. MICCAI 1998. 1998:974–984. [Google Scholar]
- Crum WR, Griffin LD, Hill DL, Hawkes DJ. Zen and the art of medical image registration: correspondence, homology, and quality. NeuroImage. 2003;20(3):1425–1437. doi: 10.1016/j.neuroimage.2003.07.014. [DOI] [PubMed] [Google Scholar]
- Dale AM, Fischl B, Sereno MI. Cortical surface-based analysis I:segmentation and surface reconstruction. NeuroImage. 1999;9(2):179–194. doi: 10.1006/nimg.1998.0395. [DOI] [PubMed] [Google Scholar]
- Davatzikos C. Spatial transformation and registration of brain images using elastically deformable models. Comput. Vis. Image Underst. 1997;66(2):207–222. doi: 10.1006/cviu.1997.0605. [DOI] [PubMed] [Google Scholar]
- Dempster AP, Laird NM, Bubin DB. Maximum likelihood from incomplete data via EM algorithm. J. Roy. Stat. Soc., ser. B. 1977;39(1):1–38. [Google Scholar]
- Desikan RS, Ségonne F, Fischl B, Quinn BT, Dickerson BC, Blacker D, Buckner RL, Dale AM, Maguire RP, Hyman BT, Albert MS, Killiany RJ. An automated labeling system for subdividing the human cerebral cortex on MRI scans into gyral based regions of interest. NeuroImage. 2006;31(3):968–980. doi: 10.1016/j.neuroimage.2006.01.021. [DOI] [PubMed] [Google Scholar]
- Durrleman S, Pennec X, Trouve A, Ayache N. Measuring brain variability via sulcal lines registration: a diffeomorphic approach. Proc. MICCAI 2007. 2007;vol. 1:675–682. doi: 10.1007/978-3-540-75757-3_82. [DOI] [PubMed] [Google Scholar]
- Evans AC, Dai W, Collins L, Neeling P, Marett S. Warping of a computerized 3-D atlas to match brain image volumes for quantitative neuroanatomical and functional analysis. SPIE Proc. Image Process. 1991;vol. 1445:236–246. [Google Scholar]
- Fillard P, Arsigny V, Pennec X, Hayashi KM, Thompson PM, Ayache N. Measuring brain variability by extrapolating sparse tensor fields measured on sulcal lines. NeuroImage. 2007;34(2):639–650. doi: 10.1016/j.neuroimage.2006.09.027. [DOI] [PubMed] [Google Scholar]
- Fischl B, Sereno MI, Dale AM. Cortical surface-based analysis II: Inflation, flattening, and a surface-based coordinate system. NeuroImage. 1999;9(2):195–207. doi: 10.1006/nimg.1998.0396. [DOI] [PubMed] [Google Scholar]
- Fischl B, Salat DH, Busa E, Albert M, Dieterich M, Haselgrove C, van der Kouwe A, Killiany R, Kennedy D, Klaveness S, Montillo A, Makris N, Rosen B, Dale AM. Whole brain segmentation: automated labeling of neuroanatomical structures in the human brain. Neuron. 2002;33(3):341–355. doi: 10.1016/s0896-6273(02)00569-x. [DOI] [PubMed] [Google Scholar]
- Fischl B, van der Kouwe A, Destieux C, Halgren E, Se´gonne F, Salat DH, Busa E, Seidman LJ, Goldstein J, Kennedy D, Caviness V, Makris N, Rosen B, Dale AM. Automatically parcellating the human cerebral cortex. Cereb. Cortex. 2004;14(1):11–22. doi: 10.1093/cercor/bhg087. [DOI] [PubMed] [Google Scholar]
- Friston K, Ashburner J, Frith CD, Poline JB, Heather JD, Frackowiak RSJ. Spatial registration and normalisation of images. Human Brain Mapping. 1995;2:165–189. [Google Scholar]
- Gee JC, Barillot C, Le Briquer L, Haynor DR, Bajcsy RK. Matching structural images of the human brain using statistical and geometrical image features. SPIE Proc. Visualization in Biomedical Computing. 1994;vol. 2359:191–204. [Google Scholar]
- Geman S, Geman D. Sochastic relaxation, Gibbs distributions, and the Bayesian restoration of images. IEEE. Trans. Pattern. Anal. Mach. Intell. 1984;6(6):721–741. doi: 10.1109/tpami.1984.4767596. [DOI] [PubMed] [Google Scholar]
- Han X, Pham DL, Tosun D, Rettmann ME, Xu C, Prince JL. CRUISE: cortical reconstruction using implicit surface evolution. NeuroImage. 2004;23(3):997–1012. doi: 10.1016/j.neuroimage.2004.06.043. [DOI] [PubMed] [Google Scholar]
- Hellier P, Barillot C. Coupling dense and landmark-based approaches for nonrigid registration. IEEE Trans. Med. Imag. 2003;22(2):217–227. doi: 10.1109/TMI.2002.808365. [DOI] [PubMed] [Google Scholar]
- Joshi SC, Miller MI, Christensen GE, Banerjee A, Coogan T, Grenander U. Hierarchical brain mapping via a generalized Dirichlet solution for mapping brain manifolds. SPIE Proc. Geom. Methods in Applied Imaging. 1996;vol. 2573:278–289. [Google Scholar]
- Kao CY, Hofer M, Sapiro G, Stern J, Rehm K, Rottenberg DA. A geometric method for automatic extraction of sulcal fundi. IEEE Trans. Med. Imag. 2007;26(4):530–540. doi: 10.1109/TMI.2006.886810. [DOI] [PubMed] [Google Scholar]
- Klein A, Hirsch J. Mindboggle: a scatterbrained approach to automate brain labeling. NeuroImage. 2005;24(2):261–280. doi: 10.1016/j.neuroimage.2004.09.016. [DOI] [PubMed] [Google Scholar]
- Khaneja N, Miller MI, Grenander U. Dynamic programming generation of curves on brain surfaces. IEEE Trans. Pattern Anal. Mach. Intell. 1998;20(11):1260–1265. [Google Scholar]
- Kimmel R, Sethian JA. Computing geodesic paths on manifolds. Proc. Natl. Acad. Sci. 1998;95(15):8431–8435. doi: 10.1073/pnas.95.15.8431. [DOI] [PMC free article] [PubMed] [Google Scholar]
- Le Goualher G, Barillot C, Bizais Y. Three-dimensional segmentation and representation of cortical sulci using active ribbons. International Journal of Pattern Recognition and Artificial Intelligence. 1997;11:1295–1315. [Google Scholar]
- Le Goualher G, Procyk E, Collins DL, Venugopal R, Barillot C, Evans AC. Automated extraction and variability analysis of sulcal neuroanatomy. IEEE. Trans. Med. Imag. 1999;18(3):206–217. doi: 10.1109/42.764891. [DOI] [PubMed] [Google Scholar]
- Li G, Liu T, Tarokh A, Nie J, Guo L, Mara A, Holley S, Wong STC. 3D cell nuclei segmentation based on gradient flow tracking. BMC Cell Biol. 2007:8–40. doi: 10.1186/1471-2121-8-40. [DOI] [PMC free article] [PubMed] [Google Scholar]
- Li G, Liu T, Nie J, Guo L, Wong STC. A novel method for cortical sulcal fundi extraction. Proc. MICCAI 2008. 2008;vol. 1:270–278. doi: 10.1007/978-3-540-85988-8_33. [DOI] [PubMed] [Google Scholar]
- Liu T, Shen D, Davatzikos C. Deformable registration of cortical structures via hybrid volumetric and surface warping. NeuroImage. 2004;22(4):1790–1801. doi: 10.1016/j.neuroimage.2004.04.020. [DOI] [PubMed] [Google Scholar]
- Liu T, Young G, Huang L, Chen NK, Wong S. 76-space analysis of grey matter diffusivity: Methods and applications. NeuroImage. 2006;15(31):51–65. doi: 10.1016/j.neuroimage.2005.11.041. [DOI] [PubMed] [Google Scholar]
- Lohmann G. Extracting line representations of sulcal and gyral patterns in MR images of the human brain. IEEE Trans. Med. Imag. 1998;17(6):1040–1048. doi: 10.1109/42.746714. [DOI] [PubMed] [Google Scholar]
- Lohmann G, von Cramon DY. Automatic labelling of the human cortical surface using sulcal basins. Med. Image. Anal. 2000;4(3):179–188. doi: 10.1016/s1361-8415(00)00024-4. [DOI] [PubMed] [Google Scholar]
- Lohmann G, von Cramon DY, Colchester AC. Deep sulcal landmarks provide an organizing framework for human cortical folding. Cereb. Cortex. 2008;18(6):1415–1420. doi: 10.1093/cercor/bhm174. [DOI] [PubMed] [Google Scholar]
- Lorensen WE, Cline HE. Marching cubes: a high resolution 3D surface construction algorithm. Comput. Graph. 1987;21(4):163–169. [Google Scholar]
- Lui LM, Wang Y, Chan TF, Thompson PM. Automatic landmark and its application to the optimization of brain conformal mapping. Proc. CVPR 2006. 2006;vol. 2:1784–1792. [Google Scholar]
- Maddah M, Grimson WE, Warfield SK, Wells WM. A unified framework for clustering and quantitative analysis of white matter fiber tracts. Med. Image Anal. 2008;12(2):191–202. doi: 10.1016/j.media.2007.10.003. [DOI] [PMC free article] [PubMed] [Google Scholar]
- Mangin J-F, Frouin V, Bloch I, Régis J, Lopez-Krahe J. From 3D magnetic resonance images to structural representations of the cortex topography using topology preserving deformations. Journal of Mathematical Imaging and Vision. 1995;5(4):297–318. [Google Scholar]
- Mangin J-F, Riviére D, Cachia A, Duchesnay E, Cointepas Y, Papadopoulos-Orfanos D, Collins DL, Evans AC, Régis J. Object-based morphometry of the cerebral cortex. IEEE Trans. Med. Imag. 2004;24(8):968–982. doi: 10.1109/TMI.2004.831204. [DOI] [PubMed] [Google Scholar]
- Mangin J-F, Riviére D, Cachia A, Duchesnay E, Cointepas Y, Papadopoulos-Orfanos D, Scifo P, Ochiai T, Brunelle F, Régis J. A framework to study the cortical folding patterns. NeuroImage. 2004;23 Suppl. 1:S129–S138. doi: 10.1016/j.neuroimage.2004.07.019. [DOI] [PubMed] [Google Scholar]
- Mangin J-F, Riviere D, Coulon O, Poupon C, Cachia A, Cointepas Y, Poline JB, Le Bihan D, Regis J, Papadopoulos-Orfanos D. Coordinate-based versus structural approaches to brain image analysis. Artif. Intell. Med. 2004;30(2):177–197. doi: 10.1016/S0933-3657(03)00064-2. [DOI] [PubMed] [Google Scholar]
- Ohtake Y, Belyaev A, Seidel HP. Ridge-valley lines on meshes via implicit surface fitting. Proc. SIGGRAPH. 2004:609–612. [Google Scholar]
- Ono M, Kubick S, Abernathey CD. Atlas of the Cerebral Sulci. New York: Thieme; 1990. [Google Scholar]
- Otsu N. A threshold selection method from gray-level histogram. IEEE Trans. Syst. Man. Cybern. 1979;9:62–66. [Google Scholar]
- Passingham RE, Stephan KE, Kütter R. The anatomical basis of functional localization in the cortex. Nat. Rev. Neurosci. 2002;3(8):606–616. doi: 10.1038/nrn893. [DOI] [PubMed] [Google Scholar]
- Perrin M, Cointepas Y, Cachia A, Poupon C, Thirion B, Rivière D, Cathier P, EI Kouby V, Constantinesco A, Le Bihan D, Mangin JF. Connectivity-based parcellation of the cortical mantle using q-Ball Diffusion Imaging, Int. J. Biomed Imaging. 2008:368406. doi: 10.1155/2008/368406. [DOI] [PMC free article] [PubMed] [Google Scholar]
- Renault C, Desvignes M, Revenu M. 3D curves tracking and its application to cortical sulci detection. Proc. ICIP 2000. 2000;vol. 2:491–494. [Google Scholar]
- Rettmann ME, Han X, Xu C, Prince JL. Automated sulcal segmentation using watersheds on the cortical surface. NeuroImage. 2002;15(2):329–344. doi: 10.1006/nimg.2001.0975. [DOI] [PubMed] [Google Scholar]
- Rettmann ME, Tosun D, Tao X, Resnick SM, Prince JL. Program for Assisted Labeling of Sulcal Regions (PALS): description and reliability. NeuroImage. 2005;24(2):398–416. doi: 10.1016/j.neuroimage.2004.08.014. [DOI] [PubMed] [Google Scholar]
- Rivière D, Mangin JF, Papadopoulos-Orfanos D, Martinez JM, Frouin V, Régis J. Automatic recognition of cortical sulci of the human brain using a congregation of neural networks. Med. Image. Anal. 2002;6(2):77–92. doi: 10.1016/s1361-8415(02)00052-x. [DOI] [PubMed] [Google Scholar]
- Rueckert D, Sonoda LI, Hayes C, Hill DL, Leach MO, Hawkes DJ. Nonrigid registration using free-form deformations: application to breast MR images. IEEE Trans. Med. Imaging. 1999;18(8):712–721. doi: 10.1109/42.796284. [DOI] [PubMed] [Google Scholar]
- Rusinkiewicz S. Estimating curvatures and their derivatives on triangle meshes. Proc. 3DPT. 2004:486–493. [Google Scholar]
- Sereno MI, Dale AM, Liu A, Tootell RB. A surface-based coordinate system for a canonical cortex. NeuroImage. 1996;3:S252. [Google Scholar]
- Shattuck D, Leahy R. BrainSuite: An automated cortical surface identification tool. Med. Image. Anal. 2002;8(2):129–142. doi: 10.1016/s1361-8415(02)00054-3. [DOI] [PubMed] [Google Scholar]
- Shen D, Davatzikos C. HAMMER: hierarchical attribute matching mechanism for elastic registration. IEEE Trans. Med. Imag. 2002;21(11):1421–1439. doi: 10.1109/TMI.2002.803111. [DOI] [PubMed] [Google Scholar]
- Shi Y, Thompson PM, Dinov I, Toga AW. Hamilton-Jacobi skeleton on cortical surfaces. IEEE Trans. Med. Imag. 2008;27(5):664–673. doi: 10.1109/TMI.2007.913279. [DOI] [PMC free article] [PubMed] [Google Scholar]
- Sun ZY, Rivière D, Poupon F, Régis J, Mangin JF. Automatic inference of sulcus patterns using 3D moment invariants. Proc. MICCAI 2007. 2007;vol. 1:515–522. doi: 10.1007/978-3-540-75757-3_63. [DOI] [PubMed] [Google Scholar]
- Tao X, Prince JL, Davatzikos C. Using a statistical shape model to extract sulcal curves on the outer cortex of the human brain. IEEE Trans. Med. Imag. 2002;21(5):513–524. doi: 10.1109/TMI.2002.1009387. [DOI] [PubMed] [Google Scholar]
- Thirion JP, Monga O, Benayoun S, Gueziec A, Ayache N. Automatic registration of 3D images using surface curvature. SPIE Proc. Mathematical Methods in Medical Imaging. 1992;vol. 1768:206–216. [Google Scholar]
- Thirion JP. The extermal mesh and understanding of 3D surfaces. Int. J. Comput. Vis. 1996;19(2):115–128. [Google Scholar]
- Thirion JP. Image Matching as a diffusion process: an analogy with Maxwell’s demons. Med. Image Anal. 1998;2(3):243–260. doi: 10.1016/s1361-8415(98)80022-4. [DOI] [PubMed] [Google Scholar]
- Thompson PM, Toga AW. A surface-based technique for warping three-dimensional images of the brain. IEEE Trans. Med. Imag. 1996;15(4):402–417. doi: 10.1109/42.511745. [DOI] [PubMed] [Google Scholar]
- Tosun D, Rettmann ME, Prince JL. Mapping techniques for aligning sulci across multiple brains. Med. Image. Anal. 2004;8(3):295–309. doi: 10.1016/j.media.2004.06.020. [DOI] [PMC free article] [PubMed] [Google Scholar]
- Tu Z, Zheng S, Yuille AL, Reiss AL, Dutton RA, Lee AD, Galaburda AM, Dinov I, Thompson PM, Toga AW. Automated extraction of the cortical sulci based on a supervised learning approach. IEEE Trans. Med. Imag. 2007;26(4):541–552. doi: 10.1109/TMI.2007.892506. [DOI] [PubMed] [Google Scholar]
- Vaillant M, Davatzikos C. Finding parametric representations of the cortical sulci using an active contour model. Med. Image. Anal. 1997;1(4):295–315. doi: 10.1016/s1361-8415(97)85003-7. [DOI] [PubMed] [Google Scholar]
- Vaillant M, Davatzikos C. Hierarchical matching of cortical features for deformable brain image registration. Proc. IPMI 1999. 1999:182–195. [Google Scholar]
- Van Essen DC, Drury HA, Joshi S, Miller MI. Functional and structural mapping of human cerebral cortex: solutions are in the surfaces. Proc. Natl. Acad. Sci. 1998;95(3):788–795. doi: 10.1073/pnas.95.3.788. [DOI] [PMC free article] [PubMed] [Google Scholar]
- Van Essen DC. A Population-Average, Landmark- and Surface-based (PALS) atlas of human cerebral cortex. NeuroImage. 2005;28(3):635–662. doi: 10.1016/j.neuroimage.2005.06.058. [DOI] [PubMed] [Google Scholar]
- Vincent L, Soille P. Watersheds in digital spaces: an efficient algorithm based on emersion simulations. IEEE Trans. Pattern. Anal. Mach. Intell. 1991;13(6):583–598. [Google Scholar]
- Wardetzky M, Mathur S, Kalberer F, Grinspun E. Discrete Laplace operators: No free lunch; Proc. Eurographics Symposium on Geometry Processing; 2007. pp. 33–37. [Google Scholar]
- Wells WM, Viola P, Atsumi H, Nakajima S, Kikinis R. Multi-modal volume registration by maximisation of mutual information. Med. Image Anal. 1996;1(1):35–51. doi: 10.1016/s1361-8415(01)80004-9. [DOI] [PubMed] [Google Scholar]
- Woods RP, Grafton ST, Watson JD, Sicotte NL, Mazziotta JC. Automated image registration. II: Intersubject validation of linear and nonlinear models. J. Comput. Assist. Tomogr. 1998;22(1):153–165. doi: 10.1097/00004728-199801000-00028. [DOI] [PubMed] [Google Scholar]
- Xu C, Prince JL. Snakes, shapes, and gradient vector flow. IEEE Trans. Image Proc. 1998;7(3):359–369. doi: 10.1109/83.661186. [DOI] [PubMed] [Google Scholar]
- Yang F, Kruggel F. Automatic segmentation of human brain sulci. Med. Image. Anal. 2008;12(4):442–451. doi: 10.1016/j.media.2008.01.003. [DOI] [PubMed] [Google Scholar]
- Zeng X, Staib LH, Schultz RT, Tagare H, Win L, Duncan JS. A new approach to 3D sulcal ribbon finding from MR images. Proc. MICCAI 1999. 1999:148–157. [Google Scholar]
- Zhang Y, Brady M, Smith S. Segmentation of brain MR image through a Hidden Markov Random Field model and the Expectation-Maximization algorithm. IEEE Trans. Med. Imag. 2001;20(1):45–57. doi: 10.1109/42.906424. [DOI] [PubMed] [Google Scholar]
- Zhou Y, Thompson PM, Toga AW. Extracting and representing the cortical sulci. IEEE. Comput. Graph. Appl. 1999;19(3):49–55. doi: 10.1109/38.761550. [DOI] [PMC free article] [PubMed] [Google Scholar]


