

Abstract
In the soft-wet environment of biomolecular electron transfer, it is possible that structural fluctuations could wash out medium-specific electronic effects on electron tunneling rates. We show that beyond a transition distance (2-3 Å in water and 6-7 Å in proteins), fluctuation contributions to the mean-squared donor-to-acceptor tunneling matrix element are likely to dominate over the average matrix element. Even though fluctuations dominate the tunneling mechanism at larger distances, we find that the protein fold is “remembered” by the electronic coupling, and structure remains a key determinant of electron transfer kinetics.
Energy transduction in living organisms relies on the generation of transmembrane electrochemical gradients [1]. Throughout biology, this gradient is established by proton transfer that is driven by multistep electron tunneling between electron localizing groups (cofactors) bound to proteins [2]. The structural diversity and thermal motion of proteins and water induce a broad range of static and dynamical disorder, respectively, in electronic interactions. Static disorder arises from the structural diversity available to electron-transfer proteins, with their hierarchy of organization, and the variety of donor and acceptor cofactor binding modes. In this study, by dynamical disorder we mean thermal fluctuations around an equilibrium structure. Developing a theory to link medium disorder to electron transfer (ET) function is a challenge associated with electron tunneling through soft-wet matter [3-8].
In this Letter, we perform a statistical analysis of structural and dynamical disorder in the electron donor-to-acceptor coupling for unimolecular protein-mediated ET reactions (ruthenated redox proteins [9]) and bimolecular water-mediated ET reactions (cytochrome b5 self-exchange [10]). These ET systems possess diverse tunneling media and structural fluctuations, and they include a broad range of tunneling distances that show single exponential ET kinetics. Our analysis focuses on the distance dependence of disorder effects.
For long distance ET, the high-temperature limit non-adiabatic rate is [11], where TDA is the bridge-mediated donor-acceptor electronic coupling, ΔG‡ is the activation free energy, and the TDA averaging is done over thermal fluctuations. describes the effects of dynamical disorder on the electronic coupling for a particular ET system. The relative magnitude of σ2 compared to 〈TDA〉2 determines the significance of the dynamical electronic-coupling disorder. When 〈TDA〉2 ≫ σ2, the electronic-coupling fluctuations caused by the molecule’s motion do not impact electron tunneling. In the opposite limit of large fluctuations, 〈TDA〉2 ≪ σ2, the electronic coupling is enhanced by nonequilibrium conformations. The influence of dynamical disorder on the electronic coupling is quantified by the coherence parameter [12-14]:
| (1) |
Values of C ~ 1 indicate that tunneling is controlled by the average coupling. C ≪ 1 indicates that tunneling is dominated by coupling fluctuations (strong dynamical disorder).
By structural electronic-coupling disorder (at a given donor-to-acceptor distance RDA), we mean that values differ among chemically distinct ET species with the same RDA. The scatter in arises from structural variations between the ET species. For example, the different protein folds with specific secondary structure, donor and acceptor structure, and cofactor binding modes create structural diversity. We use the following quantity to characterize structural disorder at the distance RDA:
| (2) |
γ denotes ET species with the donor-acceptor distance RDA, N is the number of ET species at that distance, and avg denotes the average of all for that distance. If S ≪ 1, the scatter in with respect to avg is small for the particular donor-acceptor distance, and the effect of structural electronic-coupling disorder on the ET rates is not significant. In this case, an average tunneling-barrier model that reproduces avg gives, to a good approximation, for all ET species at RDA. The opposite limit of large scatter (S of the order of 1 or greater) describes a situation of significant structural disorder. In this regime, for any single ET species is not representative of the values for the other ET species at the same distance. In this regime, an average tunneling-barrier theory cannot describe the electronic couplings of the different ET systems.
Since the sign of TDA can alternate with some molecular geometry changes, the thermal average 〈TDA〉 reflects the importance of destructive interference among tunneling pathways [10,12,15]. The dependence of σ on tunneling pathways, and on the average molecular geometry of the ET system, is less straightforward to dissect. σ is expected to increase with donor-acceptor distance since large bridges have enhanced fluctuations (see the auxiliary material [16]). Does this mean that structural heterogeneity is reduced by fluctuations?
We examine the dependence of dynamical electronic-coupling disorder [C, Eq. (1)] and of structural electronic-coupling disorder [S, Eq. (2)] on the donor-acceptor distance RDA for water- and protein-mediated ET reactions. We show that there is a critical distance RDA = Rc (different for water and proteins) beyond which dynamical disorder is likely to dominate the electronic coupling of any ET system (σ2 > 〈TDA〉2). Further, this critical distance is approximately equal to two length parameters that characterize the bridge medium: the correlation length of thermal bridge motion and the correlation length of the electron’s tunneling propagation. Finally, we demonstrate that the observed overall increase in the dynamical disorder with distance does not reduce structural disorder (the heterogeneity of values). This is because the sensitivity of the electronic-coupling fluctuations σ to molecular structure is as strong as the sensitivity of the average electronic coupling 〈TDA〉 to molecular structure.
The 24 ruthenated derivatives of cytochrome c, cytochrome b562, myoglobin, and azurin [9] all have activation free energy ΔG‡ ~ 0, and thus the ET rates reflect different tunneling propensities. For water-mediated ET, we explored a system of two cytochrome b5 molecules participating in a water-mediated self-exchange ET reaction. The cytochrome b5 molecules were positioned in three different porphyrin ring plane orientations (0°, 45°, or 90°) and, for each orientation, 13 different edge-to-edge distances from van der Waals contact to 9 Å (12 to 21 Å metal to metal) [10].
The electronic-coupling calculations were performed using a tight-binding (extended Hückel) one-electron Hamiltonian with standard parameters [17,18] that have been successfully used for coupling estimates [12,19,20]. TDA was calculated for each molecular dynamics (MD) snapshot using
| (3) |
where S and H are the electronic orbital overlap and Hamiltonian matrices, respectively, G̃ = (EtunSbridge - Hbridge)-1 is the bridge Green’s function, and Etun is the electron tunneling energy [19-22]. The value of Etun was set ~1 eV from the energies of the protein localized states, and TDA depended weakly on that energy.
There were two major sources of sampling errors in the analysis. First, errors arise in the individual values because of the finite length of the MD trajectories (Figs. 1 and 2). The second source of errors was the finite number of ET species at each distance (Fig. 3). All sampling errors were estimated using bootstrapping with 10 000-100 000 samples [23,24]. Systematic errors associated with the level of electronic structure calculations and classical MD simulations were also present. However, previous work [12,14,19,20] has shown that this computational approach provides reasonable estimates of ET rates in a number of biological systems.
FIG. 1.
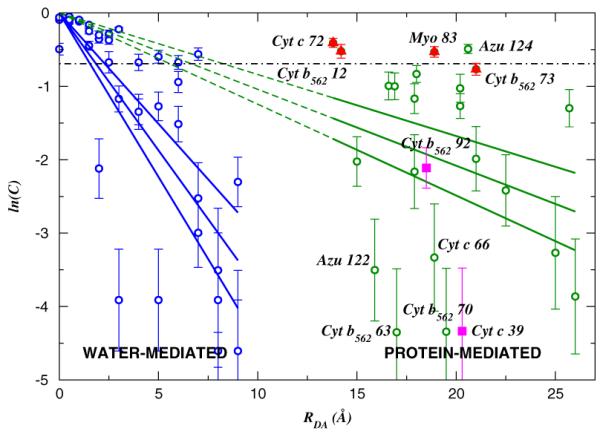
(color online). Distance dependence of ln(C) [Eq. (1)] in water- (0 - 9 Å) and protein-mediated (13-26 Å) ET reactions. The solid lines indicate the least squares fits of ln(C), and its upper and lower estimates. The dashed lines show extensions of the least squares fits for proteins to the anchor at the origin. The dot-dashed line marks C = 0.5, for which contributions from 〈TDA〉2 and σ2 are equal.
FIG. 2.
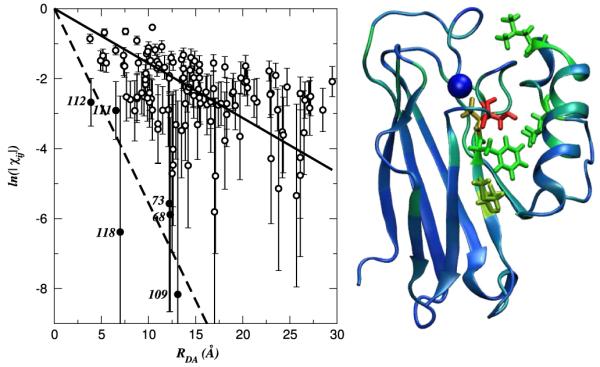
(color online). Left: Dependence of ln(|χij|) [Eq. (5)] on the tunneling distance in azurin. The solid line shows the average electronic correlation decay (Rc = 6.4 ± 1.5 Å), and the dashed line is a linear regression for the 6 amino acids with the fastest decay (marked with filled circles and labeled). Right: Protein structure: amino acids with slow and average decays (Rc = 5-19 Å) are shown as blue ribbons and tubes, and amino acids with fast decays (Rc = 1.5-5 Å) are shown with red, yellow, and green sticks.
FIG. 3.
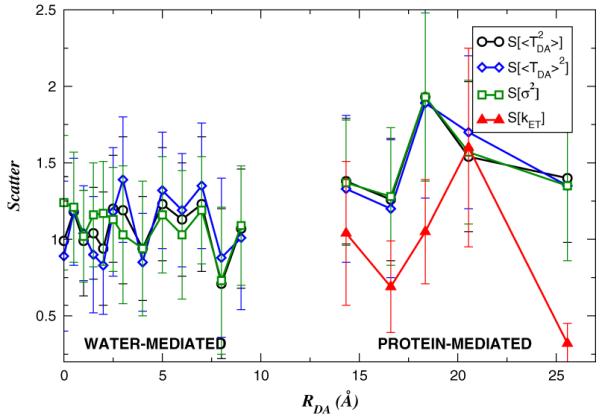
(color online). Structural disorder parameters [Eq. (2)] (circles), S[〈TDA〉2] (diamonds), S[σ2] (squares), and S[kET] (triangles, [9]) as functions of RDA. The error bars describe the errors that arise from the limited number of ET systems at each distance; the errors arising from the finite lengths of the MD trajectories were smaller.
Correlation length of the thermal atomic motion
To characterize the dynamical disorder of the bridge structure that arises from thermal motion, we computed the atom position covariance matrix κij for proteins and water, and studied its dependence on interatomic distance:
| (4) |
is the position of atom i, and averaging is performed over each MD trajectory. Calculations of κij for proteins included the Cα, C, and N backbone atoms, and the calculations for water included only oxygen atoms. The dependence of κij on interatomic distance characterizes the loss of correlation among atomic positions, and reflects the average correlation length for structural fluctuations.
Correlation length of the electron’s tunneling propagation
To explore the loss of memory in the electron’s through-bridge tunneling propagation that arises from thermal motion, we calculated the normalized correlation function:
| (5) |
is a matrix element of the bridge electronic Green’s function between orbitals i and j and averaging is performed over each MD trajectory. Calculations were performed for wild-type azurin; preliminary results for other proteins are consistent with the azurin observations. The dependence of χij on interatomic distance characterizes the loss of correlation among tunneling propagations that involve different distances, and reflects the average correlation length for through-bridge tunneling. To probe dynamic disorder effects throughout the protein, orbital i was taken to be the bridge orbital most strongly coupled to the donor, and orbital j was the σ bond between the Cα and C (carbonyl) backbone atoms of each protein amino acid. A similar metric based on Green’s function matrix elements (rather than squares) yielded nearly identical results. In different protein regions, χij exhibits different distance dependencies. The difference reflects a connection between structural motifs and the coupling fluctuations related to the motions of the motifs. This connection between structure and electronic-coupling fluctuations is explored further in the following sections.
Dynamic disorder
Table I shows that a tunneling medium can be characterized by a distance Rc at which a structure-controlled tunneling mechanism (〈TDA〉2 > σ2) is likely to change to a fluctuation-controlled tunneling mechanism (〈TDA〉2 < σ2).
TABLE I.
Estimates of the transition distance Rc for proteins and water based on different descriptors. The χij-based estimate for water was not computed, because the high mobility of water molecules causes large variations of intermolecular distances over MD trajectories. Estimates based on a comparison of 〈TDA〉2 to σ2 yield Rc ~ 7 Å for proteins and Rc ~ 3 Å for water
| Descriptor | Rc, proteins (Å) | Rc, water (Å) |
|---|---|---|
| ln(C) | 6.8 ± 1.2 | 1.9 ± 0.4 |
| χij | 6.4 ± 1.5 | · · · |
| κij | 6.2 ± 1.4 | 1.9 ± 0.5 |
Figure 1 shows the distance dependence of ln(C), given the fact that dynamical disorder vanishes (C = 1, ln(C) = 0) when RDA = 0. The distance RDA at which C = 0.5 defines a transition distance (Rc) to the fluctuation-controlled regime. Rc was estimated from the data in Fig. 1 using linear regression. The regression analysis was performed for ln(C) itself and for its upper and lower estimates obtained by bootstrapping [23]. For water-mediated reactions, the correlation coefficient was -0.77, and Rc was estimated to be 1.9 ± 0.4 Å. Proteins showed a relatively small correlation coefficient of -0.26, and Rc was estimated at 6.8 ± 1.2 Å. The structural diversity of proteins leads to a statistical trend characterized by Rc, rather than a clear distance dependence for C.
Figure 2 shows the dependence of ln(|χij|) on distance in wild-type azurin. The overall distance dependence is nearly exponential, as indicated by the correlation coefficient of -0.78. The correlation length at which χij decays to 1/e was estimated using the linear regression of ln(χij) anchored at the origin (at zero distance χij = 1), and was found to be 6.4 ± 1.5 Å. Some specific protein amino acids deviate from this distance dependence (see auxiliary material [16]). The correlation length estimates using κij yielded similar results (see Table I and the auxiliary material [16]).
It is remarkable that the correlation lengths derived from the κij and χij correlation functions are so close to the transition distances (Rc) derived from ln(C) (Table I). A related method for deriving Rc by comparing 〈TDA〉2 to σ2 yields similar Rc values (~7 Å for proteins and ~3 Å for water, see the auxiliary material [16]). κij and χij relate only to the bridge thermal motion while 〈TDA〉2, σ2, and C also contain information about the donor and acceptor cofactor fluctuations. These results show that, on average, fluctuation-controlled tunneling dominates biological ET for donor-acceptor distances larger than 6-7 Å in proteins and 2-3 Å in water. Rc for water corresponds approximately to the size of a water molecule. The Rc value for proteins is larger, as expected.
Structural heterogeneity versus dynamical disorder
Does the increase in dynamical electronic-coupling disorder with donor-acceptor distance reduce structural electronic-coupling disorder at large distances? That is, do differences in among ET species become less pronounced, on average, for RDA > Rc? Figure 3 shows the influence of structural electronic-coupling disorder as a function of RDA for the water-mediated and protein-mediated ET systems. It is a plot of the structural disorder parameter for [Eq.(2)], X = 〈TDA〉2, X = σ2 and X = kET (experimental). Figure 3 shows that is of order 1 at all distances. This means that structural disorder is large, and its magnitude is not reduced by dynamical disorder at large distances. The experimental ET rates of the protein systems in Fig. 3 are known, and we find that is strongly correlated with S[kET]. Therefore, the variability of the ET rates at a given distance reflects structural disorder in the electronic coupling. Interestingly, the structural disorder parameters of , 〈TDA〉2, and σ2 are of similar magnitudes and are highly correlated with one another for both protein- and water-bridged tunneling. Thus, the heterogeneity in values at each distance arises equally from 〈TDA〉2 and σ2. The bridge-mediated donor-acceptor electronic coupling fluctuations show the same sensitivity to the underlying molecular geometry as does the average coupling, implying a connection between structural motifs and the coupling fluctuations related to the motion of the motifs.
To summarize, electronic coupling is most likely determined by nonequilibrium geometries of the system beyond a critical distance (6-7 Å in proteins and 2-3 Å in water). In this dynamical disorder regime, the average structure cannot be used to compute the electronic-coupling strength. However, even when nonequilibrium conformations determine the coupling, the coupling fluctuations depend strongly on the underlying equilibrium structure. Therefore, dynamical electronic-coupling disorder does not wash out structural electronic-coupling disorder (the structural heterogeneity of ) in tunneling-mediated protein ET. In addition to tunneling, resonant and multistep hopping transport mechanisms can arise in protein [25] and DNA [26] ET under some circumstances. In these other regimes, the donor-acceptor interactions are expected to be particularly sensitive to dynamical disorder.
Acknowledgments
The research is supported by NIH grant GM-048043 and, in part, by the Duke Center for Theoretical and Mathematical Sciences and by the University of Cyprus. We thank Dr T. R. Prytkova and Dr. J. Lin for providing some of the simulation data and Professor G. Archontis for helpful discussions.
Footnotes
PACS numbers: 87.15.R-, 85.65.+h, 87.10.-e
References
- [1].Bertini I, Gray HB, Stiefel EI, Valentine JS, editors. Biological Inorganic Chemistry: Structure and Reactivity. University Science; Sausalito, CA: 2007. [Google Scholar]
- [2].Electron Transfer from Isolated Molecules to Biomolecules, Advances in Chemical Physics. Parts 1 and 2. Vol. 106. John Wiley & Sons; New York: 1999. [Google Scholar]
- [3].Warshel A, Parson WW. Q. Rev. Biophys. 2001;34:563. doi: 10.1017/s0033583501003730. [DOI] [PubMed] [Google Scholar]
- [4].Pande VS, Onuchic JN. Phys. Rev. Lett. 1997;78:146. [Google Scholar]
- [5].Bixon M, Jortner J. Russ. J. Electrochem. 2003;39:3. [Google Scholar]
- [6].Lopez-Castillo J-M, Filali-Mouhim A, Plante IL, Gerin J-P. J. Phys. Chem. 1995;99:6864. [Google Scholar]
- [7].Kemp M, Roitberg A, Mujica V, Wanta T, Ratner MA. J. Phys. Chem. 1996;100:8349. [Google Scholar]
- [8].Skourtis SS, Lin J, Beratan DN. In: Modern Methods for Theoretical Physical Chemistry of Biopolymers. Starikov EB, Tanaka S, Lewis JP, editors. Elsevier; New York: 2006. pp. 357–379. [Google Scholar]
- [9].Gray HB, Winkler JR. Q. Rev. Biophys. 2003;36:341. doi: 10.1017/s0033583503003913. [DOI] [PubMed] [Google Scholar]
- [10].Lin J, Balabin IA, Beratan DN. Science. 2005;310:1311. doi: 10.1126/science.1118316. [DOI] [PMC free article] [PubMed] [Google Scholar]
- [11].Marcus RA, Sutin N. Biochim. Biophys. Acta. 1985;811:265. [Google Scholar]
- [12].Balabin IA, Onuchic JN. Science. 2000;290:114. doi: 10.1126/science.290.5489.114. [DOI] [PubMed] [Google Scholar]
- [13].Troisi A, Ratner MA, Nitzan A. J. Chem. Phys. 2003;119:5782. [Google Scholar]
- [14].Skourtis SS, Balabin IA, Kawatsu T, Beratan DN. Proc. Natl. Acad. Sci. U.S.A. 2005;102:3552. doi: 10.1073/pnas.0409047102. [DOI] [PMC free article] [PubMed] [Google Scholar]
- [15].Prytkova TR, Kurnikov IV, Beratan DN. Science. 2007;315:622. doi: 10.1126/science.1134862. [DOI] [PMC free article] [PubMed] [Google Scholar]
- [16]. See EPAPS Document No. E-PRLTAO-101-059841 for supporting material. For more information on EPAPS, see http://www.aip.org/pubservs/epaps.html.
- [17].Yates K. Hückel Molecular Orbital Theory. Academic; New York: 1978. [Google Scholar]
- [18].Vela A, Gazquez JL. J. Phys. Chem. 1988;92:5688. [Google Scholar]
- [19].Skourtis SS, Beratan DN. Part 1. pp. 377–452. in Ref. [2] [Google Scholar]
- [20].Stuchebrukhov AA. Theor. Chem. Acc. 2003;110:291. [Google Scholar]
- [21].Balabin IA, Onuchic JN. J. Phys. Chem. 1996;100:11 573. [Google Scholar]
- [22].Teklos A, Skourtis SS. J. Chem. Phys. 2006;125:244103. doi: 10.1063/1.2403859. [DOI] [PubMed] [Google Scholar]
- [23].Hesterberg T, Moore DS, Monaghan S, Clipson A, Epstein R. Bootstrap Methods and Permutation Tests. 2nd ed. W. H. Freeman and Company; New York: 2005. [Google Scholar]
- [24].Taylor JK, Cihon C. Statistical Techniques for Data Analysis. 2nd ed. CRC Press; Boca Raton, FL: 2005. [Google Scholar]
- [25].Shih C, et al. Science. 2008;320:1760. doi: 10.1126/science.1158241. [DOI] [PubMed] [Google Scholar]
- [26].Hatcher E, Balaeff A, Keinan S, Ventkatramani R, Beratan DN. J. Am. Chem. Soc. 2008;130:11 752. doi: 10.1021/ja802541e. [DOI] [PubMed] [Google Scholar]