

Abstract
Imaging mass spectrometry is emerging as a powerful tool that has been applied extensively for the localization of proteins, peptides, pharmaceutical compounds, metabolites, and lipids in biological tissues. In this paper, three dimensional mass spectral imaging (3D MSI) technique was developed to examine distribution patterns of multiple neuropeptide families and lipids in the brain of the crab Cancer borealis. Different matrix/solvent combinations were compared for preferential extraction and detection of neuropeptides and lipids. Combined with morphological information, the distribution of numerous neuropeptides throughout the 3D structure of brain was determined using matrix-assisted laser desorption/ionization tandem time-of-flight mass spectrometry (MALDI-TOF/TOF MS). Different localization patterns were observed for different neuropeptide families, and isoforms displaying unique distribution patterns that were distinct from the common family distribution trends were also detected. In addition, multiple lipids were identified and mapped from brain tissue slices. To confirm their identities, MS/MS fragmentation was performed. Different lipid species displayed distinct localization patterns, suggesting their potential different functional roles in the nervous system.
Introduction
Many biological processes in the body involve interaction and dynamic spatial redistribution of a broad spectrum of compounds. The functions of various biological compounds in the complex tissue or organism are highly related to their locations in tissue structures. The emerging mass spectral imaging (MSI) approach provides an attractive opportunity to detect and probe the complex molecular content of tissues in an anatomical context. The majority of MSI applications have been focused on two-dimensional distribution of analytes of interest, which can only provide information for a thin section from the specimen. This technique has recently been extended to acquire images of serial sections from single specimen and provide a depth dimension to the data set, allowing three dimensional (3D) representation of multiple analytes in the target organs [1, 2]. The in-depth profiling of 3D MSI provides more comprehensive spatial information for molecules of interest, such as localization of proteins and dynamic distribution and partition of pharmaceutical compounds into various target tissues.
The application of mass spectrometry to the field of neuroscience has enabled the discovery and characterization of many neuropeptides and neurohormones [3-8]. This is usually achieved by tandem MS analysis of peptides fractionated from crude nerve tissue extract. Alternatively, direct tissue methods, in which the tissue is coated with matrix and probed via matrix-assisted laser desorption/ionization (MALDI) MS analysis, enable the sensitive detection of neuropeptides in single organs [9, 10] and even single cells [11, 12]. More recently, the use of MSI to map the distribution of neuropeptides has gained increased attention [13–15]. MSI reduces the time-consuming steps of sample extraction, purification and separation, while maintaining the topographical information about molecular distribution [16, 17]. MALDI MSI enables the study of a broad mass range of molecular species ranging from small molecules to large proteins, including neuropeptides. This technique creates distribution maps of selected compounds in a similar manner to the more traditional biochemical techniques such as chemical staining, immunohistochemistry, and radiochemistry [18-20]. However, MSI does not require a priori knowledge of the target analytes, and the inherent nature of high chemical specificity for MS detection enables the simultaneous differential localization of numerous peptides even when significant sequence homology exists. Furthermore, MS/MS fragmentation can be performed for unambiguous identification or even de novo sequencing.
The crustacean stomatogastric nervous system (STNS) consists of several linked, motor-pattern-generating networks that produce coordinated motor output. Numerous anatomical, electrophysiological, immunocytochemical, and mass spectral studies have been performed on components of this system [4, 9, 21, 22]. Therefore, the STNS provides an excellent test-bed for MSI method development, as well as a useful model of the nervous system from which general neurobiological concepts may be derived. We previously reported mapping multiple neuropeptides from crustacean brain and pericardial organ using MALDI imaging [23]. However, the brain is a highly complex neuronal structure consisting of numerous neuronal clusters and interwined nerve connections. A detailed study is still required to better understand the three dimensional distribution of neuropeptides throughout the whole brain structure.
Herein we present a simple scheme to obtain 3D mapping of multiple neuropeptides and lipids in C. borealis brain using MALDI-TOF/TOF. The differential distribution of neuropeptides was uncovered using region specific direct tissue analysis, and collisional-induced dissociation (CID) fragmentation was performed directly from the brain tissue to confirm the identities of particular neuropeptides and lipids. For MSI sample preparation, both dry coating and regular coating with airbrush matrix application were investigated for the effect of matrix solvent on detection sensitivity and preferential extraction of lipids and peptides. 3D imaging was acquired by mapping seven layers of horizontal tissue slices followed by reconstructing ion images in three dimensions. Combined with morphology information of crustacean brain, a detailed description of neuropeptide localization throughout the brain structure was achieved. In addition, 3D distribution of two types of lipids was also characterized showing differential localization patterns, suggesting their potential different biological functions.
Experimental
Animals
Jonah crabs C. borealis were purchased from The Fresh Lobster Company (Gloucester, Massachusetts, USA) and maintained without food in an artificial seawater tank at 12-13 °C before use. Crabs were then cold anesthetized by packing on ice for 15 minutes before use. Dissection was performed in chilled (approximately 10 °C) physiological saline (composition: 440 mM NaCl; 11 mM KCl; 13 mM CaCl2; 26 mM MgCl2; 10 mM HEPES acid; pH 7.4-7.5 [adjusted with NaOH]). The details of dissection were described previously [9].
Sample Preparation
Immediately following dissection, the brain was rinsed briefly in deionized water to eliminate salt content. Then it was embedded in gelatin (100 mg/mL aqueous) and snap-frozen. Sectioning into 12 μm slices at -25 °C was performed on a cryostat (Leica, Wetzlar, Germany), and the slices were thaw-mounted onto a MALDI plate that had been coated with a thin layer of 2, 5-dihydroxybenzoic acid (DHB) using an airbrush (Paasche airbrush company, Chicago, IL). As shown in Figure 1c, a series of seven pieces of tissues was collected through the z axis of brain with 132 μm in between. Tissues were dehydrated in a desiccator in -20°C freezer for at least 1 h prior to matrix application. For matrix application, two types of spraying methods were compared for their sensitivity and preferential detection of neuropeptides and lipids. For regular spray, 100 mg/ml DHB (50% methanol, v/v) was used as matrix and the airbrush was held 35 cm from the plate. Five coats were applied, and the spray duration for each coat was 30 s with 1 min dry time between each cycle. After each spray application, a small amount of solvent was visible on the tissue surface. Alternatively for dry spray, where 150 mg/ml DHB solution (50% methanol, v/v) was used as matrix, no solvent was observable after each spray application. The flow rate of matrix solution was reduced by manual adjustment and the airbrush was held 55 cm from the plate. This arrangement allowed most of the matrix solvent to evaporate before reaching the plate. The dry spray matrix application required additional matrix coats to be applied to the tissue before the tissue looked visually indistinguishable from regular spray tissue.
Figure 1.

Morphology of C. borealis brain and schematics for MALDI imaging. (a) Optical picture of isolated supraesophageal ganglion (brain) under microscope, with the major nerves and neuropils labeled. (b) Representation of the ventral surface of the isolated C. borealis brain with labeled neuropil regions showing distinctions between the fused ganglia. The brain was arranged the same way as it was observed during dissection. The most anterior portion of the brain, the protocerebrum, is a distributed structure with the protocerebral tract (PT) linking the lateral protocerebrum (not shown) with median protocerebrum (MPC), which contains two paired neuropils, anterior (AMPN) and posterior medial protocerebral neuropils (PMPN). The tritocerebrum (TC) is the most posterior region containing antenna I neuropil (AnN). Located between these fused ganglia is the deutocerebrum (DC), which includes olfactory lobe (ON) and lateral II antenna neuropil (LAN). (c) The schematic diagram of 3D imaging experiments showing serial sectioning along z-axis (numbered according to the sequence of sectioning) of the brain. (d) Comparison of dry matrix spraying and regular matrix spraying for lipid and neuropeptide detection.
Data Acquisition and Processing
A model 4800 MALDI TOF/TOF analyzer (Applied Biosystems, Framingham, MA) equipped with a 200 Hz, 355 nm Nd:YAG laser (spot diameter of 75μm) was used for all mass spectral analyses. Acquisitions were performed in positive ion reflectron mode. Instrument parameters were set using the 4000 Series Explorer Software (Applied Biosystems). The tissue region to be imaged and the raster step size were controlled using the 4800 Imaging application (Novartis, Basel, Switzerland) available through the MALDI MSI web site (www.maldi-msi.org). To generate images, spectra were collected at 100 μm intervals in both the x and y dimensions across the surface of the sample. Each mass spectrum was generated by averaging 200 laser shots over the mass range m/z 600-1800. Individual spectra were acquired using 1.0 ns binning to yield 27,812 data points per spectrum. Mass spectra were externally calibrated using peptide standards applied directly to the stainless steel MALDI target. Tandem mass spectra (MS/MS) were achieved by 2 kV collision induced dissociation (CID) using air as the collision gas. 750 laser shots were averaged for each MS/MS spectrum, and sequence interpretation was performed manually.
Image files were processed, and extracted ion images were created using the TissueView software package (Applied Biosystems). TissueView enables construction of MSI images by reconstructing the x and y coordinates of the spectra in the acquired image file with their original locations on the tissue. Images can be extracted over an m/z window and assigned an intensity-based color scale. To compare images from different sections, the same intensity scales were used. 3D images were constructed and obtained using Image J (http://rsbweb.nih.gov/ij/, NIH). Gray scale images from seven layers of brain tissues constructed with TissueView were imported into Image J and integrated as image stack. Then slices were arranged and viewed using stack function 3D projection. The orientation of each layer was adjusted slightly to match the proportions of original preparation.
Results and Discussion
The crustacean brain is a very complex organ. Several studies reported on the crustacean brain morphology structure and the connection to other neural networks or organs [24, 25]. Figure 1a shows the ventral view of isolated C. borealis brain under microscope (up side of brain during dissection). The multiple neuronal clusters/lobes and numerous nerves can be observed. The schematic drawing of the brain is shown in Figure 1b. There are five major lobes in the crab brain, including anterior (AMPN) and posterior medial protocerebral neuropil (PMPN), olfactory lobe (ON), lateral antenna I neuropil (LAN) and antenna II neuropil (AnN) and tegumentary neuropil (TN). The main body of the decapod crustacean brain consists of three contiguous brain regions, including the median protocerebrum (MPC), deutocerebrum (DC), and tritocerebrum (TC). The paired circumesophageal commissures (coc) are large fibers connected to thoracic ganglion (TG), which can be easily identified during dissection. These two fibers were used to determine the orientation of brain slice on the MALDI plate. The neuropils in the brain are connected via nerve fibers to different peripheral tissues or organs to modulate numerous behaviors and biological processes in response to environmental and chemical inputs. Thus, it is essential to characterize the distribution of neuropeptides in the brain structure, which is crucial to understand their potential biological roles.
Direct Tissue Analysis of Neuropeptides in C. borealis Brain
To study the neuropeptides present in C. borealis brain, direct tissue analysis of brain tissue from different regions were first performed. As shown in Figure 2, we observed very different neuropeptide profiles from three different brain regions including both qualitative and relative quantitative differences. For instance, Cancer borealis tachykinin-related peptide 1a (CabTRP1a m/z 934.5) was detected as one of the most abundant peptides in all three regions; however it is most dominant in the left deutocerebrum (DC) (Figure 2a). Most of the RFamides are more abundant in the median protocerebrum (MPC) area (Figure 2b), and several isoforms from this family are missing from the other two regions. In contrast, orcokinin families are more concentrated in the left tritocerebrum (TC) region (Figure 2c). However exceptions are noted; for example, as an RFamide, DVRTPALRLRFa (m/z 1342.8) and SMPSLRLRFa (m/z 1105.6) are more concentrated in the TC whereas an orcokinin NFDEIDRTGFGFH (m/z 1554.8) is more abundant in the MPC. The results of direct tissue study of brain tissues from different regions demonstrate the complex structure of crustacean brain and extremely heterogeneous distributions of numerous neuropeptides.
Figure 2.
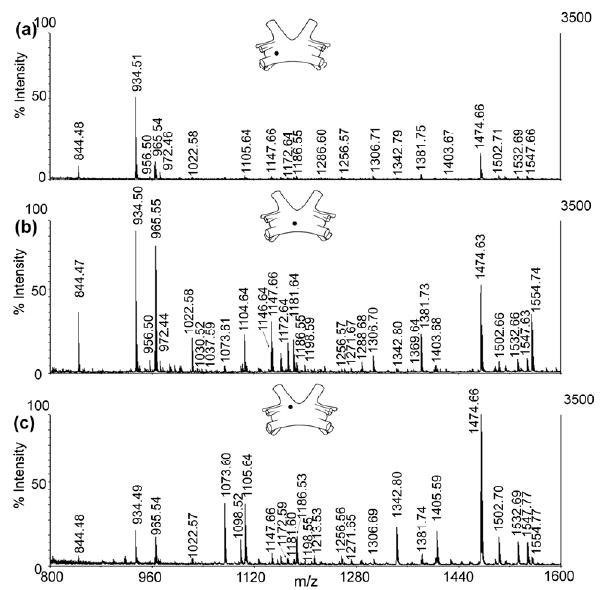
Comparison of direct tissue mass spectra from three discrete regions of C. borealis brain. The solid dark circle indicates the position of tissue in the whole brain structure including (a) medium protocerebrum (MPC), (b) deutocerebrum (DC) and (c) tritocerebrum (TC) from which MS spectrum was acquired.
In total, 20 brain tissue samples from two brains were analyzed. The peaks were assigned based on accurate mass measurement by matching with an in-house C. borealis neuropeptide database (unpublished data). The threshold for assignment was 30 ppm. The peptide identities were further confirmed by CID fragmentation experiments performed directly on the tissue sample. Figure 3 shows two examples of MS/MS spectra, including CabTRP 1a (m/z 934.5, Figure 3a) and an orcokinin peptide (m/z 1474.7, Figure 3b). As seen, almost complete series of fragment ions were observed, providing high confidence for peptide identification. A list of peptides detected in these samples was shown in Table 1. Combining direct tissue profiling and in situ MS/MS analysis, 28 neuropeptides from 8 different families were detected directly from tissue samples, including RFamides, orcokinins, B-type allatostatins, SIFamides, pyrokinin, CabTRPs, orcomyotropin-related peptide and YRamide.
Figure 3.
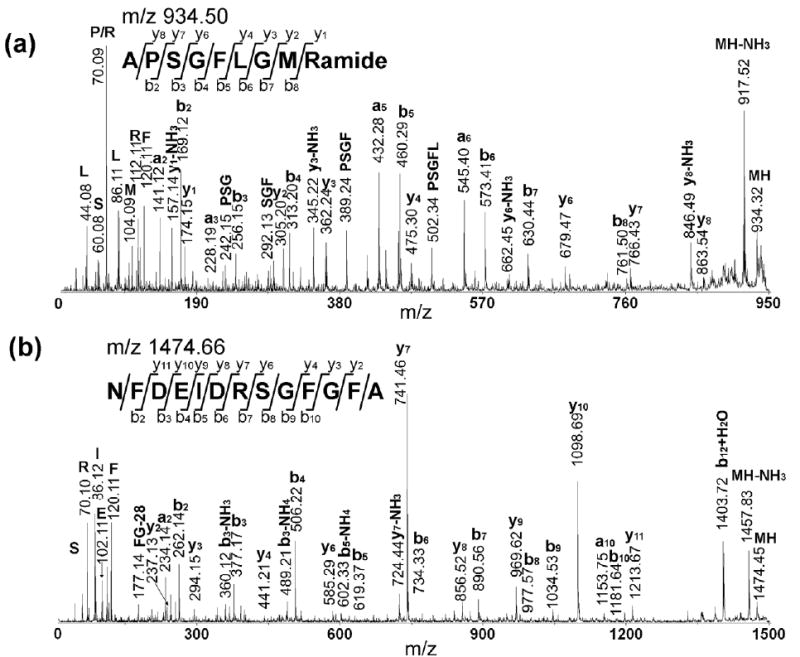
Representative MS/MS sequencing of two neuropeptides obtained directly from the brain tissue sample. The amino acid sequence of each peptide is given above the spectrum. (a) MS/MS fragmentation of CabTRP 1a APSGFLGMRamide (m/z 934.49); (b) MS/MS fragmentation of orcokinin NFDEIDRSGFGFA (m/z 1474. 66). The presence of b and y ions is indicated by horizontal lines above (y ions) or below (b ions) the corresponding amino acid residues in the peptide sequence.
Table 1. Peptides identified by direct tissue analysis of C. borealis brain (N = 20).
| Neuropeptide Sequence | Theoretical m/z | Measured m/z |
|---|---|---|
| RFamides | ||
| NRNFLRFa | 965.54 | 965.54 |
| GNRNFLRFa | 1022.56 | 1022.58 |
| GAHKNYLRFa | 1104.61 | 1104.63 |
| SMPSLRLRFa | 1105.63 | 1105.64 |
| GYSKNYLRFa | 1146.61 | 1146.63 |
| APQRNFLRFa | 1147.65 | 1147.66 |
| AYNRSFLRFa | 1172.63 | 1172.64 |
| SENRNFLRFa | 1181.62 | 1181.64 |
| pQDLDHVFLRFa | 1271.65 | 1271.66 |
| QDLDHVFLRFa | 1288.68 | 1288.68 |
| DVRTPALRLRFa | 1342.81 | 1342.80 |
| Orcokinins | ||
| EIDRSGFGFA | 1198.52 | 1198.55 |
| NFDEIDRSGFG | 1256.57 | 1256.57 |
| NFDEIDRSGFGFA | 1474.66 | 1474.65 |
| NFDEIDRSGFGFV | 1502.69 | 1502.69 |
| NFDEIDRSSFGFV | 1532.70 | 1532.68 |
| NFDEIDRSSFGFN | 1547.68 | 1547.69 |
| NFDEIDRTGFGFH | 1554.70 | 1554.72 |
| B-type Allatostatins (AST-B) | ||
| GNWNKFQGSWa | 1222.58 | 1222.57 |
| NNNWSKFQGSWa | 1366.63 | 1366.66 |
| VPNDWAHFRGSWa | 1470.70 | 1470.69 |
| Orcomyotropin-related peptide | ||
| FDAFTTGFGHS | 1186.52 | 1186.54 |
| SIFamide | ||
| RKPPFNGSIFa | 1161.65 | 1161.67 |
| GYRKPPFNGSIFa | 1381.74 | 1381.74 |
| Cancer borealis tachykinin related peptide (CabTRP) 1a | ||
| APSGFLGMRa | 934.49 | 934.50 |
| TPSGFLGMRa | 964.50 | 964.51 |
| Pyrokinin | ||
| SGGFAFSPRLa | 1037.55 | 1037.58 |
| Others | ||
| HIGSLYRa | 844.48 | 844.48 |
Simultaneous Imaging of Lipids and Neuropeptides in C. borealis Brain by MALDI MS
To investigate the detailed distribution of lipids and peptides in the C. borealis brain throughout the brain structure, three dimensional mass spectrometric imaging by MALDI-TOF/TOF was developed and implemented. As shown in Figure 1c, seven pieces of brain slices were obtained with 132μm between each other, and these slices were evenly distributed along the z axis of brain. 2D MALDI imaging was performed for each layer of tissue, and ion images were generated with TissueView software. The sequential series of 2D images were then reconstructed in three dimensions with a 3D imaging software Image J.
To prepare high quality tissue sections for imaging, it is imperative to preserve the integrity and morphology of the tissue of interest. Two common tissue embedding media, gelatin and OCT, were compared. Gelatin was determined to be a better embedding medium for preserving the integrity of the crab brain. Furthermore, we also found that gelatin provided much cleaner signal background compared to OCT. There were no obvious interfering noise peaks on the tissue surface, and relatively low level noise peaks outside the edge of the tissue slice.
To investigate the effect of solvent on lipid and peptide detection, we compared two matrix application methods, namely dry coating and regular coating using airbrush. Recently, solvent-free matrix application attracted considerable attention due to reduced analyte diffusion and better reproducibility. Several variants derived from this concept have been reported, including sublimation and a few others [26-28]. However, these applications have been focused on lipids and other small molecules. In our experiment, dry coating was achieved simply by adjusting matrix solution flow rate and the distance between the airbrush and the MALDI plate. As shown in Figure 1d, these two matrix application methods yield similar signal intensities and peak patterns for lipids (abundant peaks below 900 Da). However for the dry coating, much fewer peptides with lower signal intensities were observed (above 900 Da). This experiment suggests that solvent free matrix application technique could be beneficial for MALDI imaging of lipids; however certain amount of solvent is crucial for extracting peptides from tissue samples to yield detectable signals. Hence, adjusting humidity of matrix application is essential for achieving sufficient analyte/matrix mixing while retaining the spatial localization of the neuropeptides.
Three Dimensional Distributions of Neuropeptides
Figure 4 shows representative MALDI molecular ion images of six neuropeptides present in the brain across seven layers, including two orcokinins, two RFamides, SIFamide and CabTRP 1a. Most isoforms in the orcokinin family, such as NFDEIDRSGFGFA (m/z 1474.7), are expressed in high abundance in AnN with lower intensity in other regions (Figure 4a). Most RFamides such as NRNFLRFa (m/z 965.5) are concentrated in AMPN and PMPN (Figure 4c). SIFamide GYRKPPFNGSIFa (m/z 1381.7) has similar distribution as most RFamides (Figure 4e). CabTRP 1a (APSGFLGMRa, m/z 934.5) is the most abundant neuropeptide detected in the majority of brain sections, but it has higher concentration in AMPN, PMPN and inner boundary of ON (Figure 4f). Most isoforms from the same family are localized in identical brain areas, suggesting a family colocalization pattern, although several exceptions are seen. For instance, two RFamides, SMPSLRLRFa (m/z 1105.6) (Figure 4d) and DVRTPALRLRFa (m/z 1342.8) (data not shown) are only detected in the AnN region in the first section. Interestingly, both of these two RFamides share the C-terminal sequence of RLRFamide instead of FLRFamide or YLRFamide in the other RFamide members. In addition, one of the orcokinin peptides NFDEIDRTGFGFH (m/z 1554.7) is localized distinctly differently from the rest of the orcokinin family members, and exhibits high abundance in the MPC region. It is also noted that this orcokinin peptide differs from most of the other orcokinin family members at the eighth amino acid residue. This phenomenon indicates that a small difference in peptide sequence may be responsible for a different function a peptide has within the nervous system. Also, a complex composition of each neuropeptide family may suggest varied biological functions of individual members. Clearly, the localization of these individual members often serves as the first step toward elucidating these distinct actions.
Figure 4.
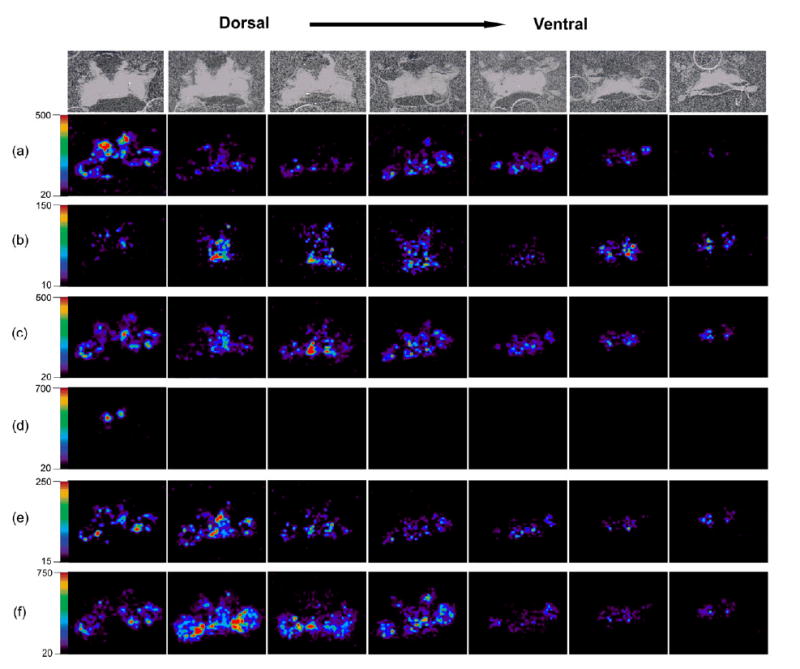
Three dimensional distributions of neuropeptides in C. borealis brain. From left to right, the slices were arranged from dorsal to ventral. The individual optical images of each layer of section are shown in the top panel. Tissue sections were prepared using regular matrix spraying method for neuropeptide detection. Six neuropeptides were shown, including two orcokinins: (a) NFDEIDRSGFGFA (m/z 1474.7) and (b) NFDEIDRTGFGFH (m/z 1554.7); two RFamides: (c) NRNFLRFamide (m/z 965.5) and (d) SMPSLRLRFa (m/z 1105.6); (e) GYRKPPFNGSIFamide (m/z 1381.7); (f) CabTRP 1a APSGFLGMRamide (m/z 934.5). Different distribution patterns are shown between different families and also isoforms within individual families.
By investigating images of serial sections, detailed information on neuropeptide distribution in both 2D and 3D domains can be obtained. All of these neuropeptides are localized around the major neuronal lobes without significant diffusion. In our previous 2D imaging study of crustacean neuropeptides, distribution of SMPSLRLRFa (m/z 1105.6) was observed to exhibit a different distribution pattern from other RFamide isoforms [23]. However, the localization of this peptide appears to be overlapped with most orcokinin isoforms due to the limitation of 2D mapping. Here, the 3D imaging experiments allow a clear distinction of the localization patterns between this unique RFamide and the majority of orcokinin peptides. As shown in Figure 4d, SMPSLRLRFa is only present in the AnN but is absent from the ON and other regions, which is different from orcokinins. This result demonstrates that more accurate description of peptide localization can be achieved via 3D imaging. Figure 5a shows representative 3D image of CabTRP 1a generated using Image J by stacking seven images. The 3D images were visualized from z axis. It is noted that CabTRP 1a is distributed very broadly in different areas of the brain but with higher abundance on the surface of ON.
Figure 5.

Representative reconstructed three-dimensional images of (a) CabTRP 1a and (b) lipid PC 38:6. For images shown in (a), tissue sections were prepared using regular matrix coating method. In contrast, images of (b) were obtained from tissue sections prepared using dry matrix spraying technique that favored detection of lipids.
The MSI data is consistent with the result of our region-specific direct tissue analysis, but the sensitivity of MALDI imaging is relatively lower than regular direct tissue study. Presumably the reduced sensitivity is due to less solvent being deposited on the tissue surface in imaging experiment to limit analyte diffusion as compared to the droplet matrix deposition used for direct tissue analysis. As mentioned earlier, solvent deposition is crucial for peptide detection. In the imaging experiments, we are able to detect 20 neuropeptides in all seven sections as compared to 28 in direct tissue study. However, MSI does not require very precise dissection and also provides better spatial resolution than direct tissue study for peptide mapping. By combining these two techniques, a more complete characterization of neuropeptide localization patterns in target organs can be obtained.
Identification and 3D Mapping of Lipids
While lipids are often viewed as interfering compounds for neuropeptide analysis, their potential roles in signaling have attracted considerable attention [29]. In comparison to other organs and/or systems in an animal, the nervous system contains the largest diversity of lipid classes and lipid molecular species. The diversified neuronal lipids play multiple specific roles in the nervous system, such as forming an impermeable barrier separating intracellular and extracellular compartments, providing an appropriate hydrophobic matrix for membrane protein function, acting as reservoirs for energy deposit which can be rapidly accessed at times of demand, and serving as the source of lipid second messengers of signal transduction [30, 31]. It is evident that many neurological disorders and neurodegenerative diseases are associated with lipids [32, 33]. The study of lipids within nervous system has been termed as neurolipidomics [34]. A recent study reported the use of MALDI ion mobility time-of-flight MS to profile and image lipids from rat brain tissues [35].
As an important experimental model organism, Cancer borealis has been studied extensively for its neuropeptide content; however, few reports exist documenting its lipid composition. In this study, to investigate the content of lipids and their distribution in the crustacean brain, both direct tissue analysis and MALDI imaging were performed on C. borealis brain slices. As shown in Figure 6a, several abundant lipids present in the brain tissue slice are characterized. The identities of these lipids are assigned by accurate mass measurements in combination with MS/MS fragmentation. Figure 6b and 6c show representative spectra of two lipid species, including phosphatidylcholine (PC) and sphingomyelin (SM). Neutral losses of trimethylamine group Δ59Da and product ion from the phosphocholine head chain (m/z 184.1) are observed as the characteristic fragmentation pattern. The detection of ion at m/z 39 suggests the formation of K+ adducts instead of protonated form. Most of the detected lipids are from PC or SM families, suggesting enhanced ionization in the positive ion mode due to the presence of choline group. Many of these detected phospholipids have been reported previously in mammals, suggesting the conservation of lipid molecules among different animal phyla.
Figure 6.
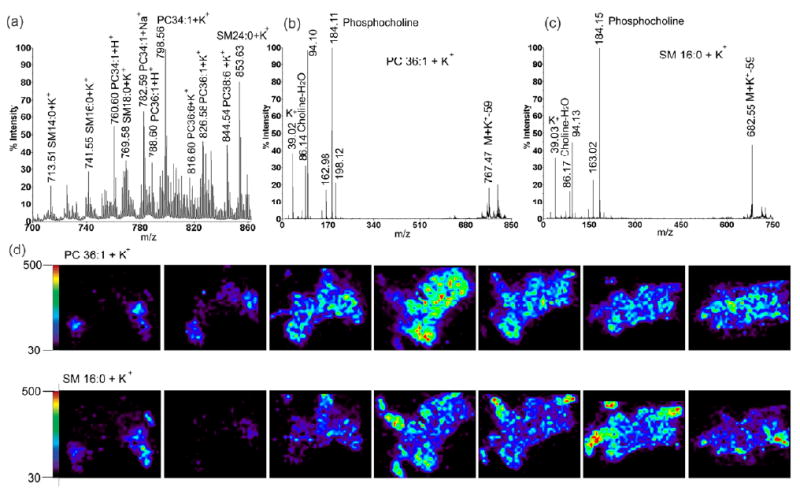
Identification and 3D mapping of lipids in the C. borealis brain. Tissue sections were prepared using dry matrix spraying technique that favored detection of lipids. (a) Representative MS spectrum of direct tissue analysis of lipids from brain slice with the masses and identities of each peak labeled; (b) MS/MS fragmentation of m/z 826.6 (PC 36:1+K+); (c) MS/MS fragmentation of m/z 741.6 (SM 16:0 + K+); Neutral loss of trimethylamine group (Δ59) and product ion m/z 184 demonstrate the presence of phosphocholine head chain in both molecules. (d) Comparison of 3D distribution of two different species of lipids PC 36:1 (upper) and SM 16:0 (lower).
The distribution of lipids is also studied using 3D MALDI imaging. As shown in Figure 6d, two examples of 3D imaging of molecules from both PC and SM classes are presented. Different localization patterns of these two types of lipids are observed with PC localized primarily in the main body of brain, whereas SM has higher abundance in the fibers. These interesting differential localization patterns suggest their different functions in the nervous system despite their chemical similarity. Figure 5b shows the 3D representation of PC38:6. Unlike neuropeptides, the lipids are distributed relatively evenly throughout the whole brain structure instead of being concentrated in a few neuronal clusters.
Conclusions
A simple three dimensional imaging technique was developed and employed to study the distribution of both neuropeptides and lipids in the crustacean brain. Detailed mapping of multiple neuropeptides and lipids throughout 3D structure was performed, demonstrating differential distribution of various neuropeptide and lipid families. By the use of a step size of 100 μm, images of seven sequential tissue slices can be obtained within 3.5 hours for constructing three-dimensional visualization of both neuropeptide and lipid distributions. Combining the in situ MS/MS capability directly from tissue samples, our technique provides a sensitive, reliable, and high throughput analytical tool for simultaneous mapping signaling molecules in various tissue samples.
Acknowledgments
The authors wish to thank the University of Wisconsin-Biotechnology Mass Spectrometry Facility and Drs. Amy Harms and Michael Sussman for access to the MALDI TOF/TOF instrument. We also want to thank Dr. Jeffrey Johnson at the School of Pharmacy University of Wisconsin-Madison for the use of a cryostat and Dr. Michael Nusbaum at the University of Pennsylvania for providing the schematic drawing of C. borealis brain (Figure 1b). Dr. Junhua Wang and Xin Wei from the Li laboratory are acknowledged for assistance with taking optical micrographs of C. borealis brain. This work was supported by the National Science Foundation CAREER Award (CHE-0449991) program and the National Institutes of Health through grant 1R01DK071801. R.M.S. acknowledges the NIH-supported Clinical Neuroengineering Training Program Predoctoral Fellowship (NIH T90 DK070079). L.L. acknowledges an Alfred P. Sloan Research Fellowship.
Footnotes
Publisher's Disclaimer: This is a PDF file of an unedited manuscript that has been accepted for publication. As a service to our customers we are providing this early version of the manuscript. The manuscript will undergo copyediting, typesetting, and review of the resulting proof before it is published in its final citable form. Please note that during the production process errors may be discovered which could affect the content, and all legal disclaimers that apply to the journal pertain.
References
- 1.Crecelius AC, Cornett DS, Caprioli RM, Williams B, Dawant BM, Bodenheimer B. Three-Dimensional Visualization of Protein Expression in Mouse Brain Structures Using Imaging Mass Spectrometry. J Am Soc Mass Spectrom. 2005;16:1093–1099. doi: 10.1016/j.jasms.2005.02.026. [DOI] [PubMed] [Google Scholar]
- 2.Andersson M, Groseclose MR, Deutch AY, Caprioli RM. Imaging Mass Spectrometry of Proteins Peptides: 3D Volume Reconstruction. Nat Methods. 2008;5:101–108. doi: 10.1038/nmeth1145. [DOI] [PubMed] [Google Scholar]
- 3.Fu Q, Kutz KK, Schmidt JJ, Hsu YW, Messinger DI, Cain SD, de la Iglesia HO, Christie AE, Li L. Hormone Complement of the Cancer Productus Sinus Gland andPericardial Organ: An Anatomical and Mass Spectrometric Investigation. J Comp Neurol. 2005;493:607–626. doi: 10.1002/cne.20773. [DOI] [PubMed] [Google Scholar]
- 4.Fu Q, Goy MF, Li L. Identification of Neuropeptides from the Decapod Crustacean Sinus Glands Using Nanoscale Liquid Chromatography Tandem Mass Spectrometry. Biochem Biophys Res Commun. 2005;337:765–778. doi: 10.1016/j.bbrc.2005.09.111. [DOI] [PubMed] [Google Scholar]
- 5.Li L, Pulver SR, Kelley WP, Thirumalai V, Sweedler JV, Marder E. Orcokinin Peptides in Developing and Adult Crustacean Stomatogastric Nervous Systems and Pericardial Organs. J Comp Neurol. 2002;444:227–244. doi: 10.1002/cne.10139. [DOI] [PubMed] [Google Scholar]
- 6.Bulau P, Meisen I, Schmitz T, Keller R, Peter-Katalinic J. Identification of Neuropeptides from the Sinus Gland of the Crayfish Orconectes Limosus Using Nanoscale On-Line Liquid Chromatography Tandem Mass Spectrometry. Mol Cell Proteomics. 2004;3:558–564. doi: 10.1074/mcp.M300076-MCP200. [DOI] [PubMed] [Google Scholar]
- 7.Fu Q, Tang LS, Marder E, Li L. Mass Spectrometric Characterization and Physiological Actions of VPNDWAHFRGSWamide, a Novel B Type Allatostatin in the Crab. Cancer borealis J Neurochem. 2007;101:1099–1107. doi: 10.1111/j.1471-4159.2007.04482.x. [DOI] [PubMed] [Google Scholar]
- 8.Ma M, Chen R, Sousa GL, Bors EK, Kwiatkowski MA, Goiney CC, Goy MF, Christie AE, Li L. Mass Spectral Characterization of Peptide Transmitters/Hormones in the Nervous System and Neuroendocrine Organs of the American Lobster Homarus Americanus. Gen Comp Endocrinol. 2008;156:395–409. doi: 10.1016/j.ygcen.2008.01.009. [DOI] [PMC free article] [PubMed] [Google Scholar]
- 9.Kutz KK, Schmidt JJ, Li L. In Situ Tissue Analysis of Neuropeptides by MALDI FTMS In-Cell Accumulation. Anal Chem. 2004;76:5630–5640. doi: 10.1021/ac049255b. [DOI] [PubMed] [Google Scholar]
- 10.Stemmler EA, Cashman CR, Messinger DI, Gardner NP, Dickinson PS, Christie AE. High-Mass-Resolution Direct-Tissue MALDI-FTMS Reveals Broad Conservation of Three Neuropeptides (APSGFLGMRamide, GYRKPPFNGSIFamide AND PQDLDHVFLRFamide) across Members of Seven Decapod Crustaean Infraorders. Peptides. 2007;28:2104–2115. doi: 10.1016/j.peptides.2007.08.019. [DOI] [PubMed] [Google Scholar]
- 11.Rubakhin SS, Churchill JD, Greenough WT, Sweedler JV. Profiling Signaling Peptides in Single Mammalian Cells Using Mass Spectrometry. Anal Chem. 2006;78:7267–7272. doi: 10.1021/ac0607010. [DOI] [PMC free article] [PubMed] [Google Scholar]
- 12.Neupert S, Predel R. Mass Spectrometric Analysis of Single Identified Neurons of an Insect. Biochem Biophys Res Commun. 2005;327:640–645. doi: 10.1016/j.bbrc.2004.12.086. [DOI] [PubMed] [Google Scholar]
- 13.Monroe E, Annangudi SP, Hatcher NG, Gustein HB, Rubakhin SS, Sweedler JV. SIMS and MALDI MS Imaging of the Spinal Cord. PROTEOMICS. 2008;8:3746–3754. doi: 10.1002/pmic.200800127. [DOI] [PMC free article] [PubMed] [Google Scholar]
- 14.Boonen K, Landuyt B, Baggerman G, Husson SJ, Huybrechts J, Schoofs L. Peptidomics: The Integrated Approach of MS, Hyphenated Techniques and Bioinformatics for Neuropeptide Analysis. J Sep Sci. 2008;31:427–445. doi: 10.1002/jssc.200700450. [DOI] [PubMed] [Google Scholar]
- 15.Altelaar AFM, Klinkert I, Jalink K, deLange RPJ, Adan RAH, Heeren RMA, Piersma SR. Gold-Enhanced Biomolecular Surface Imaging of Cells and Tissue by SIMS and MALDI Mass Spectrometry. Anal Chem. 2006;78:734–742. doi: 10.1021/ac0513111. [DOI] [PubMed] [Google Scholar]
- 16.Cornett DS, Reyzer ML, Chaurand P, Caprioli RM. MALDI Imaging Mass Spectrometry: Molecular Snapshots of Biochemical Systems. Nat Meth. 2007;4:828–833. doi: 10.1038/nmeth1094. [DOI] [PubMed] [Google Scholar]
- 17.Chaurand P, Norris JL, Cornett DS, Mobley JA, Caprioli RM. New Developments in Profiling and Imaging of Proteins from Tissue Sections by MALDI Mass Spectrometry. J Proteome Res. 2006;5:2889–2900. doi: 10.1021/pr060346u. [DOI] [PubMed] [Google Scholar]
- 18.Gallus L, Bottaro M, Ferrando S, Girosi L, Ramoino P, Tagliafierro G. Distribution of FMRFamide-Like Immunoreactivity in the Alimentary Tract and Hindgut Ganglia of the Barnacle Balanus amphitrite (Cirripedia, Crustacea) Microscopy Res Technique. 2006;69:636–641. doi: 10.1002/jemt.20333. [DOI] [PubMed] [Google Scholar]
- 19.Sousa GL, Lenz PH, Hartline DK, Christie AE. Distribution of Pigment Dispersing Hormone- and Tachykinin-Related Peptides in the Central Nervous System of the Copepod Crustacean Calanus Finmarchicus. Gen Comp Endocrinol. 2008;156:454–459. doi: 10.1016/j.ygcen.2008.03.008. [DOI] [PubMed] [Google Scholar]
- 20.Polanska M, Yasuda A, Harzsch S. Immunolocalization of Crustacean-SIFamide in the Median Brain and Eyestalk Neuropils of the Marbled Crayfish. Cell Tissue Res. 2007;330:331–344. doi: 10.1007/s00441-007-0473-8. [DOI] [PubMed] [Google Scholar]
- 21.Marder E, Bucher D. Understanding Circuit Dynamics Using the Stomatogastric Nervous System of Lobsters and Crabs. Annu Rev Physiol. 2007;69:291–316. doi: 10.1146/annurev.physiol.69.031905.161516. [DOI] [PubMed] [Google Scholar]
- 22.Skiebe P, Dietel C, Schmidt M. Immunocytochemical Localization of FLRFamide-, Proctolin-, and CCAP-Like Peptides in the Stomatogastric Nervous System and Neurohemal Structures of the Crayfish, Cherax Destructor. J Comp Neurol. 1999;414:511–532. [PubMed] [Google Scholar]
- 23.DeKeyser SS, Kutz-Naber KK, Schmidt JJ, Barrett-Wilt GA, Li L. Imaging Mass Spectrometry of Neuropeptides in Decapod Crustacean Neuronal Tissues. J Proteome Res. 2007;6:1782–1791. doi: 10.1021/pr060603v. [DOI] [PMC free article] [PubMed] [Google Scholar]
- 24.Kirby M, Nusbaum M. Central Nervous System Projections to and from the Commissural Ganglion of the Crab Cancer borealis. Cell Tissue Res. 2007;328:625–637. doi: 10.1007/s00441-007-0398-2. [DOI] [PubMed] [Google Scholar]
- 25.Sandeman D, Sandeman R, Derby C, Schmidt M. Morphology of the Brain of Crayfish, Crabs, and Spiny Lobsters: A Common Nomenclature for Homologous Structures. Biol Bull. 1992;183:304–326. doi: 10.2307/1542217. [DOI] [PubMed] [Google Scholar]
- 26.Hankin JA, Barkley RM, Murphy RC. Sublimation as a Method of Matrix Application for Mass Spectrometric Imaging. J Am Soc Mass Spectrom. 2007;18:1646–1652. doi: 10.1016/j.jasms.2007.06.010. [DOI] [PMC free article] [PubMed] [Google Scholar]
- 27.Puolitaival SM, Burnum KE, Cornett DS, Caprioli RM. Solvent-Free Matrix Dry-Coating for MALDI Imaging of Phospholipids. J Am Soc Mass Spectrom. 2008;19:882–886. doi: 10.1016/j.jasms.2008.02.013. [DOI] [PMC free article] [PubMed] [Google Scholar]
- 28.Hanton SD, McEvoy TM, Stets JR. Imaging the Morphology of Solvent-Free Prepared MALDI Samples. J Am Soc Mass Spectrom. 2008;19:874–881. doi: 10.1016/j.jasms.2008.02.009. [DOI] [PubMed] [Google Scholar]
- 29.Piomelli D. The Challenge of Brain Lipidomics. Prostaglandins & Other Lipid Mediators. 2005;77:23–34. doi: 10.1016/j.prostaglandins.2004.09.006. [DOI] [PubMed] [Google Scholar]
- 30.Han X. Neurolipidomics: Challenges and Developments. Front Biosci. 2007;12:2601–2615. doi: 10.2741/2258. [DOI] [PMC free article] [PubMed] [Google Scholar]
- 31.Chen C, Bazan NG. Lipid Signaling: Sleep, Synaptic Plasticity, and Neuroprotection. Prostaglandins & Other Lipid Mediators. 2005;77:65–76. doi: 10.1016/j.prostaglandins.2005.07.001. [DOI] [PubMed] [Google Scholar]
- 32.Horinouchi K, Erlich S, Perl DP, Ferlinz K, Bisgaier CL, Sandhoff K, Desnick RJ, Stewart CL, Schuchman EH. Acid Sphingomyelinase Deficient Mice: A Model of Types a and B Niemann-Pick Disease. Nat Genet. 1995;10:288–293. doi: 10.1038/ng0795-288. [DOI] [PubMed] [Google Scholar]
- 33.Shobab LA, Hsiung GYR, Feldman HH. Cholesterol in Alzheimer's Disease. The Lancet Neurology. 2005;4:841–852. doi: 10.1016/S1474-4422(05)70248-9. [DOI] [PubMed] [Google Scholar]
- 34.Woods AS, Jackson SN. Brain Tissue Lipidomics: Direct Probing Using Matrix-Assisted Laser Desorption/Ionization Mass Spectrometry. AAPS J. 2006;8:E391–395. doi: 10.1007/BF02854910. [DOI] [PMC free article] [PubMed] [Google Scholar]
- 35.Jackson SN, Ugarov M, Egan T, Post JD, Langlais D, Albert Schultz J, Woods AS. MALDI-Ion Mobility-TOF MS Imaging of Lipids in Rat Brain Tissue. J Mass Spectrom. 2007;42:1093–1098. doi: 10.1002/jms.1245. [DOI] [PMC free article] [PubMed] [Google Scholar]