

Abstract
The differential diagnostic process attempts to identify candidate diseases that best explain a set of clinical features. This process can be complicated by the fact that the features can have varying degrees of specificity, as well as by the presence of features unrelated to the disease itself. Depending on the experience of the physician and the availability of laboratory tests, clinical abnormalities may be described in greater or lesser detail. We have adapted semantic similarity metrics to measure phenotypic similarity between queries and hereditary diseases annotated with the use of the Human Phenotype Ontology (HPO) and have developed a statistical model to assign p values to the resulting similarity scores, which can be used to rank the candidate diseases. We show that our approach outperforms simpler term-matching approaches that do not take the semantic interrelationships between terms into account. The advantage of our approach was greater for queries containing phenotypic noise or imprecise clinical descriptions. The semantic network defined by the HPO can be used to refine the differential diagnosis by suggesting clinical features that, if present, best differentiate among the candidate diagnoses. Thus, semantic similarity searches in ontologies represent a useful way of harnessing the semantic structure of human phenotypic abnormalities to help with the differential diagnosis. We have implemented our methods in a freely available web application for the field of human Mendelian disorders.
Introduction
Making the correct diagnosis is arguably the most important role of the physician. Clinical diagnostics is often challenging, especially in the field of medical genetics, where the differential diagnosis is complicated by the shear numbers of Mendelian and chromosomal disorders, each of which may be characterized by numerous clinical features that are often shared by many diseases. In addition, pleiotropy and variable expression of individual disorders mean that individual patients with a given disease may have different, partially overlapping combinations of clinical signs and symptoms. A timely and correct genetic diagnosis is important for avoiding unnecessary diagnostic procedures, identifying appropriate therapeutic measures and clinical management strategies, and providing adequate genetic counseling. However, an etiological diagnosis can be made in only about half or fewer of the children presenting with dysmorphic signs with or without mental retardation.1–5
Because of these difficulties, a number of genetic databases have been developed, including POSSUM6 and the London Dysmorphology Database (LDDB),7 as well as the search routines available with the Online Mendelian Inheritance in Man (OMIM) website8 and Orphanet.9 Users enter one or more features and are presented with a list of candidate diagnoses that are characterized by some or all of the features. However, these systems do not provide explicit rankings or measures of plausibility for the potentially long lists of search results. None of the systems explicitly use semantic relationships between clinical features in order to weight search results.
In this paper, we present a method for clinical diagnostics based on a newly developed ontological search routine that uses the semantic structure of the Human Phenotype Ontology (HPO)10 to weight clinical features on the basis of specificity and to identify those clinical features that best distinguish among the top candidate differential diagnoses. We have developed a statistical model to assign a p value to the score obtained by searching on n terms, corresponding to the probability of obtaining a given similarity score or better by choosing the same number of query terms at random. Intuitively, if the highest-scoring candidate diagnosis has a significant p value, this would indicate to the clinician that this syndrome is a likely differential diagnosis and should be considered further. If, on the other hand, the highest-scoring candidate does not have a significant p value, this could indicate that the combination of phenotypic abnormalities entered by the physician is not specific enough to allow a diagnosis, or that the combination of features pertains to a clinical entity that is not represented in the database being queried.
Material and Methods
An ontology is a computational representation of a domain of knowledge based upon a controlled, standardized vocabulary for describing entities and the semantic relationships between them. Many ontologies are structured as a directed acyclic graph (DAG), whereby the nodes of the DAG, which are also called terms of the ontology, correspond to concepts of the domain. After the success of Gene Ontology,11 ontologies have been developed for many fields in biomedical science.12 We developed the HPO in order to provide a standardized vocabulary of phenotypic abnormalities encountered in human disease.10 For the comparisons described here, the version of the HPO from May 6, 2009 was used. This version is available as version 1.58 from the National Center of Bioontologies (NCBO) Bioportal website, where the HPO can be found via ontology ID 1125. In this version, the HPO contains nearly 9000 terms. Each term in the HPO describes a phenotypic abnormality, such as atrial septal defect. These terms are related to parent terms by “is a” relationships, meaning that they represent a subclass of a more general parent term. In contrast to strict hierarchies, the data structures used to represent ontologies (e.g., DAGs) allow a term to have multiple parent terms. In the HPO, multiple parentage allows the different aspects of phenotypic abnormalities to be represented. The phenotypic feature atrial septal defect, for instance, has the parent terms abnormality of the cardiac septa and abnormality of the cardiac atria, both describing a cardiac abnormality (Figure 1). Annotation is the process of assigning ontology terms (concepts) for the description of objects. In the case of the HPO, ontology terms corresponding to phenotypic abnormalities are used for annotation of diseases. Currently, almost 50,000 annotations to 4813 diseases listed in OMIM are provided. The true path rule applies to all terms in the HPO. That is, if a disease is annotated to the term atrial septal defect, it is implicitly annotated to all ancestors of this term (for instance, Ellis-van Creveld syndrome is annotated to atrial septal defect, and it is therefore implicitly annotated to all the ancestors of that term, such as cardiac malformation) (Figure 1).
Figure 1.
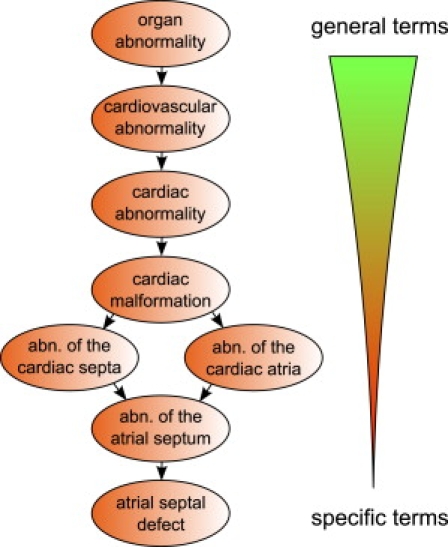
The Human Phenotype Ontology
The HPO is represented as a directed acyclic graph, in which terms represent a specific type of a more general parent term. Terms may have multiple parents reflecting multiple semantic relationships. Links between the terms represent subclass (“is a”) relationships, such that children are more specific subclasses of their parents. For instance, the clinical feature abnormality of the atrial septum is a child of abnormality of the cardiac septa and abnormality of the cardiac atria. The HPO currently has nearly 9000 terms.
The importance of a clinical finding for the differential diagnosis depends on its specificity. In ontologies, specificity is reflected by the information content (IC) of a term. The frequency of a term is defined as the proportion of objects that are annotated by the term or any of its descendent terms. The IC is then defined as the negative natural logarithm of the frequency.13 Thus, the IC of terms tends to grow as we move from the root of an ontology to more specific descendent terms. In our implementation, the IC of a phenotypic feature t is defined on the basis of its frequency within our annotation database. For instance, atrioventricular block is used to annotate three diseases among a total of 4813 diseases, so that its IC is calculated as −log(3/4813) = 7.38. The more general term abnormality of the musculoskeletal system pertains to 2352 diseases, so its IC is −log(2352/4813) = 0.72.
The similarity between two terms can be calculated as the IC of their most informative common ancestor (MICA).14 For instance, in Figure 1, the similarity between the terms abnormality of the cardiac septa and abnormality of the cardiac atria is calculated as the IC of the term cardiac malformation.
We can use above-mentioned term-similarity measures to calculate a similarity score on the basis of the query terms entered by the physician and the terms used to annotate the diseases in a database. Several similarity measures have been proposed14–16 and have been applied to the biomedical domain.17–20 In our case, for each of the query terms, the “best match” among the terms annotated to the disease is found and the average over all query terms is calculated. This is defined as the similarity:
| (Equation 1) |
Figure 2 provides an overview of the approach. This measure will return a high score if a good match is found for each term in the query. In the following text, we will refer to this method as the Ontological Similarity Search (OSS). Note that Equation 1 does not take into account the fact that there could be a number of terms annotated to the syndrome in addition to those used for the maximum match. For instance, this would be the case if a specific query is compared to two syndromes, both of which are annotated by terms that exactly match the query but one of which is annotated by a number of additional terms. With the one-sided formula (Equation 1) used, both syndromes would receive the same score. It is also possible to define a symmetric version of Equation 1 in which the similarity of the query to the disease is averaged with the similarity of the disease to the query:
| (Equation 2) |
Figure 2.
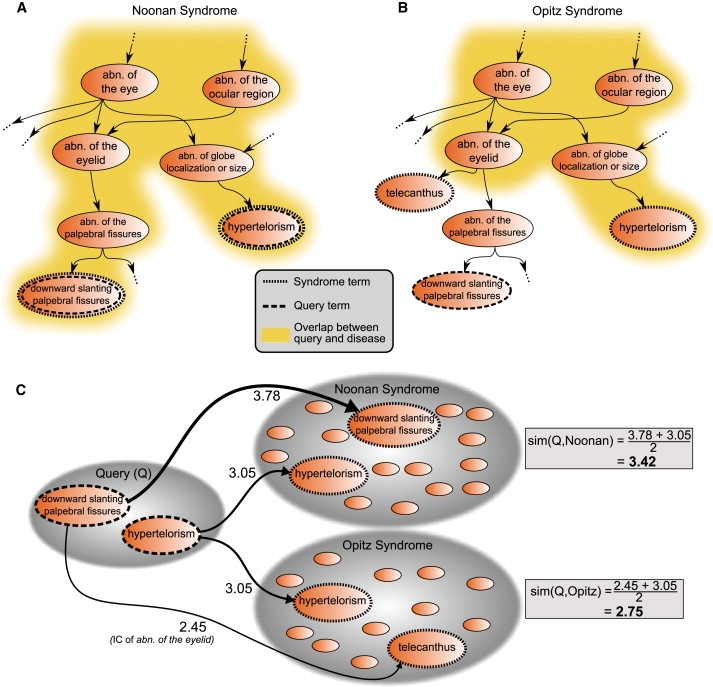
Searching in Ontologies
Calculation of phenotypic similarity between the query terms downward slanting palpebral fissures and hypertelorism with annotations of Noonan syndrome (MIM 163950) (A) and Opitz G/BBB syndrome (MIM 300000) (B). Note that not all of the annotations for these syndromes are shown. Because the feature downward slanting palpebral fissures is not annotated to Opitz G/BBB syndrome, the overlap (dark yellow area) of the query terms is less for Opitz G/BBB syndrome than for Noonan syndrome. The implications for the calculation for the similarity score can be seen in (C). In Noonan syndrome, there is a perfect match for every query term with a term used to annotate the disease. In contrast, the best match for downward slanting palpebral fissures among the annotations of Opitz G/BBB syndrome is telecanthus. The most informative common ancestor of these two terms is abnormality of the eyelid; therefore, the information content (IC) of abnormality of the eyelid is taken to be the similarity between the two terms. The similarity between the query and the diseases is then defined as the average maximum similarity score for each of the query terms, and the query is found to be more similar to Noonan syndrome than to Opitz G/BBB syndrome.
We also implemented a simple feature vector (FV) method, in which the exact overlap between Q and D is calculated. This method is meant to be similar to text-matching methods used by POSSUM6 and the London Dysmorphology Database,7 as well as the search routines available with the OMIM website8 and Orphanet.9 However, we note that we did not attempt to perform an explicit comparison with these databases because of the different clinical vocabularies used by each of these databases and the fact that they do not provide a ranking for the results of searches.
p Value Calculation
The raw similarity score depends on a number of factors, including the number and specificity of the terms both of the query and of the diseases represented in the database. It is thus not possible to say what score constitutes a “good match” for a general query. We have therefore developed a statistical model based on the distribution of similarity scores that is obtained by randomly choosing combinations of HPO terms. Intuitively, random combinations of clinical features are unlikely to be observed in real diseases, so that the scores obtained by entering a combination of terms that characterize a given disease are higher. If a given score is only rarely obtained by chance, then we consider it to be statistically significant.
We estimated a p value for each search result that indicates the probability of obtaining the same or higher similarity scores by a randomly generated query set of the same size. The p values are estimated by Monte Carlo random sampling and corrected for multiple testing by the method of Benjamini and Hochberg.21 For each query, similarity scores are calculated for each disease in the database, and the best differential diagnoses are returned to the user, ranked by p value. We will refer to this method as Ontological Similarity Search with p values (OSS-PV).
Our similarity score is based on an average over all of the scores for the individual query terms (see Equations 1 and 2). Thus, the probability of observing a certain (or higher) score S in a similarity search with two query terms is different than that in a similarity search with six query terms. That means we need to compute the p value for every number of query terms q that we allow for the search. Unfortunately, the exhaustive computation of all possible choices is infeasible, because the number of combinations grows exponentially with q. Instead, we take a Monte Carlo approach and approximate the complete probability distribution with 100,000 random searches on the HPO for every OMIM entry. The simulation is repeated for searches with q = 1…10 query terms, for each of the similarity measures to be tested. We stored on disk all possible scores for every OMIM entry (rounded to four decimal places) and the associated p value. For 11 or more terms, we used the precalculated distribution for ten terms.
Performance Evaluation and Generation of Simulated Patients
It is difficult to validate a diagnostic algorithm by using real patients for a number of reasons, mainly because it is difficult to get phenotypic information about hundreds or thousands of patients (which would be needed for statistical validation) that has been collected with the use of a standardized procedure and a standardized vocabulary. We therefore took an informatic approach, in which we generated clinical data for “simulated patients” on the basis of the frequency of clinical features among persons diagnosed with a certain disease. We identified 44 complex dysmorphology syndromes for which adequate frequency data were available (see Tables S1–S45, available online), and we used this information to generate the simulated patients. We assumed that the occurrence of individual clinical features is independent. Although this assumption is not correct, sufficient data are currently not available for modeling of the interdependencies of clinical features. For instance, in order to generate patients for a disease with the features A, B, and C, in which A occurs in 50%, B occurs in 70%, and C occurs in 10% of patients, we use a random number generator to generate three random numbers uniformly distributed between 0 and 100. If the first number is less than 50, we assign the feature A to the simulated patient, and otherwise we do not. If the second number is less than 70, we assign B to the patient, and if the third number is less than 10, we assign C to the patient. We then repeat this procedure 100 times in order to generate 100 patients with different combinations of clinical features. Because some of the diseases have gender-specific features, we first decided whether the patient was male or female and adjusted the simulation accordingly.
In clinical practice, patients can not only have signs and symptoms that are related to some underlying disorder but may also have unrelated clinical problems. We refer to this as “noise.” In oder to simulate noise, we added again half as many noise terms to the terms selected from the underlying disease. That means that if the patient had nine features, we added four randomly selected terms. We ensured that the noise terms were not ancestors or descendents of the terms annotated to the disease or of each other.
Another difficultly with clinical databases is that physicians may not choose the same phrase to describe some clinical anomaly as that which is used in the database. This may be because the physician is unaware of the correct terminology or because detailed laboratory or clinical investigations have yet to be performed and a clinical anomaly can only be described on a general level. We refer to this as “imprecision.” When the imprecision mode was turned on, every feature of the patient was randomly replaced by one of its ancestors, except the root of the ontology (organ abnormality).
When both “noise” and “imprecision” were applied, we first performed the imprecision step (which may lead to a reduced number of features of the patient, for instance, if two query terms are mapped to the same ancestor term) and afterwards applied the noise-step.
Results
The Phenomizer
We have implemented the algorithms described above in a web application called the Phenomizer (Figure S1), and we will now demonstrate how ontological search algorithms can be used to assist the diagnostic workflow. Imagine that a nine-year-old boy is presented for workup of developmental retardation and is additionally found to have arachnodactyly, pectus excavatum, and scoliosis. Initial analysis with the Phenomizer with the use of the corresponding terms yields a list of differential diagnoses with p values starting at 0.1. This lack of significance reflects the fact that the clinical findings are not specific enough, per se, to allow a diagnosis. The physician can now use the Phenomizer to generate a list of clinical features that are most specific for individual diagnoses in a set of selected syndromes and can use this list to guide the further workup. For instance, one of the features returned, when all syndromes with p values less than 0.5 are selected, is arterial tortuosity, generalized, which could prompt further investigations such as magnetic resonance imaging of the vasculature. In this case, adding this feature to the list of features leads to a significant p value for Loeys-Dietz syndrome 1A.22 The clinical features returned by the Phenomizer can prompt more exact clinical examination (e.g., fine, brittle hair) or technical examinations (e.g., radiography to search for codfish vertebrae). In many cases, adding one of these terms to the patient features has the effect of making one or a few of the diagnoses significant (Table 1), which may help physicians plan the further workup by referring to an appropriate specialist or performing genetic mutation analysis.
Table 1.
The Semantic Structure of the HPO Can be Used for Identifying Features that Best Discriminate among Differential Diagnoses
| Additional Feature | Best Differential Diagnosis | Number of Differential Diagnoses with p < 0.05 |
|---|---|---|
| Arterial tortuosity, generalized | Loeys-Dietz syndrome 1A | 1 |
| Codfish vertebrae | MRXS14 | 2 |
| Broad femoral metaphyses | CATSHL syndrome | 1 |
| Arnold-Chiari type I malformation | Shprintzen-Goldberg syndrome | 1 |
| Fine, brittle hair | Homocystinuria | 1 |
The semantic structure of the HPO can be used for identifying features that best discriminate among differential diagnoses. For instance, searching on the terms developmental retardation, arachnodactyly, pectus excavatum, and scoliosis initially returns a list of differential diagnoses starting with p values at 0.1. The Phenomizer provides a list of HPO terms that would best distinguish between selected differential diagnoses. This can suggest possibilities for further examinations that would help to narrow down the differential diagnosis. If such a feature is found, users can add the corresponding term to the list of patient features and recalculate the statistical significance of the resulting similarity scores. This table shows exemplary results of adding individual terms to the search. For each term, the best diagnosis is shown together with the total number of differential diagnoses with a p value of 0.05 or less. In the case of ties, only one, arbitrarily chosen diagnosis is shown. Abbreviations are as follows: MRXS14, mental retardation, X-linked, syndromic 14 (MIM 300676); CATSHL, camptodactyly, tall stature, scoliosis, and hearing loss (MIM 610474).
Evaluating the Phenomizer with Simulated Patients
It is difficult to compare the performance of our method to that of other systems such as POSSUM or LDDB because these systems use different vocabularies to describe clinical features and do not provide p values or rankings for candidate diagnoses. Nonetheless, we developed a testing scheme to compare the Phenomizer to simpler matching schemes, which simply count the number of clinical features from a query set that are present in a disease (FV). We note that the FV method does not take the semantic inheritance structure of the ontology into account. It essentially compares two vectors of zeros and ones with one field for each of the clinical features being compared, whereby the vector has a “1” if a feature is present and a “0” if it is not present. The dot product of a query vector (with the features observed by the physician) and the disease vector (with all of the features characterizing a disease) then yields a count of common features. The disease with the highest count is taken to be the best differential diagnosis.
We also simulated the effects of adding “noise” (i.e., additional clinical features not related to the underlying diagnosis) to the query and of using “imprecise” terms (i.e., replacing query terms with randomly chosen ancestors of the terms; for instance, replacing the term atrial septal defect with abnormality of the cardiac septa) (Figure 1). Additional information about the procedures can be found in the Material and Methods section. We then collected comprehensive clinical information on 44 complex dysmorphology syndromes from the literature, including information on what proportion of patients have any given clinical feature, and used this information to generate 100 virtual patients with each syndrome, whereby the probability of any virtual patient having a given clinical feature is taken to be the proportion of patients from the literature with the feature (see Tables S1–S45). We ranked the complete database of 4813 OMIM diseases by calculating the similarity of the simulated patient to every OMIM disease and recorded the rank of the correct diagnosis returned by the Phenomizer. In the case of ties, the average rank was returned (e.g., if three syndromes each received the best score, all three were assigned rank 2). When the ranking was done by p value and two or more diseases had the same p value, the score is used for ranking, such that ties are only possible if the p value and the score are identical. The results of this simulation procedure are shown in Figure 3.
Figure 3.
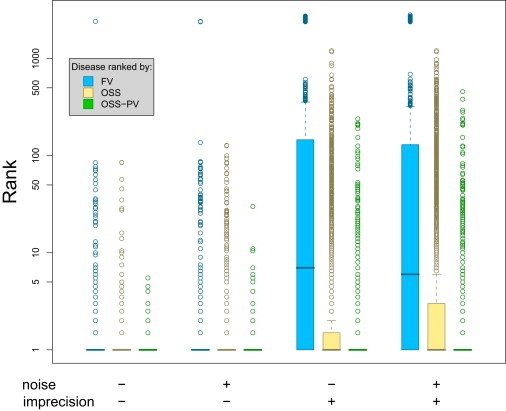
Performance Evaluation
Rankings of correct differential diagnosis of the simulated patients by the feature vector (FV) method, ontological similarity search (OSS), and p value (OSS-PV). Lower ranks indicate superior performance, a rank of 1 being the optimum result. A boxplot of the median ranks for each of the simulated patients for each of the three methods is displayed with different combinations of noise (adding randomly chosen terms) and imprecision (replacing terms by more general ancestor terms). Each boxplot shows 50% of the data points surrounding the median in the box, where the position displays the skewness of the data. The whiskers extend to the most extreme data point that is no more than 1.5 times the length of the box away from the box. More extreme outliers are displayed as circles. In all testing situations (with or without noise, with or without imprecision), the OSS-PV method showed a significantly better performance in comparison to ranking according to raw scores (OSS) or the FV method (p < 2.2 × 10⁻¹⁶; Mann-Whitney test). The semantic similarity metric (OSS-PV) used by the Phenomizer is especially robust against randomly added additional features and when parent terms of syndrome annotations are used in the query.
It can be seen that both ontological methods (OSS and OSS-PV) have a modest advantage over the feature-vector (FV) method in an ideal situation with no noise or imprecision. The performance of the FV method deteriorates somewhat when phenotypic noise is added. The effect of imprecision simulates the situation when the physician enters a term to describe a clinical feature that is more general than the term used in the database. It can be seen that the performance of the FV method greatly suffers in this situation, whereas that of the ontological methods, which intuitively use the semantic network encoded in the ontology to recognize that the imprecise term has a meaning similar to that of the term used in the database, shows only a minimal decrease in performance. The OSS-PV, which bases the ranking on the p value of attaining a given score for each disease in the database (OSS-PV), was superior to the results of ranking on the basis of the raw similarity scores (OSS). This reflects the fact that the distribution of similarity scores is not the same for all diseases in the database (results not shown) and suggests that search methods that take the local score distributions into account are superior. In sum, we have shown that ontological approaches (OSS, OSS-PV) are especially robust in the presence of noise and are not overly dependent on the exact search terms being used. Clearly, OSS-PV significantly outperforms all other methods (p < 2.2 × 10⁻¹⁶; Mann-Whitney test).
There are a number of different ways of performing an ontological similarity search. The results presented above are based on a one-sided search using a similarity measure based on the information content of the most informative common ancestor (Equation 1), whereby the “best match” is sought for each query term among all terms used to annotate a disease. We also performed the analysis by using the symmetric version of the similarity score (Equation 2). The corresponding OSS-PV also significantly outperformed the feature-vector method in this setting (p < 1.3 × 10⁻³; Mann-Whitney test). We have also tested a number of different similarity measures that use different algorithms for calculating the similarity between terms in an ontology.15–17,19,23 The results of simulations using these algorithms were inferior to those using the information content of the most informative common ancestor as defined with the use of Equations 1 and 2 (data not shown).
Discussion
Computer-based decision support programs for physicians have been in use since the 1960s, and numerous algorithms have been evaluated, including mainly naive Bayes classifiers, rule-based systems, artificial neural networks, and expert Bayesian networks.24–28 The field of medical genetics poses special challenges because of the large number of distinct syndromes and phenotypic features that need to be considered and the fact that pathognomonic signs are rare and in many cases combinations of more- or less-specific clinical features are needed for a diagnosis.29 Previous computer-based systems for medical genetics diagnostics have relied mainly on identifying lists of syndromes characterized by at least a certain number of query features, and have not provided a means of determining whether any given match is significant in a statistical sense. The procedure that we have described in this paper takes advantage of semantic similarity in an ontology to rank candidate diseases (the differential diagnosis) according to their semantic similarity with the query terms and to provide a p value that indicates whether the similarity scores of best-matching candidate diseases are significantly better than would be expected by chance. In addition, the semantic network induced by the list of differential diagnoses is exploited to indicate to the user those clinical features that if present best distinguish among the top differential diagnoses, which may either suggest to the physician sensible follow-up examinations or induce him or her to reexamine the patient for subtle phenotypic features not sought after during the initial examination.
To evaluate our diagnostic algorithm, we developed a testing scenario based on “simulated patients” presenting with clinical features of one of 44 complex dysmorphology syndromes. The features were chosen to be present or not according to the frequencies of their occurrence as reported in the genetics literature. The results of the simulation demonstrated that the ontological approaches, especially OSS-PV, performed better than diagnostic algorithms on the basis of exact matching of items in a phenotypic feature vector. The advantage was the greatest in the presence of phenotypic “noise” and “imprecision” in the description of clinical abnormalities, which we contend is typical in the clinical setting. Presumably, the superior performance of ontological algorithms reflects the advantage of exploiting the semantic structure of the HPO. There are limitations to the simulation strategy that we used for the analysis, including the fact that the occurrence of the various phenotypic abnormalities that characterize a disease is not independent. However, not enough data are available for the inclusion of correlations between phenotypic features in the simulation.
We have implemented our method as a freely available web application called the Phenomizer. The Phenomizer is not intended to be an expert system (software that attempts to reproduce the performance of a human expert) but rather a system for experts, who can use the Phenomizer to help guide the differential diagnostic process in human genetics. By providing a statistical measure of the significance of the proposed candidate diagnoses, the Phenomizer can provide some indication of whether the clinical features entered by the physician are in themselves highly suggestive of a given diagnosis or, on the other hand, whether no diagnosis in the database significantly matches the query terms. Finally, although we have implemented our methods for the domain of medical genetics, similar approaches could be used for any field of medicine for which an ontology and annotations have been developed.
Supplemental Data
Supplemental Data include one figure and 45 tables and can be found with this article online at http://www.cell.com/AJHG/.
Supplemental Data
Web Resources
The URLs for data presented herein are as follows:
The Human Phenotype Ontology (HPO), http://www.human-phenotype-ontology.org
National Center of Bioontologies (NCBO) Bioportal website, http://bioportal.bioontology.org/
Online Mendelian Inheritance in Man (OMIM), http://www.ncbi.nlm.nih.gov/omim/
The Phenomizer, http://compbio.charite.de/phenomizer
Acknowledgments
The authors would like to acknowledge the monumental work of the late Professor Victor McKusick and colleagues at OMIM, without which our own work on the HPO would have been impossible. This work was supported by the Deutsche Forschungsgemeinschaft (DFG RO 2005/4-1, SFB 760) and the Berlin-Brandenburg Center for Regenerative Therapies (BCRT) (Bundesministerium für Bildung und Forschung, project no. 0313911).
References
- 1.Curry C.J., Stevenson R.E., Aughton D., Byrne J., Carey J.C., Cassidy S., Cunniff C., Graham J.M., Jones M.C., Kaback M.M. Evaluation of mental retardation: recommendations of a consensus conference: American College of Medical Genetics. Am. J. Med. Genet. 1997;72:468–477. doi: 10.1002/(sici)1096-8628(19971112)72:4<468::aid-ajmg18>3.0.co;2-p. [DOI] [PubMed] [Google Scholar]
- 2.Battaglia A., Bianchini E., Carey J.C. Diagnostic yield of the comprehensive assessment of developmental delay/mental retardation in an institute of child neuropsychiatry. Am. J. Med. Genet. 1999;82:60–66. [PubMed] [Google Scholar]
- 3.van Karnebeek C.D.M., Jansweijer M.C.E., Leenders A.G.E., Offringa M., Hennekam R.C.M. Diagnostic investigations in individuals with mental retardation: a systematic literature review of their usefulness. Eur. J. Hum. Genet. 2005;13:6–25. doi: 10.1038/sj.ejhg.5201279. [DOI] [PubMed] [Google Scholar]
- 4.Rauch A., Hoyer J., Guth S., Zweier C., Kraus C., Becker C., Zenker M., Hüffmeier U., Thiel C., Rüschendorf F. Diagnostic yield of various genetic approaches in patients with unexplained developmental delay or mental retardation. Am. J. Med. Genet. A. 2006;140:2063–2074. doi: 10.1002/ajmg.a.31416. [DOI] [PubMed] [Google Scholar]
- 5.Srour M., Mazer B., Shevell M.I. Analysis of clinical features predicting etiologic yield in the assessment of global developmental delay. Pediatrics. 2006;118:139–145. doi: 10.1542/peds.2005-2702. [DOI] [PubMed] [Google Scholar]
- 6.Bankier A., Keith C.G. POSSUM: the microcomputer laser-videodisk syndrome information system. Ophthalmic Paediatr. Genet. 1989;10:51–52. doi: 10.3109/13816818909083773. [DOI] [PubMed] [Google Scholar]
- 7.Fryns J.-P., de Ravel T.J.L. London Dysmorphology Database, London Neurogenetics Database and Dysmorphology Photo Library on CD-ROM [Version 3] 2001 R. M. Winter, M. Baraitser, Oxford University Press. Hum. Genet. 2002;111:113. [Google Scholar]
- 8.Hamosh A., Scott A.F., Amberger J.S., Bocchini C.A., McKusick V.A. Online Mendelian Inheritance in Man (OMIM), a knowledgebase of human genes and genetic disorders. Nucleic Acids Res. 2005;33:D514–D517. doi: 10.1093/nar/gki033. [DOI] [PMC free article] [PubMed] [Google Scholar]
- 9.Aymé S. [Orphanet, an information site on rare diseases] Soins. 2003;672:46–47. [PubMed] [Google Scholar]
- 10.Robinson P.N., Köhler S., Bauer S., Seelow D., Horn D., Mundlos S. The Human Phenotype Ontology: A tool for annotating and analyzing human hereditary disease. Am. J. Hum. Genet. 2008;83:610–615. doi: 10.1016/j.ajhg.2008.09.017. [DOI] [PMC free article] [PubMed] [Google Scholar]
- 11.Ashburner M., Ball C.A., Blake J.A., Botstein D., Butler H., Cherry J.M., Davis A.P., Dolinski K., Dwight S.S., Eppig J.T. Gene Ontology: tool for the unification of biology. The Gene Ontology Consortium. Nat. Genet. 2000;25:25–29. doi: 10.1038/75556. [DOI] [PMC free article] [PubMed] [Google Scholar]
- 12.Smith B., Ashburner M., Rosse C., Bard J., Bug W., Ceusters W., Goldberg L.J., Eilbeck K., Ireland A., Mungall C.J. The OBO foundry: coordinated evolution of ontologies to support biomedical data integration. Nat. Biotechnol. 2007;25:1251–1255. doi: 10.1038/nbt1346. [DOI] [PMC free article] [PubMed] [Google Scholar]
- 13.Cover T.M., Thomas J.A. John Wiley and Sons, Inc.; 1991. Elements of information theory. [Google Scholar]
- 14.Resnik, P. (1995). Using information content to evaluate semantic similarity in a taxonomy. In Proceedings of the 14th International Joint Conference on Artificial Intelligence. 448–453.
- 15.Jiang, J.J., and Conrath, D.W. (1997). Semantic similarity based on corpus statistics and lexical taxonomy. In Proceedings of International Conference on Research in Computational Linguistics, pp. 19–33.
- 16.Lin, D. (1998). An information-theoretic definition of similarity. In ICML ‘98: Proceedings of the Fifteenth International Conference on Machine Learning. (San Francisco, CA, USA: Morgan Kaufmann Publishers Inc.), pp. 296–304.
- 17.Lord P., Stevens R.D., Brass A., Goble C.A. Investigating semantic similarity measures across the Gene Ontology: the relationship between sequence and annotation. Bioinformatics. 2003;19:1275–1283. doi: 10.1093/bioinformatics/btg153. [DOI] [PubMed] [Google Scholar]
- 18.Névéol A., Zeng K., Bodenreider O. Besides precision & recall: exploring alternative approaches to evaluating an automatic indexing tool for medline. AMIA Annual Symposium Proceedings. 2006:589–593. [PMC free article] [PubMed] [Google Scholar]
- 19.Couto F.M., Silva M.J., Coutinho P.M. Measuring semantic similarity between Gene Ontology terms. Data Knowl. Eng. 2007;61:137–152. [Google Scholar]
- 20.Yu H., Jansen R., Stolovitzky G., Gerstein M. Total ancestry measure: quantifying the similarity in tree-like classification, with genomic applications. Bioinformatics. 2007;23:2163–2173. doi: 10.1093/bioinformatics/btm291. [DOI] [PubMed] [Google Scholar]
- 21.Benjamini Y., Hochberg Y. Controlling the false discovery rate: a practical and powerful approach to multiple testing. J. Roy. Statist. Soc. Ser. B. Methodological. 1995;57:289–300. [Google Scholar]
- 22.Loeys B.L., Schwarze U., Holm T., Callewaert B.L., Thomas G.H., Pannu H., Backer J.F.D., Oswald G.L., Symoens S., Manouvrier S. Aneurysm syndromes caused by mutations in the TGF-beta receptor. N. Engl. J. Med. 2006;355:788–798. doi: 10.1056/NEJMoa055695. [DOI] [PubMed] [Google Scholar]
- 23.Mistry M., Pavlidis P. Gene Ontology term overlap as a measure of gene functional similarity. BMC Bioinformatics. 2008;9:327. doi: 10.1186/1471-2105-9-327. [DOI] [PMC free article] [PubMed] [Google Scholar]
- 24.Warner H. Iliad: moving medical decision-making into new frontiers. Methods Inf. Med. 1989;28:370–372. [PubMed] [Google Scholar]
- 25.Trace D., Evens M., Naeymi-Rad F., Carmony L. Medical information management: the MEDAS approach. Symposium on Computer Applications in Medical Care. 1990:635–639. [PMC free article] [PubMed] [Google Scholar]
- 26.Miller R., Masarie F.E., Myers J.D. Quick medical reference (QMR) for diagnostic assistance. MD comput. 1986;3:34–48. [PubMed] [Google Scholar]
- 27.Barnett G., Cimino J., Hupp J., Hoffer E. DXplain. an evolving diagnostic decision-support system. JAMA. 1987;258:67–74. doi: 10.1001/jama.258.1.67. [DOI] [PubMed] [Google Scholar]
- 28.Schurink C.A.M., Lucas P.J.F., Hoepelman I.M., Bonten M.J.M. Computer-assisted decision support for the diagnosis and treatment of infectious diseases in intensive care units. Lancet Infect. Dis. 2005;5:305–312. doi: 10.1016/S1473-3099(05)70115-8. [DOI] [PubMed] [Google Scholar]
- 29.Jones K.L., Smith D.W. Saunders WB; 2005. Smith's Recognizable Patterns of Human Malformation. [Google Scholar]
Associated Data
This section collects any data citations, data availability statements, or supplementary materials included in this article.