Abstract
We recently identified an additional isoform of human thymosin beta 15 (also known as NB-thymosin beta, gene name TMSB15A) transcribed from an independent gene, and designated TMSB15B. The purpose of this study was to investigate whether these isoforms were differentially expressed and functional. Our data show that the TMSB15A and TMSB15B isoforms have distinct expression patterns in different tumor cell lines and tissues. TMSB15A was expressed at higher levels in HCT116, DU145, LNCaP and LNCaP-LN3 cancer cells. In MCF-7, SKOV-3, HT1080 and PC-3MLN4 cells, TMSB15A and TMSB15B showed approximately equivalent levels of expression, while TMSB15B was the predominant isoform expressed in PC-3, MDA-MB-231, NCI-H322 and Caco-2 cancer cells. In normal human prostate and prostate cancer tissues, TMSB15A was the predominant isoform expressed. In contrast, normal colon and colon cancer tissue expressed predominantly TMSB15B. The two gene isoforms are also subject to different transcriptional regulation. Treatment of MCF-7 breast cancer cells with transforming growth factor beta 1 repressed TMSB15A expression but had no effect on TMSB15B. siRNA specific to the TMSB15B isoform suppressed cell migration of prostate cancer cells to epidermal growth factor, suggesting a functional role for this second isoform. In summary, our data reveal different expression patterns and regulation of a new thymosin beta 15 gene paralog. This may have important consequences in both tumor and neuronal cell motility.
INTRODUCTION
Thymosin beta 15 is a 5 kDa actin-binding protein that we discovered in highly metastatic rat prostate cancer cells. Antisense thymosin beta 15 reduced tumor cell migration (Bao et al., 1996), and we and other groups showed increased thymosin beta 15 expression in human prostate, breast and lung cancers (Bao et al., 1996; Gold et al., 1997; Chakravatri et al., 2000; Gu et al., 2008). We recently established that the human homolog of thymosin beta 15 is identical to NB thymosin beta (TMSB15A, previously known as TMSNB) (Banyard et al., 2007), a transcript found in neuroblastoma cells (Yokoyama et al., 1996). This identity was confirmed by another group (Dhaese et al., 2007). We further showed that a second thymosin beta 15 gene exists in the human genome (Banyard et al., 2007). Thymosin beta 15b (gene name TMSB15B) has 87% mRNA homology with the previously identified human thymosin beta 15a (gene name TMSB15A), and 98% identity across the coding sequence.
In this study we have analyzed the expression differences between TMSB15A and TMSB15B in various tumor cells and tissues. We also demonstrate that transforming growth factor beta 1 (TGFB1) differentially regulates the expression of the thymosin beta 15 isoforms and further show that TMSB15B produces a protein functional in motility of prostate cancer cells.
MATERIALS AND METHODS
Sequence Analysis
Sequence analysis was performed using the Ensembl Genome Browser and ClustalW2 programs at the European Bioinformatics Institute/European Molecular Biology Laboratory (EBI-EMBL), and BLAST program at the National Center for Biotechnology Information (NCBI). For human thymosin beta 15a, gene name TMSB15A, the Ensembl identifier is ENSG00000158164. For thymosin beta 15b, gene name TMSB15B, the Ensembl 52 gene identifier is AL034485.16-201, transcript identifier ENST00000372602. Sequences were aligned using the EMBOSS Pairwise alignment algorithm (EBI-EMBL).
RNA Extraction, cDNA Synthesis and PCR
RNA was purified using RNeasy Plus Mini kit (Qiagen, Valencia, CA) and transcribed using iScript cDNA synthesis kit (Biorad, Hercules, CA). RT-PCR and quantitative PCR were performed using iQ SYBR Green Supermix (Biorad) using primers TBNBF5 and TBNBR7 to amplify TMSB15A, and TBALTF4 and TBALTR6 to amplify TMSB15B (Table 1). For RT-PCR the reaction was performed on a MJ Cycler PT200 (Biorad) using a 94°C 3 min activation step, 94°C 15 sec melt step, 60°C 15 sec annealing, 72°C 30 sec extension, with 33 total cycles of amplification, followed by a 72°C 5 min final extension. Housekeeping genes ribosomal protein s9 (RPS9) and beta-2-microglobulin (B2M) (Table 1) were amplified at 58°C for 29 cycles. Products were separated on 2% agarose gels and visualized using Ethidium Bromide. Real time quantitative PCR was performed on an Opticon 2 instrument (Biorad) using cycling conditions; 95°C 3 min followed by 38 cycles of 95°C 15 sec, 60°C 15 sec, 72°C 30 sec, 78°C 1 sec plate read, followed by 72°C 5 min, melt curve from 65-98°C read every 0.2 °C, 72°C 5 min, 10°C 5 min. Data were collected using the MJ Opticon Monitor 3.1 program (Biorad) and analyzed using the ΔCt method (Pfaffl 2001). The Cancer Survey I qPCR tissue array (OriGene Technologies, Rockville, MA) was used to assess the expression of TMSB15A and TMSB15B in various tissues. TMSB15A and TMSB15B were amplified in replicate plates and cycle threshold (Ct) values compared. This was valid assuming that TMSB15A and TMSB15B amplified with equal efficiencies. To test this, TMSB15A and TMSB15B were PCR amplified, fragments gel purified using QIAquick gel extraction kit (Qiagen) and quantified using a UV spectrophotometer. A dilution series was qPCR amplified to compare reaction efficiencies. TMSB15A and TMSB15B levels were compared within each sample and no inter-sample analysis was performed, therefore a housekeeping gene value for normalization was not necessary, and an arbitrary housekeeping gene value was assigned to calculate fold difference using the ΔCt method (Pfaffl, 2001).
Table 1.
Primer and siRNA Sequences
| PCRTarget | Name | Sequence 5’-3’ |
|---|---|---|
| TMSB15A | TBNBF5 | GGTCTCAGCCCCGCGAACAG |
| TBNBR7 | CAGGTAATGTCGAAATCTGCTGTTG | |
| TMSB15B | TBALTF4 | GGGTCTCAGCCCCGCGTACG |
| TBALTR6 | CAGGCAATGCTGAAATCTGCTCTTG | |
| B2M | B2Mfwd | CAATCCAAATGCGGCATCTTCAAAC |
| B2Mrev | GAATGGAGAGAGAATTGAAAAAGTGGAGCA | |
| RPS9 | RIBS9fwd | GATGAGAAGGACCCACGGCGTCTGTTCG |
| RIBS9rev | GAGACAATCCAGCAGCCCAGGAGGGACA | |
| siRNA Target | Name | Sense Sequence |
| TMSB15A | TMSB15A #9 | UUUUAGGCGUCUUCGGAUAUU |
| TMSB15A #10 | CAACAGCAGAUUUCGACAUUU | |
| TMSB15B | TMSB15B #2 | GUGCCUCAAUAGUUUCAUAUU |
| TMSB15B #3 | GGUCAGGGGUAGUGAAUGUUU | |
| TMSB15B #4 | GUAAAUUCCAAAUGGCAGAUU |
Cell Culture, siRNA Transfection and Cell Migration
LNCaP, SKOV-3, Caco-2, PC-3, HT1080, HCT116, MCF-7, HeLa, HT-29 and DU145 were obtained from American Type Culture Collection (Manassas, VA) and grown according to supplier instructions. LNCaPLN3, PC-3MLN4 and NCI-H322 cells were grown in RPMI supplemented with 10% fetal bovine serum (FBS) and 1% glutamine-penicillin-streptomycin (GPS) (Invitrogen). MDA-MD-231 and HaCaT cells were grown in DMEM supplemented with 10% FBS and 1% GPS (Invitrogen, Carlsbad, CA). Control and TMSB15A and TMSB15B siRNAs were purchased from Thermo Scientific Dharmacon (Lafayette, CO). Cell transfection with siRNAs was performed using Silentfect (Biorad) and cells collected for RNA or migration assays after 48 hr incubation. Cell migration was performed as previously described (Banyard and Symons, 2002) using a 48 well modified Boyden chamber (Neuro Probe, Gaithersburg, MD). PC-3 cells were plated on 100 μg/ml collagen I coated 8 μm pore membranes and migration quantified after 4 hr incubation. Recombinant human transforming growth factor beta 1 (TGFB1) (R&D systems, Minneapolis, MN) was resuspended at 10 μg/ml in 4 mM HCl with 0.1% bovine serum albumin carrier. For TGFB1 treatment 2×10⁵ MCF-7 cells were plated per 35 mm dish and incubated overnight. Cells were washed twice and media replaced with low serum media (DMEM + 0.5% FBS +1% GPS) for 24 hr. Cells were then treated with 10 ng/ml TGFB1 or resuspension solution for 24 hr and RNA collected as described above.
Statistical Analysis
Migration assay and qPCR data were analyzed using the two-sample Student’s t test. Two-tailed values of P < 0.05 were considered statistically significant for all analyses.
RESULTS
Expression of Thymosin Beta 15 Isoforms in Tumor Cells and Tissues
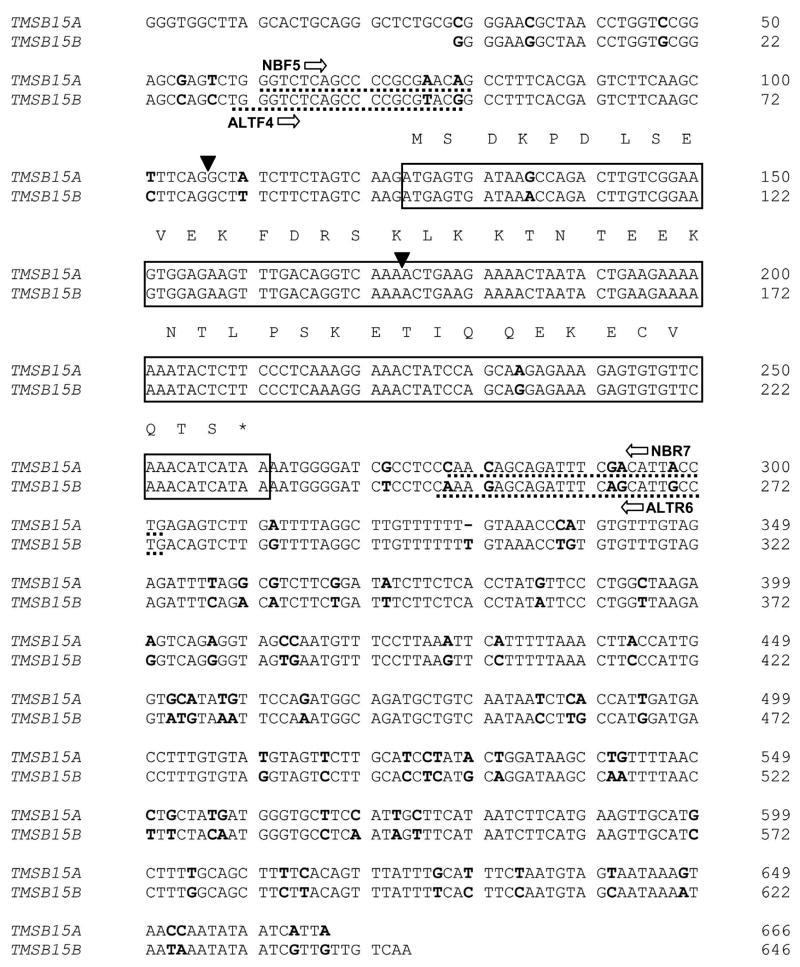
We have identified two independent thymosin beta 15 genes in the human genome, both located on chromosome X. TMSB15A is located on the reverse strand at Xq22.1, while the newly identified TMSB15B gene paralog is located on the forward strand at Xq22.2 (Banyard et al., 2007). At the cDNA level, TMSB15A and TMSB15B show 87% identity, with 98% sequence conservation across the coding region. The mRNA alignment of the two human thymosin beta 15 isoforms is shown in Figure 1. The coding region is boxed, with amino acid sequence above and differences in the nucleotide sequences bolded. The two variant nucleotides in the coding sequence are silent, resulting in translation of identical proteins from the TMSB15A and TMSB15B isoforms. Further genomic analysis revealed an additional copy of the thymosin beta 15 coding sequence on chromosome 6 (Vega Gene RP11-505P4.5, Ensembl Locus ID OTTHUMG00000015035). This latter sequence shows the classical characteristics of a retrotranposed pseudogene; it lacks the intronic sequence and has frameshift mutations, stop codons and codon deletions which would prevent translation of thymosin beta 15 protein. Alignment of this sequence with TMSB15A and TMSB15B is shown in Supplementary Figure 1. The two variant nucleotides in the thymosin beta 15 coding sequence are conserved between TMSB15B and the pseudogene. This indicates that the pseudogene originated as a copy of the TMSB15B coding sequence.
Figure 1.
Alignment of TMSB15A and TMSB15B isoform mRNAs. The coding sequence is boxed, with the amino acid sequence shown above. Nucleotide sequence differences are indicated in bold and exon splice sites are marked with arrowheads. Primer locations are underlined.
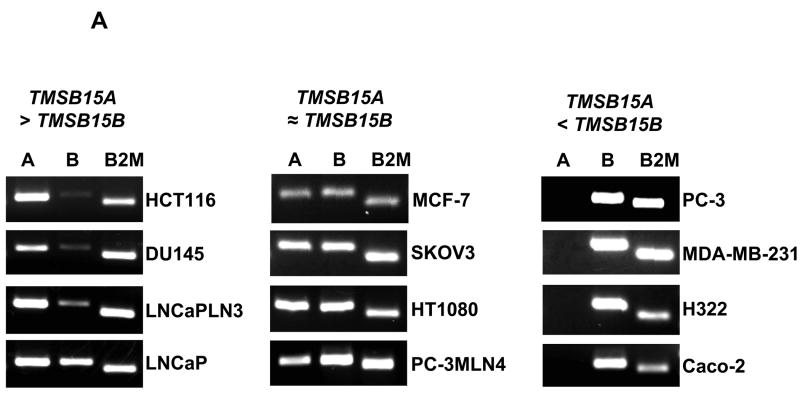
In contrast to the coding sequence, numerous nucleotide differences exist in both the 3’ and 5’ untranslated regions of TMSB15A and TMSB15B. This allowed us to design isoform-specific PCR amplification primer sets (Table 1) to examine expression patterns. RT-PCR demonstrated that both TMSB15A and TMSB15B genes were transcribed and the amplicons were sequenced to confirm primer specificity. We found that different thymosin beta 15 isoform expression patterns existed in various human tumor cell lines. Our data show that in HCT116 colorectal carcinoma and DU145, LNCaP-LN3 and LNCaP prostate carcinoma cells, TMSB15A was expressed at higher levels than TMSB15B (Fig. 2A, left panel). In MCF-7 breast carcinoma, SKOV-3 ovarian carcinoma, HT1080 fibrosarcoma cells and PC-3MLN4 prostate carcinoma, TMSB15A and TMSB15B showed approximately equivalent levels of expression (Fig. 2A, center panel). In contrast, PC-3 prostate carcinoma, MDA-MB-231 breast carcinoma, NCI-H322 lung carcinoma and Caco-2 colorectal carcinoma cells showed significantly greater TMSB15B expression compared to TMSB15A (Fig. 2A, right panel). No expression of either thymosin beta 15 isoform was detected in several cell lines, including HaCaT keratinocytes, HeLa cervical carcinoma, HT-29 colorectal adenocarcinoma and NIH:OVCAR5 ovarian carcinoma, under these conditions (data not shown). Our data indicate that TMSB15B is expressed in multiple tumor cell types and is the predominant isoform in many cells.
Figure 2.
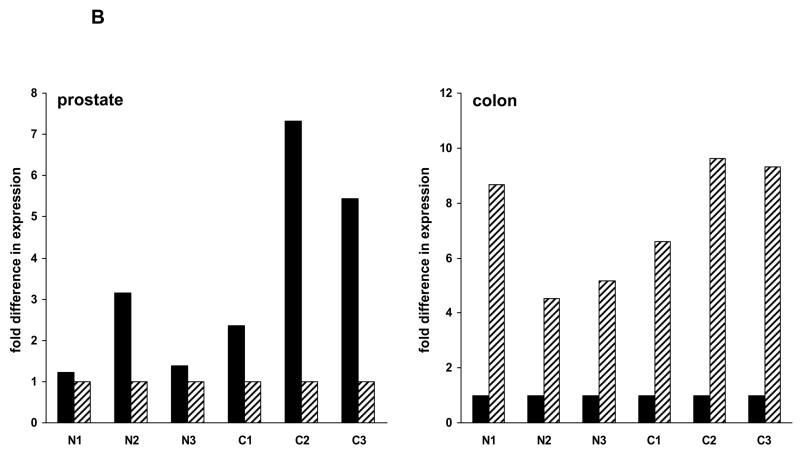
TMSB15A and TMSB15B are expressed at different levels in different human tumor cells and normal tissues. (A) Specific primers were used to amplify TMSB15A or TMSB15B in various tumor cells. HCT116, DU145, LNCaP-LN3 and LNCaP cells expressed more TMSB15A (labeled A) than TMSB15B (labeled B) (left panel). MCF-7, SKOV-3, HT1080 and PC-3MLN4 cells expressed approximately equivalent levels of each (center panel), while PC-3, MDA-MB-231, NCI-H322 and Caco-2 cells expressed more TMSB15B than TMSB15A (right panel). B2M amplified as control. (B) Left panel; quantitative PCR analysis of TMSB15A (solid bars) and TMSB15B (striped bars) in prostate showed TMSB15A was the main isoform expressed in either normal (N) or cancer (C) tissue. Data shown as fold expression relative to TMSB15B C(t) value for each prostate tissue sample. Right panel; quantitative PCR analysis in colon showed TMSB15B was the major isoform expressed in either normal or tumor tissue. Data shown as fold expression relative to TMSB15A C(t) value for each colon tissue sample.
We next examined expression in various normal and tumor tissues to determine whether TMSB15A and TMSB15B exhibit any tissue specificity. Replicate 96 well plates of human tissue cDNAs were amplified using quantitative PCR. TMSB15A and TMSB15B PCR amplicons were of equal length, GC content, and amplified with equal efficiencies (Supplementary Fig. 2) allowing comparison of expression levels. Relative expression of TMSB15A and TMSB15B were compared using the ΔCt method (Pfaffl, 2001) using a constant housekeeping gene value for normalization, as described in Material and Methods. Data indicated that certain tissues, such as prostate, express predominantly TMSB15A, both in normal and tumor tissues (Fig. 2B, left panel). In contrast, normal colon tissue and colon cancer expressed predominantly TMSB15B (Fig. 2B, right panel).
TGFB1 Regulation of Thymosin Beta 15 Isoform Expression
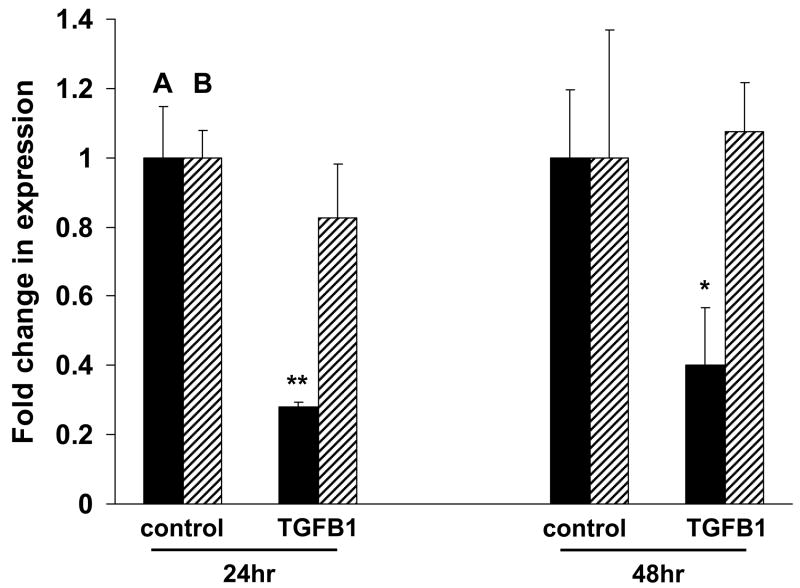
Thymosin beta 15 affects cell colony growth, transformation and cell migration (Bao et al., 1996; Abdulrahman et al., 2007; Dhaese et al., 2007) and a key regulator of cell growth in the tumor microenvironment is transforming growth factor beta 1 (TGFB1). We therefore examined thymosin beta 15 expression in response to TGFB1 treatment. MCF-7 breast cancer cells, which express both TMSB15A and TMSB15B (Fig. 2A), were grown in reduced-serum medium overnight, then treated with TGFB1 for 24 or 48 hours. Thymosin beta 15 isoform RNA levels were determined using quantitative PCR. TGFB1 treatment significantly repressed TMSB15A expression in MCF-7 cells, whereas TMSB15B level was unaffected (Fig. 3). This was not generalized to all breast cancer cells, however, as TGFB1 did not repress TMSB15A expression in T-47D or ZR-75-1 breast cancer cells (data not shown).
Figure 3.
TMSB15A and TMSB15B RNA expression are differentially regulated by TGFB1. MCF-7 breast cancer cells were treated with 10 ng/ml TGFB1 or control conditions for 24 or 48 hrs. qPCR was used to assess RNA expression of TMSB15A and TMSB15B. TMSB15A levels (black bars, marked ‘A’) were significantly inhibited by TGFB1, while no effect was observed on TMSB15B (striped bars, marked ‘B’), * P < 0.05, ** P < 0.01. Fold change relative to RPS9 housekeeping gene expression and error bars indicate standard deviation of replicate samples.
TMSB15B Functions in Cell Migration
As both thymosin beta 15a and thymosin beta 15b have identical amino acid sequences, protein expression could not be distinguished using thymosin beta 15 antibodies. Detection of endogenous thymosin beta 15 protein by Western blot has also proved technically difficult due to its small size of 5 kDa. Rat thymosin beta 15 is required for tumor cell migration (Bao et al., 1996), and increases branching in developing rat neurons (Choe et al., 2005). The human TMSB15A isoform has previously been established as a functional protein. TMSB15A expression increases mouse fibroblast migration (Dhaese et al., 2007), increases human tumor cell colony formation and anchorage-independent growth, and is required for colony formation (Abdulrahman et al., 2007). To determine whether TMSB15B protein is expressed and functional, we used RNA interference followed by a cell migration assay.
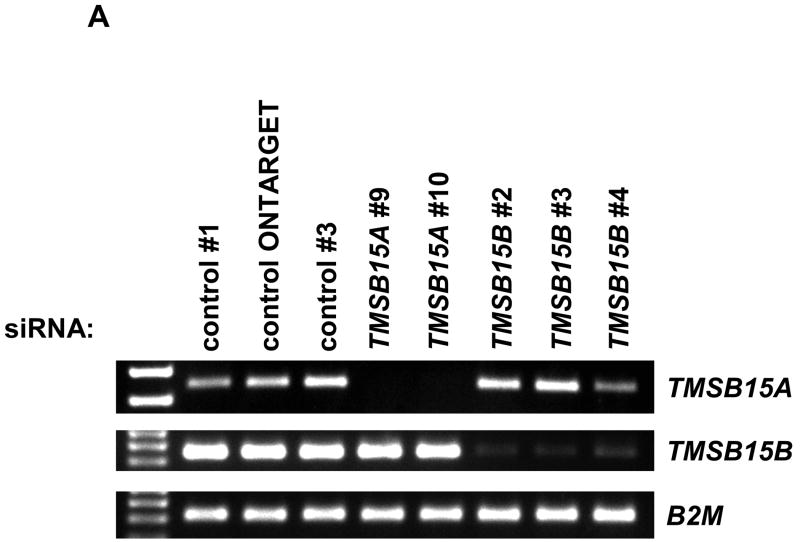
The activity of siRNA oligonucleotides was first determined in PC-3MLN4 cells, which expressed both TMSB15A and TMSB15B. Cells were transfected with 20 nM siRNAs targeting TMSB15A (siRNA TMSB15A #9 or siRNA TMSB15A #10), TMSB15B (siRNA TMSB15B #2, siRNA TMSB15B #3 or siRNA TMSB15B #4) or non-binding siRNA controls (control siRNA#1, control-ONTARGET siRNA or control siRNA#3). Isoform expression was analyzed using RT-PCR. Multiple siRNAs were used against each target to ensure specificity. Figure 4A shows effective and specific knockdown of TMSB15A and TMSB15B isoforms at the RNA level.
Figure 4.
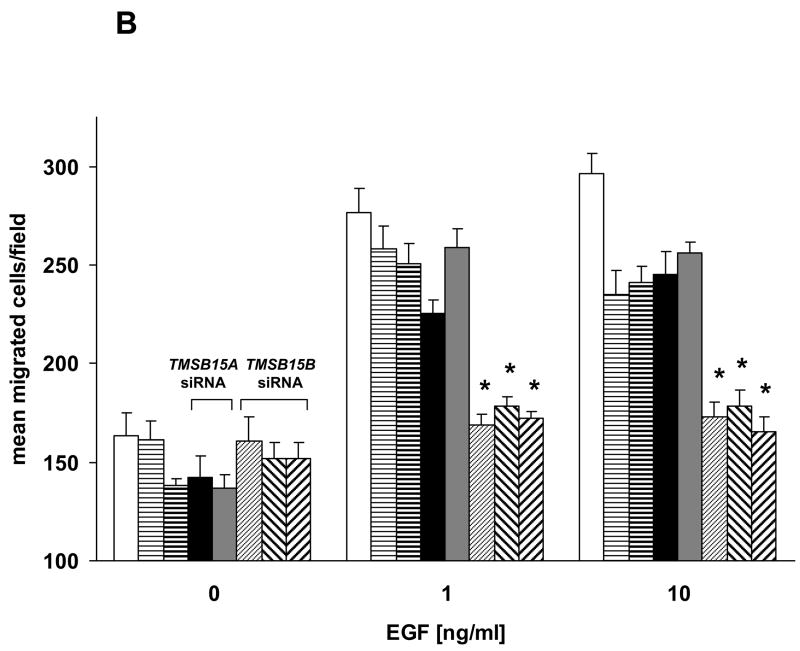
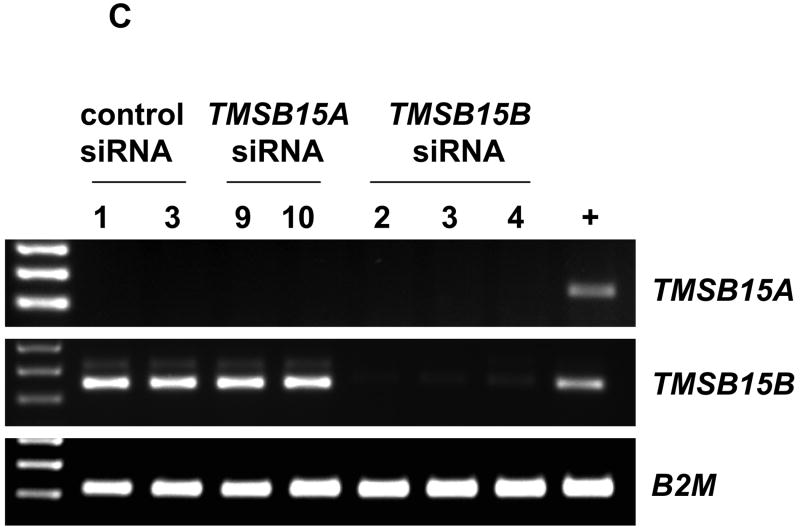
RNA interference demonstrates function of TMSB15B in cell migration to EGF. (A) PC-3MLN4 cells were treated with 3 individual control siRNAs, 2 TMSB15A siRNAs (#9 and #10) or 3 TMSB15B siRNAs (#2, #3 and #4). RT-PCR analysis using primers to TMSB15A (top panel), TMSB15B (center panel), or B2M housekeeping gene (lower panel) demonstrated isoform specificity of siRNA duplexes. (B) siRNA inhibition of TMSB15B significantly reduced PC-3 cell migration to EGF in the modified Boyden chamber assay. Data shown as mean migrated cells/low power field with error bars indicating standard error of the mean. Empty bar; untransfected cells, Horizontal striped bars; control siRNAs (thin stripe control siRNA#1, thick stripe control siRNA#3), Solid bars; TMSB15A siRNAs (solid black; TMSB15A siRNA#9, solid grey; TMSB15A siRNA#9), Striped bars; TMSB15B siRNAs (thin upward stripe; TMSB15B siRNA#2, thick downward stripe; TMSB15B siRNA#3, thick upward stripe; TMSB15B siRNA#4). * P < 0.01. (C) Parallel transfections were performed in PC-3 cells for RNA collection. RT-PCR showed decreased TMSB15B expression in all TMSB15B siRNA-treated cells. PC-3MLN4 was used as a positive control for PCR reactions (+). B2M; beta-2-microglobulin.
The role of TMSB15B in cell motility was then determined by siRNA knockdown in PC-3 cells, which expressed only TMSB15B (Fig. 2A). Untreated or control siRNA-transfected PC-3 cells showed directional migration in response to epidermal growth factor (EGF) in the 48-well modified Boyden chamber assay. Three individual TMSB15B siRNAs significantly decreased cell migration in response to EGF, P < 0.001 (Fig. 4B). TMSB15A siRNAs had no effect on PC-3 cell migration, as expected, due to their lack of TMSB15A expression. RT-PCR confirmed knockdown of TMSB15B, and absence of TMSB15A in PC-3 cells transfected in parallel (Fig. 4C). Our data provide important evidence that TMSB15B produces a functional protein in prostate cancer cell motility.
DISCUSSION
In this report we show that the newly discovered gene paralog of thymosin beta 15, TMSB15B (Banyard et al., 2007) shows a different expression pattern in tumor cells and in normal and tumor tissues, compared to TMSB15A. We show that TMSB15B is a functional protein in tumor cell motility and is subject to differential gene regulation; TGFB1 suppressed TMSB15A expression in MCF-7 breast cancer cells, but did not affect TMSB15B. TMSB15A and TMSB15B genes only have two silent changes in their coding regions and thus produce identical proteins. The occurrence of a second coding copy of the thymosin beta 15 gene in the human genome is unexpected and intriguing although there are numerous mechanisms and functions of gene duplication (Conant and Wolfe, 2008). Two potential advantages to retaining an additional thymosin beta 15 gene are suggested by the current data.
Firstly, gene subfunctionalization at the regulatory level may be responsible for our observations that TGFB1 repressed TMSB15A and not TMSB15B in MCF-7 cells and the observed tissue specificity of thymosin beta 15 isoform expression. This could be mediated through transcription factor, methylation or microRNA binding site sequence differences in the cis regulatory regions of the TMSB15A and TMSB15B genes. There is considerable sequence variation between the putative promoter regions of the thymosin beta 15 isoforms. The conserved putative core promoter regions have 76% identity between TMSB15A and TMSB15B within 250 bp upstream of the transcriptional start sites, but only 59% identity when aligned across the 500 bp upstream sequence. We have previously shown promoter activity within a region 500 bp upstream of the transcriptional start site of the rat thymosin beta 15 promoter (Bao and Zetter, 2000). Similarly, other regions of the TMSB15A and TMSB15B genes show sequence variability; there is 72% identity between the two introns 1, 76% identity between the two introns 2, and 82% identity between the two 3’ untranslated regions (UTR) of the thymosin beta 15 isoforms (Sequence alignments shown in Supplementary Fig. 3). The UTR sequence variations are of particular interest, as these regions are often targeted for epigenetic regulation by microRNAs. Subfunctionalization has often been reported in developmental genes, and it may be notable that thymosin beta 15 has been shown to affect the branching of developing neurons in the brain (Choe et al., 2005).
An alternative model favoring the retention of duplicate genes is an advantage of gene dosage. Increasing thymosin beta 15 level may confer advantage to tumor cells by increasing motility, transformation and colony formation (Bao et al., 1996; Abdulrahman et al., 2007; Dhaese et al., 2007). We note that several human cancer cell lines expressed both TMSB15A and TMSB15B isoforms.
As we have shown, thymosin beta 15 level may also be influenced by the microenvironment, with TGFB1 regulating expression. This may be responsible for the thymosin beta 15 isoform expression differences in various cells and tissues. However, we may find that other signals also contribute to differentially regulate thymosin beta 15 isoform expression. Not all cells examined showed TMSB15A repression following TGFB1 treatment. TGFB1 inhibition of cell proliferation is lost or reduced in many tumor cells, including T-47D and ZR-75-1 (Wilson et al., 2005; Stoika et al., 2008) in which TMSB15A was not significantly affected, and in other cells that express both thymosin beta 15 isoforms, such as SKOV-3 (Dunfield et al., 2002). MCF-7 cells remain highly sensitive to TGFB1 (Mazars et al., 1995) and are widely used in breast cancer research as a model of estrogen receptor positive cancer. Whether TGFB1 responsiveness is the parental gene state or an evolved gain of function is currently unclear.
The importance of understanding thymosin beta 15 isoform RNA expression has become more critical as gene associations in cancer and various other diseases are made using gene microarray analysis. For example, recent reports have shown that TMSB15A is amplified in cervical cancer (Narayan et al., 2007), is associated with von Hippel-Lindau disease mutations in renal cell carcinoma (Abdulrahman et al., 2007), and shown to be a tumor protein p53-response gene (Kannan et al., 2001; Bertheau et al., 2007). TMSB15A RNA level was also reflective of chemotherapeutic drug response in breast cancer (Bertheau et al., 2007). Considering the fact that thymosin beta 15 protein can be detected in human urine using an enzyme-linked immunosorbent assay (ELISA) (Hutchinson et al., 2005), it may be a clinically useful biomarker of drug response.
In summary, our data reveal a functional role for the newly identified TMSB15B gene paralog, and show that the expression of this gene is under different regulatory controls compared to TMSB15A. This may have important consequences in light of the tumor cell and tissue expression differences, as regulatory signals will vary in different tumor microenvironments.
Supplementary Material
Acknowledgments
We thank Dr. Isaiah Fidler (MD Anderson Cancer Center, TX) for LNCaPLN3 and PC-MLN4 cells, Dr. Diane Bielenberg (Children’s Hospital Boston) for HaCaT cells, Dr. Irit Adini (Children’s Hospital Boston) for MDA-MD-231 cells and Dr. Lewis Cantley (Beth Israel Deaconess Medical Center, Boston) for NCI-H322 cells. We thank Melissa Herman for administrative assistance.
Supported by NIH grant CA-37393 to Bruce R. Zetter.
References
- Abdulrahman M, Maina EN, Morris MR, Zatyka M, Raval RR, Banks RE, Wiesener MS, Richards FM, Johnson CM, Latif F, Maher ER. Identification of novel VHL targets that are associated with the development of renal cell carcinoma. Oncogene. 2007;26:1661–1672. doi: 10.1038/sj.onc.1209932. [DOI] [PubMed] [Google Scholar]
- Banyard J, Hutchinson LM, Zetter BR. Thymosin beta-NB is the human isoform of rat thymosin beta15. Ann N Y Acad Sci. 2007;1112:286–296. doi: 10.1196/annals.1415.024. [DOI] [PubMed] [Google Scholar]
- Banyard J, Symons M. Cell motility and invasion assays. Methods Mol Biol. 2002;189:129–140. doi: 10.1385/1-59259-281-3:129. [DOI] [PubMed] [Google Scholar]
- Bao L, Loda M, Janmey PA, Stewart R, Anand-Apte B, Zetter BR. Thymosin beta 15: a novel regulator of tumor cell motility upregulated in metastatic prostate cancer. Nat Med. 1996;2:1322–1328. doi: 10.1038/nm1296-1322. [DOI] [PubMed] [Google Scholar]
- Bao L, Zetter BR. Molecular cloning and structural characterization of the rat thymosin beta15 gene. Gene. 2000;260:37–44. doi: 10.1016/s0378-1119(00)00452-2. [DOI] [PubMed] [Google Scholar]
- Bertheau P, Turpin E, Rickman DS, Espie M, de Reynies A, Feugeas JP, Plassa LF, Soliman H, Varna M, de Roquancourt A, Lehmann-Che J, Beuzard Y, Marty M, Misset JL, Janin A, de The H. Exquisite sensitivity of TP53 mutant and basal breast cancers to a dose-dense epirubicin-cyclophosphamide regimen. PLoS Med. 2007;4:e90. doi: 10.1371/journal.pmed.0040090. [DOI] [PMC free article] [PubMed] [Google Scholar]
- Chakravatri A, Zehr EM, Zietman AL, Shipley WU, Goggins WB, Finkelstein DM, Young RH, Chang EL, Wu CL. Thymosin beta-15 predicts for distant failure in patients with clinically localized prostate cancer-results from a pilot study. Urology. 2000;55:635–638. doi: 10.1016/s0090-4295(00)00462-3. [DOI] [PubMed] [Google Scholar]
- Choe J, Sun W, Yoon SY, Rhyu IJ, Kim EH, Kim H. Effect of thymosin beta15 on the branching of developing neurons. Biochem Biophys Res Commun. 2005;331:43–49. doi: 10.1016/j.bbrc.2005.03.130. [DOI] [PubMed] [Google Scholar]
- Conant GC, Wolfe KH. Turning a hobby into a job: how duplicated genes find new functions. Nat Rev Genet. 2008;9:938–950. doi: 10.1038/nrg2482. [DOI] [PubMed] [Google Scholar]
- Dhaese S, Jonckheere V, Goethals M, Waltregny D, Vandekerckhove J, Ampe C, Van Troys M. Functional and profiling studies prove that prostate cancer upregulated neuroblastoma thymosin beta is the true human homologue of rat thymosin beta15. FEBS Lett. 2007;581:4809–4815. doi: 10.1016/j.febslet.2007.09.003. [DOI] [PubMed] [Google Scholar]
- Dunfield LD, Dwyer EJ, Nachtigal MW. TGF beta-induced Smad signaling remains intact in primary human ovarian cancer cells. Endocrinology. 2002;143:1174–1181. doi: 10.1210/endo.143.4.8733. [DOI] [PubMed] [Google Scholar]
- Gold JS, Bao L, Ghoussoub RA, Zetter BR, Rimm DL. Localization and quantitation of expression of the cell motility-related protein thymosin beta15 in human breast tissue. Mod Pathol. 1997;10:1106–1112. [PubMed] [Google Scholar]
- Gu YM, Li SY, Qiu XS, Wang EH. Elevated thymosin beta15 expression is associated with progression and metastasis of non-small cell lung cancer. Apmis. 2008;116:484–490. doi: 10.1111/j.1600-0463.2008.00918.x. [DOI] [PubMed] [Google Scholar]
- Hutchinson LM, Chang EL, Becker CM, Ushiyama N, Behonick D, Shih MC, DeWolf WC, Gaston SM, Zetter BR. Development of a sensitive and specific enzyme-linked immunosorbent assay for thymosin beta15, a urinary biomarker of human prostate cancer. Clin Biochem. 2005;38:558–571. doi: 10.1016/j.clinbiochem.2005.01.015. [DOI] [PubMed] [Google Scholar]
- Kannan K, Amariglio N, Rechavi G, Jakob-Hirsch J, Kela I, Kaminski N, Getz G, Domany E, Givol D. DNA microarrays identification of primary and secondary target genes regulated by p53. Oncogene. 2001;20:2225–2234. doi: 10.1038/sj.onc.1204319. [DOI] [PubMed] [Google Scholar]
- Mazars P, Barboule N, Baldin V, Vidal S, Ducommun B, Valette A. Effects of TGF-beta 1 (transforming growth factor-beta 1) on the cell cycle regulation of human breast adenocarcinoma (MCF-7) cells. FEBS Lett. 1995;362:295–300. doi: 10.1016/0014-5793(95)00247-7. [DOI] [PubMed] [Google Scholar]
- Narayan G, Bourdon V, Chaganti S, Arias-Pulido H, Nandula SV, Rao PH, Gissmann L, Durst M, Schneider A, Pothuri B, Mansukhani M, Basso K, Chaganti RS, Murty VV. Gene dosage alterations revealed by cDNA microarray analysis in cervical cancer: identification of candidate amplified and overexpressed genes. Genes Chromosomes Cancer. 2007;46:373–384. doi: 10.1002/gcc.20418. [DOI] [PubMed] [Google Scholar]
- Pfaffl MW. A new mathematical model for relative quantification in real-time RT-PCR. Nucleic Acids Res. 2001;29:e45. doi: 10.1093/nar/29.9.e45. [DOI] [PMC free article] [PubMed] [Google Scholar]
- Stoika RS, Yakymovych IA, Kashchak NI, Boyko MM, Korynevska AV, Klyuchyvska OY, Shafranska GI, Yakymovych MY, Zhylchuk VY, Kudryavets YY, et al. Effect of anticancer drugs on production of transforming growth factor and expression of p53 AND Bcl-2 proteins by MCF-7 and T47D cell lines of human breast carcinoma. Exp Oncol. 2008;30:35–41. [PubMed] [Google Scholar]
- Wilson CA, Cajulis EE, Green JL, Olsen TM, Chung YA, Damore MA, Dering J, Calzone FJ, Slamon DJ. HER-2 overexpression differentially alters transforming growth factor-beta responses in luminal versus mesenchymal human breast cancer cells. Breast Cancer Res. 2005;7:R1058–1079. doi: 10.1186/bcr1343. [DOI] [PMC free article] [PubMed] [Google Scholar]
- Yokoyama M, Nishi Y, Yoshii J, Okubo K, Matsubara K. Identification and cloning of neuroblastoma-specific and nerve tissue-specific genes through compiled expression profiles. DNA Res. 1996;3:311–320. doi: 10.1093/dnares/3.5.311. [DOI] [PubMed] [Google Scholar]
Associated Data
This section collects any data citations, data availability statements, or supplementary materials included in this article.


