

Abstract
Mouse models have dramatically improved our understanding of cancer development and tumor biology. However, these models have shown limited efficacy as tractable systems for unbiased genetic experimentation. Here, we report the adaptation of loss of function screening to mouse models of cancer. Specifically, we have been able to introduce a library of shRNAs into individual mice using transplantable Eμ-myc lymphoma cells. This approach has allowed us to screen nearly 1000 genetic alterations in the context of a single tumor-bearing mouse. Results from these experiments have identified a central role for regulators of actin dynamics and cell motility in lymphoma cell homeostasis in vivo, and validation experiments confirmed that these proteins represent bona fide lymphoma drug targets. Additionally, suppression of two of these targets, Rac2 and Twinfilin, potentiated the action of the front-line chemotherapeutic vincristine, suggesting a critical relationship between cell motility and tumor relapse in hematopoietic malignancies.
Genetic screens in the mouse hematopoietic system have proven to be highly effective strategies for identifying novel and cooperating cancer genes. For example, Moloney-based retroviral insertional mutagenesis screens first characterized the potent oncogenes bmi-1 and pims 1-31,2. Subsequently, these screens have been performed on numerous sensitized backgrounds, revealing significant insight into the relationship between specific oncogenic and tumor suppressor alterations3. The more recent development of mice expressing active transposons has similarly facilitated the identification of novel cancer genes 4-6. While these approaches have been highly successful, they have several notable limitations. First, genes affected by insertional mutagenesis are identified as likely candidates based on proximity to the insertion site. Thus, numerous mice are required to identify “common insertion sites”, and affected genes need to be functionally validated. Second, despite the use of highly recombinant genetic backgrounds, the identification of relevant tumor suppressor genes by insertional mutagenesis is inefficient. Finally, insertional mutagenesis requires positive selection for a given phenotype, generally tumor development. Thus, sensitization screens based on the selective depletion of a given insertion site cannot be performed.
We have recently adapted miRNA-based shRNA gene silencing to in vivo applications in the Eμ-myc lymphoma mouse, a well-established model of B cell lymphoma7-9. This approach has subsequently been expanded to examine small sets of shRNAs in a cohort of mice10. However, despite the disseminated and effective use of cell-based RNAi screens11-17, adaptation of these approaches to mouse models has been limited. Here, we use RNAi to interrogate loss of function phenotypes for large gene sets in the context of individual mice. Results from this study identify a set of genes involved in cytoskeletal organization and cell migration that are important for lymphoma progression in vivo. Importantly, this study demarcates critical determinants of tumor behavior in vivo, information that could not be obtained using conventional cell-based screening approaches.
Previous studies in the Eμ-myc system have suggested that Eμ-myc lymphomas are largely composed of cells with tumor initiating potential. Specifically, tumor cell dilution experiments have shown that as few as 10 tumor cells can produce tumors following tail vein injection into syngeneic recipient mice 18. Thus, we reasoned that if nearly all tumor cells have the capacity to contribute to tumor formation following transplantation, then this system might accommodate the introduction of a diverse set of shRNA-infected cells into a given tumor. To test this, we performed a dilution experiment using lymphoma cell cultures that were partially transduced with a retroviral vector co-expressing an shRNA targeting Topoisomerase 2α (Top2A), an essential mediator of the cytotoxic effects of the chemotherapeutic doxorubicin 19, and the gene encoding Green Fluorescent Protein (GFP) to mark infected cells. Viral multiplicity of infection (MOI) was titered, such that either 2.0% or 0.2% of lymphoma cells were infected. These partially transduced lymphoma cell populations were injected into syngeneic recipient mice, and mice were treated with doxorubicin at the time of lymphoma presentation. At both infection efficiencies, we saw a significant increase in the percentage of GFP-positive cells following treatment (Fig. 1a). These results showed that cells representing as little as 1/500th of the injected lymphoma cell population were retained at the time of doxorubicin treatment. These data are consistent with large numbers of lymphoma cells (at least 500) contributing to an individual tumor following transplantation in vivo, and suggest the Eμ-myc lymphoma model may be appropriate for in vivo, pool-based RNAi screens with complex shRNA libraries.
Figure 1. In vivo RNAi screening strategy.
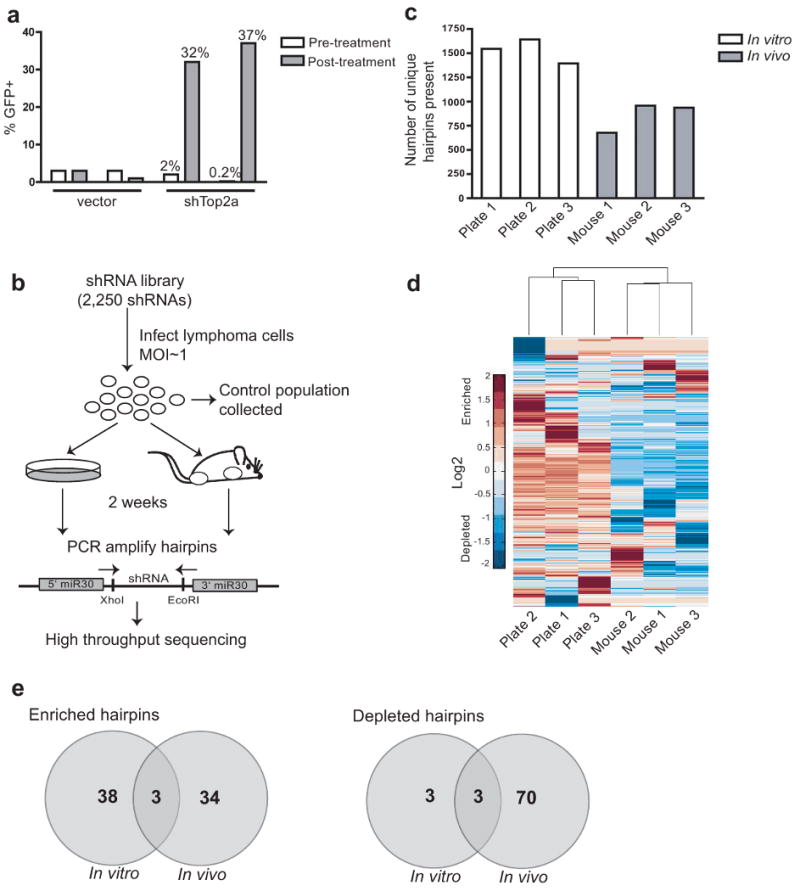
(A) A diverse population of lymphoma cells is retained in tumors at the time of disease presentation. Cells were infected with a vector control or a retrovirus co-expressing GFP and an shRNA targeting Top2A. Partially transduced cell populations were injected into recipient mice. Palpable tumors were treated with doxorubicin, and the percentage of GFP positive lymphoma cells was assayed at tumor relapse. (B) In vivo RNAi screening strategy. Lymphoma cells were infected with a pool of retroviruses containing 2250 distinct hairpins, and transduced lymphoma cell populations were injected into three recipient mice or passaged in three separate culture dishes. Lymphomas were harvested from tumor-bearing mice and shRNAs were PCR amplified from genomic DNA derived from tumors or from cultured cells. (C) The number of unique hairpins present in each sample after two weeks proliferation. (D) Clustering of samples based on shRNA enrichment or depletion. Color scale represents the mean normalized log2 of the fold change in shRNA read number relative to input cells. (E) Hairpins that scored as enriched or depleted in vivo are largely distinct those that enriched or depleted in vitro. Diagrams show the number of scoring genes in the in vivo and in vitro settings.
Based on these preliminary results, we performed an shRNA screen with a pool of approximately 2250 hairpins targeting 1000 genes with known or putative roles in cancer19. Retroviral plasmids expressing these shRNAs, as well as GFP, were pooled and packaged as a mixture of retroviruses. This retroviral pool was then used to infect lymphoma cells, and the resulting transduced cells were injected into recipient mice, maintained in culture, or collected immediately to serve as a reference sample (Fig. 1b). At the time of lymphoma presentation, tumors were harvested and genomic DNA was extracted from primary tumors and cultured cells. Following PCR amplification of shRNAs from genomic DNA using common primers (Fig. 1b), hairpin representation was analyzed by high throughput sequencing.
Approximately 1600 of the original 2250 unique hairpins could be identified from each in vitro cultured sample, and, surprisingly, between 600 and 900 unique hairpins could be identified in lymphomas from individual mice (Fig. 1c). Thus, a large, diverse shRNA set can be introduced in vivo and a significant proportion of the initial library complexity can be maintained in this setting. Sequencing of shRNAs from genomic DNA derived from outgrown single cell clones showed that approximately 90% of cells were infected with only a single shRNA (Supplementary Fig. 1), suggesting that, at a minimum, 900 cells can contribute to the lymphoma burden in an individual mouse. Thus, not only can a large percentage of lymphoma cells give rise to a tumor following transplantation, but, in fact, many of these cells contribute to the growth of the resulting tumor.
Unsupervised hierarchical clustering showed that the three in vivo samples were more similar to one another than to any of the cultured in vitro samples, based on the hairpins that enriched or depleted in each setting (Fig. 1d). Thus, the set of genes that impacts cancer cell homeostasis in vitro is distinct from those that are central to tumor growth in vivo. Importantly, the number of sequencing reads obtained was sufficient to see both enrichment and depletion of shRNAs from the initial injected population. While many shRNAs displayed similar changes in representation in clustered samples, significant variation was also present in samples of the same type. This is likely due to the stochastic gain or loss of shRNAs following introduction into mice or serial replating in culture.
Hairpins whose representation decreased at least 10-fold in all three replicates or enriched at least 5-fold in two out of three replicates, relative to their representation in the control cell population collected shortly after retroviral transduction, scored as candidate hits. The set of scoring shRNAs in vitro by this criteria was largely non-overlapping with the set of shRNAs that scored in vivo (Fig. 1e, Supplementary Table 1), indicating that by performing shRNA screens in the context of a normal tumor microenviroment, we were able to identify a set of genes that exclusively impacts growth in a physiologically relevant setting.
We focused our follow-up studies on shRNA sets that specifically affected tumor growth in vivo. As a more stringent criterion, we selected genes for which 2 or more cognate shRNAs depleted on average at least 10-fold in mice (Table 1). Based on gene ontology (GO) classifications and manual curation, shRNAs targeting genes involved in cell motility, including dynamic actin reorganization and cell adhesion, were highly represented in the set of hairpins that specifically depleted in vivo (8 out of 11). Several of these genes were chosen for validation (Supplementary Fig. 2a). These included genes encoding Rac2, a hematopoetic-specific Rho GTPase important for the formation of lamellipodia during cell migration20,21, CrkL, an adaptor protein reported to be involved in the activation of Rac22, and Twinfilin (Twf1), an actin monomer-binding and actin filament capping protein23. For these genes, multiple independent shRNAs (Fig. 2a) recapitulated the initial screening phenotype. Specifically, while cells grown in the presence of these shRNAs grew robustly in culture, they all showed a selective depletion in lymph nodes following tail vein injection (Fig. 2b). To further characterize the efficiency of our screen, we examined a non-motility gene targeted by two depleted shRNAs and two genes targeted by a single scoring shRNA. shRNAs targeting the genes encoding IL-6 (two depleted shRNAs in our screen) and Lyn kinase (one depleted shRNA in our screen) depleted following introduction in mice, while shRNAs targeting the gene encoding AIF-1 (one depleted shRNA in our screen) failed to deplete (Supplementary Fig. 2b and data not shown). Thus, shRNAs targeting four out of four genes from the gene set identified using our most stringent criteria validated as single constructs, while the validation rate for single scoring shRNAs was lower.
Table 1. Genes targeted by at least 2 depleted shRNAs (on average >10-fold) in vivo.
| Intended shRNA target | Protein name | Putative role in motility |
|---|---|---|
| cdkn1b | Cyclin-dependent kinase inhibitor p27 | A cell cycle independent function of p27 regulates cell adhesion and migration via interaction with RhoA27. |
| crkl* | v-Crk sarcoma virus CT10 oncogene homolog | An adaptor protein reported to be involved in the activation of Rac22 |
| cyr61 | Cysteine-rich angiogenic inducer 61 | A secreted protein that mediates focal adhesions and is involved in cell attachment and migration 28. |
| ddx11 | RAS-related C3 botulinum substrate 2 | |
| il-6* | Interleukin 6 | |
| map2k3 | Map kinase kinase 3 | Operates upstream of p38 MAPk to regulate cell adhesion29. |
| nek4 | NIMA (never in mitosis gene a)-related kinase 4 | |
| opn5 | Neuropsin | A secreted protein that cleaves fibronectin, inhibiting alpha5 integrin-mediated adhesion30. |
| rac2* | RAS-related C3 botulinum substrate 2 | A hematopoetic-specific Rho GTPase important for the formation of lamellipodia during cell migration20. |
| twf1*1 | Twinfilin, actin-binding protein, homolog 1 (Drosophila) | An actin monomer-binding and actin filament capping protein23. |
| yes1 | v-Yes-1 Yamaguchi sarcoma viral oncogene homolog 1 | Signals downstream of CD95 to promote cell invasion in vivo31. |
Subject to further validation
Targeted by 3 shRNAs depleted by an average of >10-fold
Figure 2. Functional validation of shRNAs targeting putative cell motility genes.

(A) shRNA-mediated stable knockdown of Rac2, CrkL, and Twf1. Target protein/gene expression was measured by immunoblotting or qPCR. For qPCR samples, n=2 and bar graphs represent mean and standard deviation. (B) In vivo GFP competition assay to functionally validate candidate hits. Lymphoma cell cultures, partially transduced with a vector coexpressing GFP and the indicated shRNA, were maintained in culture for two weeks or injected into recipient mice. The fold change in the percentage of GFP positive lymphoma cells, relative to cells at injection, is shown. p-values were determined by a two-tailed Student's t-test. (n=7 for vector control and shRac2-1, n=8 for shRac2-2 in left panel; n=4 for vector control, n=3 for shCrkL-1 and shCrkL-2 in middle panel; n=4 for vector control and shTwf-2, n=3 for shTwf-1 in right panel). (C and D) Rac2, CrkL, or Twf1 suppression causes chemotaxis defects in transwell migration assays. Cells expressing a control vector, shRac2 (C), shTwf1, or shCrkL (D) were stimulated with SDF-1α. The number of cells that migrated is displayed as a fold change relative to control wells. p-values were determined by one-way ANOVA or a two-tailed Student's t-test. Bar graphs represent mean and standard deviation. n=2 for each experimental group.
To further characterize the role of genes identified in our screen in lymphoma homeostasis, we subjected shRNA-infected cells to secondary functional assays. Lymphoma cells suppressing Rac2, CrkL, or Twf1 showed motility defects in transwell migration assays, consistent with a role for these proteins in lymphoma cell migration (Fig. 2c and d and Supplementary Fig. 3a and b). Additionally, Rac2-deficient lymphoma cells showed defects in SDF-1α induced migration on fibronectin (Supplementary Movies 1 and 2). Suppression of Rac2 also resulted in impaired lymphoma cell migration in short term in vivo engraftment assays. Specifically, lymphoma cells suppressing Rac2 were depleted in the spleen and bone marrow two and twenty-four hours after tail vein injection (Fig. 3a). Similar to the effect Rac2 knockdown, lymphoma cells suppressing Wave2, an important mediator of cell migration known to function downstream of other Rac proteins24, showed chemotaxis defects in vitro and were selectively depleted in the lymph nodes at the time of disease presentation (Fig. 3b and Supplementary Fig. 3c and d).
Figure 3. Rac2 suppression impairs lymphoma cell migration and extends animal survival.

(A) Rac2 suppression causes defects in short term engraftment. Lymphoma cells expressing dsCherry or coexpressing GFP and shRac2 were mixed, injected into recipient mice, and assessed after 2 or 24 hours. p-values were determined by one-way ANOVA or a one-sample t-test. Bar graphs represent mean and standard deviation. n=1 for injected cells, n=3 for all other experimental groups. (B) Lymphoma cells suppressing Wave2 were depleted in an in vivo GFP competition assay. p-values were determined by a two-tailed Student's t-test. (n=7 for vector control, n=4 for shWave2-1). (C) Suppression of Rac2 impairs lymphoma cell migration to the lymph nodes and liver. 14 days after transplantation, shRac2 recipients show markedly reduced tumor dissemination. (D) Partially-transduced lymphoma cells were harvested from the liver at the time of disease presentation and the percentage of GFP positive cells was assessed. p-values were determined by one-way ANOVA. (n=7 for vector control, n=4 for shRac2-1 and shRac2-2) (E and F) Suppression of Rac2 in lymphoma cells delays disease progression. GFP sorted lymphoma cells were injected into recipient mice. Survival is displayed in Kaplan-Meier format (n=5 mice per group for tumor free survival and n=10 mice per group for overall survival).
Suppression of Rac2 was also selected against in common sites of lymphoid metastasis, such as the liver, as seen by histology and by GFP enrichment analysis (Figs. 3c and d). suggesting that Rac2 might represent a meaningful lymphoma drug target. In fact, suppression of Rac2 in lymphoma cells extended both tumor free and overall survival following tail vein injection (Fig. 3e and f). Similarly, lymphoma-bearing mice treated with NSC2376625, an inhibitor of Rac1 and Rac2 (Supplementary Fig. 4a)26, survived significantly longer than untreated controls (Fig. 4a). Notably, suppression of Twf1 also delayed tumor progression following lymphoma tail vein injection (Supplementary Fig. 4b). Thus, multiple proteins involved in actin reorganization and cell motility represent potential drug targets in B cell malignancies. Additionally, combinations of shRNAs produced synergistic effects on lymphoma growth (Supplementary Fig. 4c).
Figure 4. Suppression of Rac activity delays disease progression and potentiates the action of the chemotherapeutic vincristine.
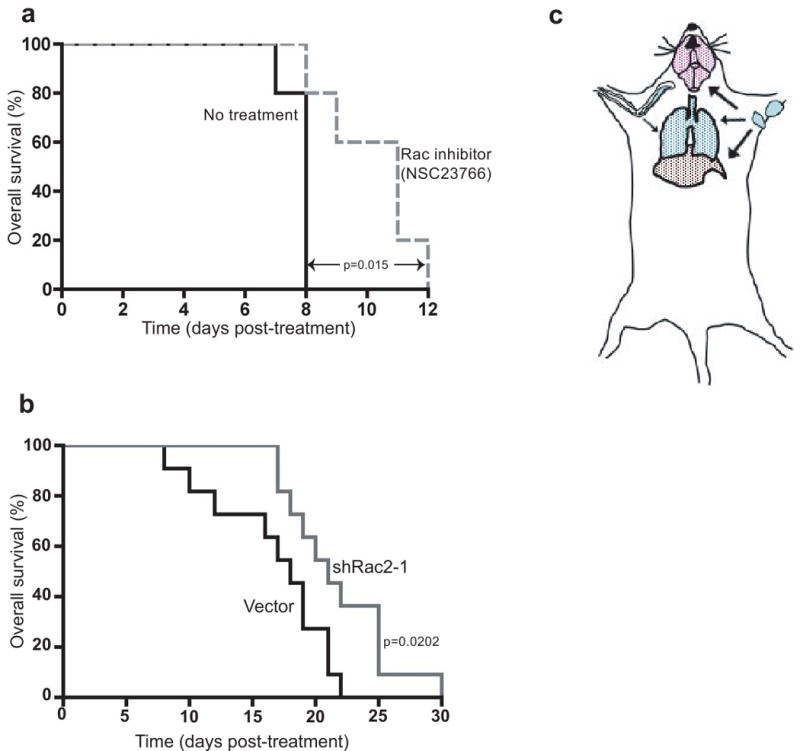
(A) Pharmacological inhibition of Rac2 extends animal lifespan. Mice were treated with the Rac inhibitor NSC23776 every 12 hours starting nine days after injection of lymphoma cells. Results are shown in Kaplan-Meier format (n=5 for each experimental group). (B) Suppression of Rac2 activity extends animal survival following vincristine treatment. Mice bearing vector control or shRac2 tumors were treated with vincristine 11 days after injection of lymphoma cells, and overall survival was monitored (n=11 for each experimental group. Data was compiled from three independent experiments). (C) A model for the role of Rac2 in relapse following vincristine treatment. The appearance of terminal disease following vincristine treatment may require tumor cell migration from sites of residual disease to metastatic sites, including liver, lung, and brain.
Interestingly, when lymphomas were treated with the chemotherapeutic vincristine, knockdown of Rac2 or Twf1 extended animal survival following drug treatment (Fig. 4b and Supplementary Fig. 4d). Importantly, this effect was specific for therapeutic response in vivo, as suppression of Rac2 did not sensitize lymphoma cells to vincristine treatment in culture (data not shown). These results suggest that there is a requirement for tumor cell mobilization in lymphoma relapse and that Rac2 and Twf1 activity is important in this mobilization (Fig. 4c). It further suggests that Rac2 or Twf1 inhibition, or inhibition of lymphoma cell motility by another mechanism, may synergize with conventional chemotherapeutics in the treatment of lymphoma.
Using a well-established mouse model of B cell lymphoma, we have adapted RNAi screens to in vivo applications. With this system, we were able to screen over 900 unique hairpins in individual mice. While improvements in RNAi technology will be required to perform saturating loss of function studies, this work demonstrates the feasibility of using large, unbiased shRNA sets for in vivo screens. Importantly, unlike conventional microarray studies, this approach investigates gene function, rather than gene expression – implicating “scoring” genes as directly relevant to interrogated phenotypes. We can envision using a similar approach to examine modulators of therapeutic response or tissue-specific tumor dissemination. Importantly, identification of similarly tractable genetic systems may permit the adaptation of this screening methodology to study tissue development or the biology of solid tumors.
Our screen identified modulators of lymphoma cell motility and chemotaxis as key determinants of tumor homeostasis. This group included known regulators of actin-based cell motility, as well as proteins, like Twf1, with known roles in actin dynamics but no established role in mammalian cell migration. Suppression of Rac2 and Twf1 in lymphoma cells impaired lymphoma cell migration to the lymph nodes and other organs that represent common sites of lymphoid metastasis. Additionally, pharmacological inhibition of Rac2 synergized with a conventional chemotherapeutic to extend the lifespan of tumor-bearing mice. These results highlight a potential therapeutic strategy in hematopoietic cancers, suggesting that, in instances where there is minimal metastasis at the time of initial treatment with traditional chemotherapeutics, suppression of cell migration may improve therapeutic outcome.
Methods
Cell culture and chemicals
Eμ-Myc;Arf-/- mouse B-cell lymphomas were cultured in B cell medium (45% DMEM/45% IMDM/10% FBS, supplemented with 2 mM L-glutamine and 5μM β-mercaptoethanol). γ-irradiated NIH 3T3 cells were used as feeder cells. Vincristine, doxorubicin, and the Rac inhibitor NSC23766 were purchased from Calbiochem. For in vivo studies, drugs were dissolved in a 0.9% NaCl solution prior to IP injection.
RNAi screen
Lymphoma cells were infected with an shRNA library targeting the cancer 1000 gene set (≈2250 hairpins) to a final infection of ≈20%. 48 hours after infection, lymphoma cells were GFP sorted. Immediately after sorting, 2×10⁶ lymphoma cells/mouse were injected into three syngeneic recipient mice by tail vein injection. Disease progression was monitored by lymph node palpation. Following the appearance of palpable lymphomas, approximately 14 days after tail-vein injection, lymphoma cells were harvested from the axillary, brachial, and cervical lymph nodes. For in vitro samples, infected lymphoma cells were plated in triplicate and maintained for two weeks. shRNAs were amplified from genomic DNA using primers that include adaptors for 454 sequencing (Supplementary Table 2). Following PCR amplification of hairpins, 454 sequencing was used to identify constituent shRNAs in each sample32. Fold change in hairpin representation after proliferation in vitro or in vivo was determined by comparing shRNA representation in each sample to that in a control cell population collected immediately after cell sorting. Hairpins that depleted 10-fold in all three in vitro or in vivo samples, and hairpins that enriched 5-fold in two out of three samples, based on a normalized read numbers, were considered candidate hits. Genes were not scored as candidate hits if multiple cognate hairpins showed opposing effects. All of the raw data from this screen has been deposited in the GEO database, accession number GSE16090.
shRNA constructs
shRNA constructs were designed and cloned as previously described9. Sequences targeted by shRNAs are provided in Supplementary Table 2.
Western blotting and RT-qPCR
For western blotting and RT-qPCR, protein or total RNA was isolated after retroviral infection and puromycin selection. Primers used for qPCR are available upon request. For western blotting, cell lysates were prepared in lysis buffer (1% sodium deoxycholine, 0.1% SDS, 1% triton-X, 10 mM Tris-HCl, pH 8.0, 140 mM NaCl) for 10 minutes. Lysates were cleared for 15 minutes at 14,000 rpm and mixed with 5× SDS sample buffer. Proteins were then run on a 12% SDS-PAGE gel, transferred to PVDF (Millipore) and detected with the following antibodies: anti-Rac2 (Proteintech Group, 1:200) and anti-tubulin (ECM Biosciences, 1:5000).
Competition and survival assays
For competition assays, lymphoma cells were partially infected with the indicated retroviruses and 4×10⁶ cells were tail-vein injected into syngeneic recipient mice. Following the appearance of palpable lymphomas, lymphoma cells were harvested from the lymph nodes and the percentage of GFP+ cells was analyzed on a Becton Dickinson FACScan flow cytometer. In parallel, lymphoma cells were maintained in culture for two weeks to assess the effect of the indicated shRNA on lymphoma cell proliferation in vitro. Dead cells were detected by propidium iodide incorporation (0.05 mg/mL) and were excluded from GFP analysis. For survival assays, cells were GFP sorted and 1 × 10⁶ cells/mouse were injected by tail-vein injection. Mice were treated with the Rac inhibitor NSC23766 every 12 hours (2.5 mg/kg) starting 9 days after tail vein injection. Mice were treated with a single dose of vincristine (1.5 mg/kg) 11 days after tail vein injection. Tumor free survival was monitored by palpation and overall survival was based on body condition score. For short-term engraftment assays, cells were GFP or dsCherry sorted, mixed at an even ratio, and 1×10⁶ cells/mouse were injected by tail-vein injection.
Migration assays
Recombinant murine SDF-1α (Peprotech) was used for migration assays. Lymphoma cells were serum starved in B cell media containing 2.5% FBS for 2 hours. 250,000 lymphoma cells resuspended in low serum B cell media were added to the upper chamber of 24-well transwell inserts (5 μm pore size, Millipore) and the indicated concentration of SDF was added to the lower chamber. The number of lymphoma cells that migrated to the lower chamber was quantified after 5 hours and is displayed as the fold change in cell number relative to control wells. For live imaging of lymphoma cell migration, glass bottom dishes (MatTek) were coated with fibronectin (Calbiochem). Lymphoma cells were resusupended in low serum B cell media at 2×10⁶ cells/mL, plated on fibronectin-coated dishes, and allowed to adhere for 2 hours. Non-adherent cells were then removed by gentle washing and cells were imaged after stimulation with SDF (100 ng/mL).
Statistical analysis
Statistical analysis was performed using GraphPad Prism4 software. Two-tailed Student's t-tests, one sample t-tests, and one-way ANOVA were used, as indicated. For comparison of survival curves, a Mantel-Haenszel test was used. Error bars represent standard deviation.
Supplementary Material
Acknowledgments
We would like to thank Ed van Veen for help with motility assays, Charlie Whittaker and Justin Pritchard for bioinformatic processing of sequencing data, Holly Thompson for expert technical assistance and members of the Hemann lab for helpful advice and discussions. M.T.H. is a Rita Allen Fellow and the Latham Family Career Development Assistant Professor of Biology and is supported by NIH RO1 CA128803-01. C.E.M. is supported by the MIT Department of Biology training grant, and E.E.H. and E.D. were supported by MIT's UROP program. Additional funding was provided by the Integrated Cancer Biology Program grant 1-U54-CA112967 to F.B.G. and M.T.H.
Footnotes
Database Accession Numbers: All of the raw data from this screen has been deposited in the GEO database, accession number GSE16090.
Author Contributions: C.E.M and M.T.H. designed the experiments and wrote the manuscript. C.E.M. and E.E.H performed the screen and subsequent validation experiments. E.D. and M.T.H. performed initial GFP dilution experiments. F.B.G. designed motility experiments.
References
- 1.van Lohuizen M, et al. Identification of cooperating oncogenes in E mu-myc transgenic mice by provirus tagging. Cell. 1991;65:737–52. doi: 10.1016/0092-8674(91)90382-9. [DOI] [PubMed] [Google Scholar]
- 2.Jonkers J, Berns A. Retroviral insertional mutagenesis as a strategy to identify cancer genes. Biochim Biophys Acta. 1996;1287:29–57. doi: 10.1016/0304-419x(95)00020-g. [DOI] [PubMed] [Google Scholar]
- 3.Uren AG, et al. Large-scale mutagenesis in p19(ARF)- and p53-deficient mice identifies cancer genes and their collaborative networks. Cell. 2008;133:727–41. doi: 10.1016/j.cell.2008.03.021. [DOI] [PMC free article] [PubMed] [Google Scholar]
- 4.Dupuy AJ, Akagi K, Largaespada DA, Copeland NG, Jenkins NA. Mammalian mutagenesis using a highly mobile somatic Sleeping Beauty transposon system. Nature. 2005;436:221–6. doi: 10.1038/nature03691. [DOI] [PubMed] [Google Scholar]
- 5.Collier LS, Carlson CM, Ravimohan S, Dupuy AJ, Largaespada DA. Cancer gene discovery in solid tumours using transposon-based somatic mutagenesis in the mouse. Nature. 2005;436:272–6. doi: 10.1038/nature03681. [DOI] [PubMed] [Google Scholar]
- 6.Suzuki T, Minehata K, Akagi K, Jenkins NA, Copeland NG. Tumor suppressor gene identification using retroviral insertional mutagenesis in Blm-deficient mice. Embo J. 2006;25:3422–31. doi: 10.1038/sj.emboj.7601215. [DOI] [PMC free article] [PubMed] [Google Scholar]
- 7.Adams JM, et al. The c-myc oncogene driven by immunoglobulin enhancers induces lymphoid malignancy in transgenic mice. Nature. 1985;318:533–8. doi: 10.1038/318533a0. [DOI] [PubMed] [Google Scholar]
- 8.Hemann MT, et al. An epi-allelic series of p53 hypomorphs created by stable RNAi produces distinct tumor phenotypes in vivo. Nat Genet. 2003;33:396–400. doi: 10.1038/ng1091. [DOI] [PubMed] [Google Scholar]
- 9.Dickins RA, et al. Probing tumor phenotypes using stable and regulated synthetic microRNA precursors. Nat Genet. 2005;37:1289–95. doi: 10.1038/ng1651. [DOI] [PubMed] [Google Scholar]
- 10.Zender L, et al. An oncogenomics-based in vivo RNAi screen identifies tumor suppressors in liver cancer. Cell. 2008;135:852–64. doi: 10.1016/j.cell.2008.09.061. [DOI] [PMC free article] [PubMed] [Google Scholar]
- 11.Westbrook TF, et al. A genetic screen for candidate tumor suppressors identifies REST. Cell. 2005;121:837–48. doi: 10.1016/j.cell.2005.03.033. [DOI] [PubMed] [Google Scholar]
- 12.Schlabach MR, et al. Cancer proliferation gene discovery through functional genomics. Science. 2008;319:620–4. doi: 10.1126/science.1149200. [DOI] [PMC free article] [PubMed] [Google Scholar]
- 13.Grueneberg DA, et al. Kinase requirements in human cells: IV. Differential kinase requirements in cervical and renal human tumor cell lines. Proc Natl Acad Sci U S A. 2008;105:16490–5. doi: 10.1073/pnas.0806578105. [DOI] [PMC free article] [PubMed] [Google Scholar]
- 14.Firestein R, et al. CDK8 is a colorectal cancer oncogene that regulates beta-catenin activity. Nature. 2008;455:547–51. doi: 10.1038/nature07179. [DOI] [PMC free article] [PubMed] [Google Scholar]
- 15.Luo B, et al. Highly parallel identification of essential genes in cancer cells. Proc Natl Acad Sci U S A. 2008;105:20380–5. doi: 10.1073/pnas.0810485105. [DOI] [PMC free article] [PubMed] [Google Scholar]
- 16.Ngo VN, et al. A loss-of-function RNA interference screen for molecular targets in cancer. Nature. 2006;441:106–10. doi: 10.1038/nature04687. [DOI] [PubMed] [Google Scholar]
- 17.Berns K, et al. A large-scale RNAi screen in human cells identifies new components of the p53 pathway. Nature. 2004;428:431–7. doi: 10.1038/nature02371. [DOI] [PubMed] [Google Scholar]
- 18.Kelly PN, Dakic A, Adams JM, Nutt SL, Strasser A. Tumor growth need not be driven by rare cancer stem cells. Science. 2007;317:337. doi: 10.1126/science.1142596. [DOI] [PubMed] [Google Scholar]
- 19.Burgess DJ, et al. Topoisomerase levels determine chemotherapy response in vitro and in vivo. Proc Natl Acad Sci U S A. 2008;105:9053–8. doi: 10.1073/pnas.0803513105. [DOI] [PMC free article] [PubMed] [Google Scholar]
- 20.Burridge K, Wennerberg K. Rho and Rac take center stage. Cell. 2004;116:167–79. doi: 10.1016/s0092-8674(04)00003-0. [DOI] [PubMed] [Google Scholar]
- 21.Ridley AJ, Paterson HF, Johnston CL, Diekmann D, Hall A. The small GTP-binding protein rac regulates growth factor-induced membrane ruffling. Cell. 1992;70:401–10. doi: 10.1016/0092-8674(92)90164-8. [DOI] [PubMed] [Google Scholar]
- 22.Nishihara H, et al. DOCK2 associates with CrkL and regulates Rac1 in human leukemia cell lines. Blood. 2002;100:3968–74. doi: 10.1182/blood-2001-11-0032. [DOI] [PubMed] [Google Scholar]
- 23.Helfer E, et al. Mammalian twinfilin sequesters ADP-G-actin and caps filament barbed ends: implications in motility. Embo J. 2006;25:1184–95. doi: 10.1038/sj.emboj.7601019. [DOI] [PMC free article] [PubMed] [Google Scholar]
- 24.Smith LG, Li R. Actin polymerization: riding the wave. Curr Biol. 2004;14:R109–11. [PubMed] [Google Scholar]
- 25.Gao Y, Dickerson JB, Guo F, Zheng J, Zheng Y. Rational design and characterization of a Rac GTPase-specific small molecule inhibitor. Proc Natl Acad Sci U S A. 2004;101:7618–23. doi: 10.1073/pnas.0307512101. [DOI] [PMC free article] [PubMed] [Google Scholar]
- 26.Cancelas JA, et al. Rac GTPases differentially integrate signals regulating hematopoietic stem cell localization. Nat Med. 2005;11:886–91. doi: 10.1038/nm1274. [DOI] [PubMed] [Google Scholar]
- 27.Besson A, Gurian-West M, Schmidt A, Hall A, Roberts JM. p27Kip1 modulates cell migration through the regulation of RhoA activation. Genes Dev. 2004;18:862–76. doi: 10.1101/gad.1185504. [DOI] [PMC free article] [PubMed] [Google Scholar]
- 28.Leask A, Abraham DJ. All in the CCN family: essential matricellular signaling modulators emerge from the bunker. J Cell Sci. 2006;119:4803–10. doi: 10.1242/jcs.03270. [DOI] [PubMed] [Google Scholar]
- 29.Nick JA, et al. Selective activation and functional significance of p38alpha mitogen-activated protein kinase in lipopolysaccharide-stimulated neutrophils. J Clin Invest. 1999;103:851–8. doi: 10.1172/JCI5257. [DOI] [PMC free article] [PubMed] [Google Scholar]
- 30.Tani N, et al. Effects of fibronectin cleaved by neuropsin on cell adhesion and migration. Neurosci Res. 2001;39:247–51. doi: 10.1016/s0168-0102(00)00213-3. [DOI] [PubMed] [Google Scholar]
- 31.Kleber S, et al. Yes and PI3K bind CD95 to signal invasion of glioblastoma. Cancer Cell. 2008;13:235–48. doi: 10.1016/j.ccr.2008.02.003. [DOI] [PubMed] [Google Scholar]
- 32.Margulies M, et al. Genome sequencing in microfabricated high-density picolitre reactors. Nature. 2005;437:376–80. doi: 10.1038/nature03959. [DOI] [PMC free article] [PubMed] [Google Scholar]
Associated Data
This section collects any data citations, data availability statements, or supplementary materials included in this article.