

Abstract
Conditioned taste aversion (CTA) learning occurs after the pairing of a novel taste with a toxin (e.g. sucrose with LiCl). The immediate-early gene c-Fos is necessary for CTA learning, but c-Fos alone cannot be sufficient for consolidation. The expression of other AP-1 proteins from the Fos- and Jun-families may also be required shortly after conditioning for CTA consolidation. To screen for the expression of AP-1 transcription factors within small subregions, RT-PCR analysis was used after laser capture microdissection of the amygdala. Rats were infused intraorally with 5% sucrose (6ml/6min) or injected with LiCl (12ml/kg, 0.15M, i.p.) or given sucrose paired with LiCl (sucrose/LiCl), or not treated; 1 h later their brains were dissected. The lateral (LA), basolateral (BLA), and central (CeA) subnuclei of the amgydala of single 5 μm sections from individual rats were dissected using the Arcturus PixCell II system. Semi-quantitative RT-PCR showed the consistent presence of c-Fos, Fra-2, c-Jun, and JunD in the amygdala. In situ hybridization confirmed that c-Fos and Fra-2 mRNA expression was increased in the CeA after LiCl and sucrose/LiCl treatment. Immunohistochemistry for Fra-2 revealed high baseline levels of Fra-2 protein in the BLA and CeA, but also an increase in Fra-2 in the BLA and CeA after LiCl and sucrose/LiCl treatment. The similarity of response in LiCl and sucrose/LiCl treated groups might reflect activation by LiCl in both groups. To control for the effects of LiCl, rats were tested in a learned safety experiment. Fra-2 and c-Fos were examined in response to sucrose/LiCl in rats with prior familiarity with sucrose compared to rats without prior exposure to sucrose. The familiar (pre-exposure) group showed a significantly decreased number of Fra-2-positive cells compared with the novel group in the BLA, but not in the CeA. Because pre-exposure to sucrose attenuates CTA learning, a decreased cellular response in pre-exposed rats suggests a specific correlation with CTA learning. Changes in Fra-2 and c-Fos expression in the BLA and CeA at the time of conditioning, together with constitutive expression of c-Jun and JunD, may contribute to CTA learning.
Keywords: Ingestive behavior, basolateral amygdala, lateral amygdala, central nucleus of the amygdala, laser capture microdissection, sucrose, lithium chloride
1. Introduction
Conditioned taste aversion (CTA) occurs after the pairing of a novel taste (the conditioned stimulus; CS) with a toxin (the unconditioned stimulus; US) (Garcia et al., 1974). Based on measures of neuronal activity, tract-tracing, and lesion studies, several regions are known to participate in CTA learning, including the nucleus of the solitary tract (NTS), parabrachial nucleus (PBN), gustatory cortex, lateral hypothalamus, and the amygdala. Consistent with the amygdala’s role in other forms of aversive conditioning (Gallagher and Chiba, 1996; LeDoux, 1993), electrolytic (Lasiter and Glanzman, 1985; Schafe and Bernstein, 1996) and excitotoxic (Yamamoto et al., 1995) lesions of the rat amygdala block or attenuate CTA learning. Administration into the rat amygdala of anisomycin, a protein synthesis inhibitor (Lamprecht and Dudai, 1996), or tetrodotoxin, a blocker of synaptic transmission (Roldan and Bures, 1994), also impaired CTA acquisition. Thus, the amygdala plays a pivotal role in CTA learning and memory.
The induction of c-Fos has been used as a cellular marker of neural activation during CTA learning. For example, after administration of LiCl as an US, the number of c-Fos positive cells is elevated in the PBN (Swank and Bernstein, 1994; Yamamoto et al., 1992) the NTS (Houpt et al., 1994; Swank and Bernstein, 1994; Yamamoto et al., 1992), and in the central nucleus of the amygdala (CeA) (Spencer and Houpt, 2001; Yamamoto et al., 1992). c-Fos is also induced in response to the taste CS, although it is usually of lower magnitude compared to the LiCl response (Houpt et al., 1994; Mickley et al., 2004; Swank and Bernstein, 1994). Intraoral infusions of saccharin alone or drinking saccharin from a bottle induced c-Fos-positive cells in the insular cortex and CeA, with significantly more induction of c-Fos in rats without prior experience of saccharin (Koh et al., 2003b).
Upstream of c-Fos induction, there is evidence that the cAMP and cAMP response element binding protein (CREB) pathway is activated within the amygdala during CTA learning. Injection of Rp-cAMP, an antagonist of cAMP effects on protein kinase A (PKA), attenuated long-term but not short-term CTA memory in rats (Koh et al., 2002). Similarily, knockout mice with a forebrain-specific disruption of the gene for the regulatory subunit of PKA showed impaired CTA learning (Koh et al., 2003a). Downstream of PKA, phosphorylation of CREB was increased in the amygdala during CTA learning (Swank, 2000). Local microinjection of antisense oligodeoxynucleotides of CREB into the rat CeA impaired long-term CTA learning (Lamprecht et al., 1997). In addition to c-Fos, phosphoCREB also regulates the gene inducible cAMP response element repressor (ICER), which is induced by LiCl in the CeA (Spencer and Houpt, 2001). Thus cAMP, PKA and phosphorylation of CREB appear to be part of the molecular cascade leading to CTA learning.
Activation of the cAMP-PKA-CREB pathway can induce c-Fos expression (Bravo et al., 1987; Kruijer et al., 1985) via the consensus cAMP response element (CRE) sites in the c-Fos promoter (Fisch TM, 1989; Sassone-Corsi et al., 1988), thus revealing neurons and circuits activated during CTA learning. c-Fos gene expression at the time of CTA acquisition is not only a marker of neural activity. Local microinjection of antisense c-Fos oligonucleotides into rat amygdala to block c-Fos synthesis blocked CTA acquisition (Lamprecht and Dudai, 1996). Thus, c-Fos serves a functional role in CTA learning. Of course, c-Fos is induced in the amygdala by LiCl (and many other stressors) in the absence of CTA learning. Therefore, although c-Fos is present in the amygdala and necessary for CTA learning, c-Fos expression alone cannot be sufficient. It is possible, however, that specific subpopulations of amygdalar neurons are activated and express c-Fos following different treatments, such that a particular subpopulation is specifically activated during CTA learning. Also, we cannot rule out the possibility that c-Fos expression in other brain regions may serve as an exclusive correlate of CTA learning, thus labeling cells that are activated only by the contingent pairing of taste and toxin. (Mickley et al., 2004).
Likewise, at the intracellular level, c-Fos alone is not sufficient to regulate target gene expression that is presumed to underlie long-term consolidation of CTA. Without dimerizing to a complementary member of the activator protein 1 (AP-1) family, c-Fos is unlikely to be functional. The AP-1 family is a group of transcription factors composed of Fos (c-Fos, FosB, Fra-1 and Fra-2) and Jun (c-Jun, JunB and JunD) proteins. AP-1 family members bind each other to make homo- or heterodimers. AP-1 dimers regulate expression of target genes as a result of binding to specific AP-1 DNA binding sites in promoter regions (Foletta, 1996; Karin et al., 1997). c-Fos does not bind to the AP-1 binding site in the absence of c-Jun or other Jun family members (Rauscher et al., 1988), and c-Fos protein alone is not sufficient to induce AP-1-mediated reporter gene expression (Chiu et al., 1988).
Because of the many possible combinations between AP-1 family members, and because of ~33% of all mammalian genes have AP-1 sites (Zhou et al., 2005), very specific gene expression can be regulated by AP-1 proteins across tissues and stimuli. Thus, it is possible that transcriptional regulation by AP-1 members contributes to consolidation of CTA memory. The induction of c-Fos by LiCl identifies a set of candidate genes that must also be involved in CTA learning, namely the AP-1 family.
Other than c-Fos, little is known about the expression pattern of AP-1 transcription factors during CTA learning. In one study, changes in c-Fos, FosB, and JunB expression were detected in the CeA and brainstem after LiCl administration in mice (Swank, 1999). The present study was performed to screen expression of all seven AP-1 genes within the rat amygdala. In order to profile mRNA expression within discrete subregions of the amygdala, we used reverse transcription-polymerase chain reaction (RT-PCR) with laser capture microdissection (LCM) (Bonner et al., 1997; Schutze and Lahr, 1998). The LCM technique allowed us to precisely dissect out specific subregions of the amygdala, and RT-PCR using a collection of primer pairs also allowed us to investigate mRNA expression of multiple AP-1 genes beginning with only a few micrograms of amygdala tissue.
Using LCM and RT-PCR of individual subnuclei of the amygdala, we first analyzed broad patterns of AP-1 gene expression after no treatment, intraoral infusion of sucrose, LiCl injection, or the pairing of sucrose with LiCl. Intraoral infusions were used both to standardize the gustatory stimulus, and because intraoral CTA learning is especially dependent on the amygdala (Schafe et al., 1998). Amygdalar regions were examined 1 hour after treatment, when c-Fos mRNA and protein expression after LiCl is maximal (Spencer and Houpt, 2001). We found evidence for the expression of c-Fos, Fra-2, FosB, c-Jun, JunB and JunD (but not Fra-1) in the basolateral amygdala (BLA), CeA, and lateral amygdala (LA). For the most robustly expressed genes, in particular Fra-2, we used in situ hybridization and immunohistochemistry to measure the expression patterns more precisely.
In general, both LiCl and sucrose/LiCl treatments increased c-Fos in the CeA and Fra2 in the CeA and BLA. The similarity of response in LiCl and sucrose/LiCl treated groups might reflect activation by LiCl in both groups, with little specific contribution from the pairing of sucrose. To control for the effects of LiCl, rats were tested in a learned safety experiment (Koh et al., 2003b). Fra-2 and c-Fos were examined in response to sucrose/LiCl in rats with prior familiarity with sucrose compared to rats without prior exposure to sucrose. The familiar (pre-exposure) group showed a significantly decreased number of Fra-2-positive cells compared with the novel group in the BLA, but not in the CeA. Because pre-exposure to sucrose attenuates CTA learning, a decreased cellular response in pre-exposed rats suggests a specific correlation of Fra-2 expression in the BLA with CTA learning.
2. Results
2.1 Experiment 1. LCM and RT-PCR
Rats received one of four different treatments (sucrose, LiCl, sucrose/LiCl or no treatment). Although tissue was microdissected from 6 rats after each of the four treatments, sufficient RNA for RT-PCR was extracted from only a subset of rats in each group: sucrose infusion (n = 4), LiCl injection (n = 4), sucrose infusion paired with LiCl injection (n = 5), or no treatment (n = 3 for CeA and LA, n=4 for BLA). There was no difference in intake between the two groups receiving intraoral infusions of sucrose; average intake was 3.8 ± 0.4 g. One hour later, the rats were anesthetized with sodium pentobarbital, decapitated, and the brains were dissected and frozen without fixation. Thin sections (5 μm) were cut through the amygdala, lightly stained with Histogene staining solution, and dehydrated. Three different regions of the amygdala (BLA, CeA, and LA) were microdissected using a PixCell II LCM system (Arcturus, Mountain View, CA). The boundaries of each subnucleus were determined with reference to gross landmarks visible even in a lightly-stained section, such as the rhinal fissure, optic tract, external capsule, and longitudinal association bundle, and the stria terminalis (See Figure 1). For each rat, each region was dissected unilaterally from a single tissue section onto an individual CapSure HS microfuge cap (Arcturus). Microdissection from a 5 μm section of a single unilateral subregion of the amygdala yielded sufficient total RNA for at least 10 RT-PCR reactions (see Figure 2).
Figure 1.
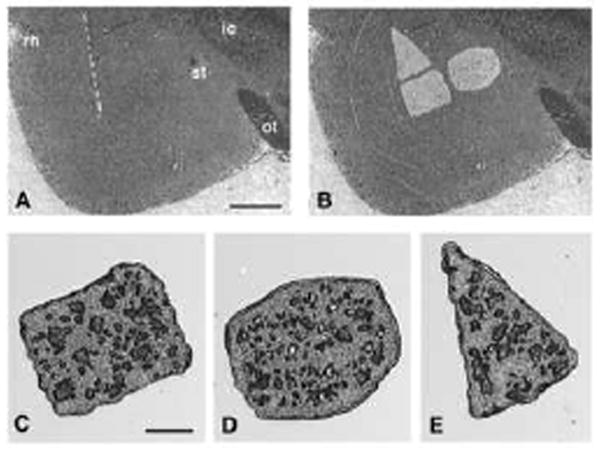
Microdissection of the amygdala nuclei by laser capture microdissection. A stained and dehydrated 5 μm section of unfixed rat brain is shown before (A) and after (B) microdissection of the three different subnuclei of the amygdala. The captured regions were transferred to individual microfuge caps (C-E) for RT-PCR analysis. C. Basolateral amygdala (BLA). D. Central Nucleus (CeA). E. Lateral amygdala (LA). rh, rhinal fissure; st, stria terminalis; ic, internal capsule; ot, optic tract. Dashed line, external capsule. Scale bar in (A), 1 mm; in (C), 250 μm.
Figure 2.
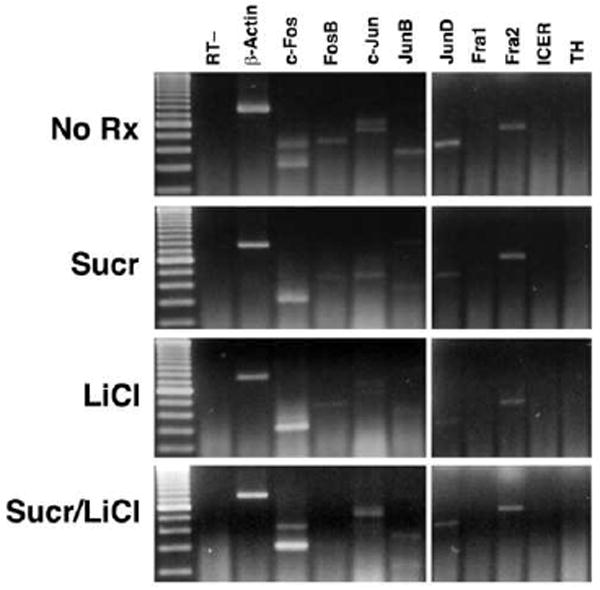
Example of RT-PCR products of AP-1 family members, ICER, TH and β-actin amplified from individual CeA from an untreated rat (“No Rx”), or 1 hour after intraoral infusion of sucrose, injection of LiCl, or the pairing of sucrose with LiCl (“Sucr/LiCl”).
β-actin was detected in all samples. c-Fos, Fra-2, and c-Jun were detected in the BLA, CeA and LA in the majority of rats (~ 90 %) in all conditions. FosB, JunB and JunD were variably present; the 3 species of mRNA were detected in some rats after all treatments (~ 42%), but not in a consistent pattern across amygdalar regions or treatments.
Fra-1 and ICER expression were not detected in any amygdalar regions after any treatment. Tryosine hydroxylase (TH) expression was absent in the BLA and LA of almost all rats (16 of 17 rats); in the CeA, TH mRNA was generally absent, but it was detected in a small number of rats (7 of 16 rats). The presence of TH mRNA could be due to amplification of trace amounts of TH mRNA in catecholaminergic fibers innervating the CeA (Asan, 1998).
Because the levels of c-Fos and Fra-2 product appeared to differ across treatments, we attempted to quantify changes in the amount of RT-PCR product as measured by the intensity of their bands in the agarose gels, normalized to β-actin levels from the same microdissected sample. Using this metric, c-Fos RT-PCR product was significantly increased in the CeA compared to rats in the no treatment group (F(3,14) = 4.83, p < 0.05) after LiCl (398 ± 76%) and sucrose/LiCl paired treatment (340 ± 60%) but not after sucrose alone. There was a similar tendency for Fra-2 mRNA to increase in the CeA after LiCl treatment (174 ± 44 %), but the increase was not significant. There were no differences in c-Fos or Fra-2 RT-PCR product in the LA or BLA, nor were there specific changes among groups in c-Jun, JunB, JunD and FosB mRNA expression after any treatment.
2.2 Experiment 2. In situ hybridization
The RT-PCR results were confirmed by in situ hybridization in a second set of rats. One hour after the four different treatments (n=6 in each group), rats were anesthetized with sodium pentobarbital and perfused. There was no difference in intake between the two groups receiving intraoral infusions of sucrose; average intake was 4.5 ± 0.4 g. Tissue sections were cut through the amygdala and incubated with 35S-labeled antisense RNA probes of c-Fos, Fra-2, c-Jun, and JunD cDNAs made by in vitro transcription.
2.2.1 c-Fos in situ hybridization
c-Fos mRNA levels were relatively low in the LA and BLA of the amygdala with no significant differences among all treatments (see Figure 3, top panels, and Figure 4). Although not significant by ANOVA, levels of c-Fos mRNA were lower in the BLA after LiCl compared to Sucrose/LiCl by t-test (p = 0.02).
Figure 3.
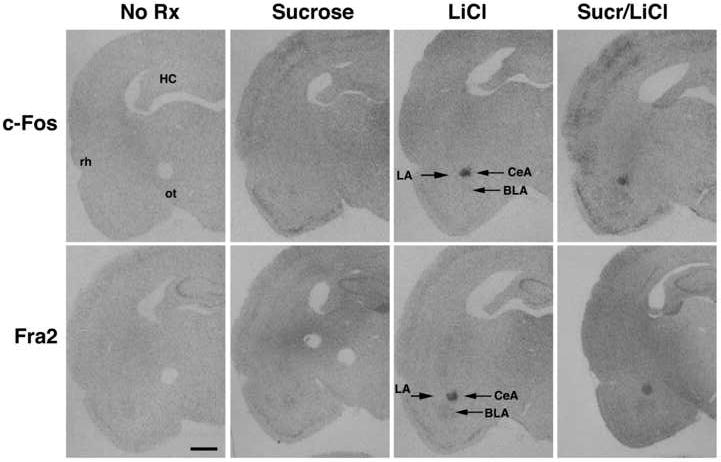
Autoradiograms of c-Fos (top panels) and Fra-2 (bottom panels) in situ hybridization in the amygdala of an untreated rat (“No Rx”), or 1 h following an intraoral infusion of sucrose, injection of LiCl, or the pairing of sucrose with LiCl (“Sucr/LiCl”). Abbreviations as in Figure 1. Scale bar, 2 mm. c-Fos mRNA and Fra-2 mRNA are clearly visible in the CeA from both the LiCl and Sucr/LiCl groups. Low levels of Fra-2 mRNA were observed in the BLA of all groups.
Figure 4.

Quantification of c-Fos in situ hybridization within the BLA (A), CeA (B) and LA (C) in untreated rats (“No Rx”), or 1 h following an intraoral infusion of sucrose, injection of LiCl, or the pairing of sucrose with LiCl (“Sucr/LiCl”). Data represent mean relative optical density ± S.E.M. and are normalized to the untreated group. No differences across groups were found in the BLA or LA. In the CeA, significant increases in c-Fos mRNA were seen in the LiCl and Sucr/LiCl group. * p<0.05 vs. untreated rats, † p <0.05 vs. sucrose.
In the CeA, c-Fos mRNA levels were low after no treatment or sucrose infusions, but were significantly elevated from no treatment levels after LiCl or sucrose/LiCl treatments (F(3,23)=3.94, p < 0.05).
2.2.2 Fra-2 in situ hybridization
Fra-2 expression in the amygdala was both region-specific and dependent on treatment (see Figure 3, bottom panels, and Figure 5). Compared to the optical density of the CeA and LA in the no treatment condition, the BLA appeared to have relatively high levels of Fra-2 mRNA under all conditions. However, no significant difference in Fra-2 mRNA in the BLA was induced by any of the treatments. The CeA had relatively low levels of Fra-2 mRNA under the no treatment condition. There was a significant effect of treatment (F(3,23) = 9.28, p < 0.0005), such that Fra-2 mRNA after LiCl treatment or combined sucrose/LiCl treatment was elevated compared to the no treatment and sucrose conditions. The LA had relatively low levels of Fra-2 mRNA under all conditions, with no significant differences after any treatment.
Figure 5.
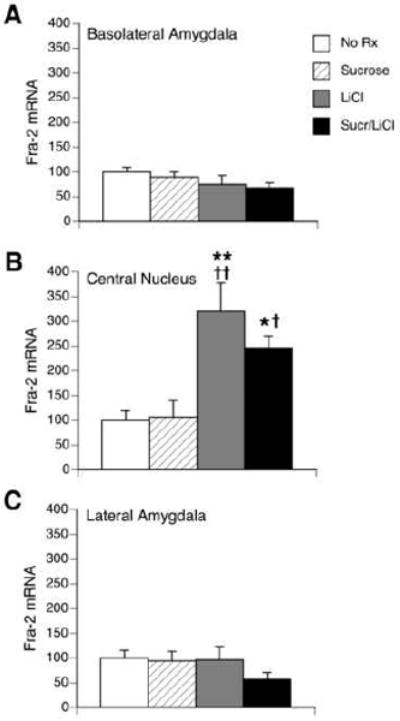
Quantification of Fra-2 in situ hybridization within the BLA (A), CeA (B) and LA (C) in untreated rats (“No Rx”) or 1 h following an intraoral infusion of sucrose, injection of LiCl, or the pairing of sucrose with LiCl (“Sucr/LiCl”). Data represent mean relative optical density ± S.E.M. and are normalized to the untreated group. No differences across groups were found in the BLA or LA. In the CeA, significant increases in Fra-2 mRNA were seen in the LiCl and Sucr/LiCl group. * p<0.05, ** p < 0.005 vs. untreated rats, † p <0.05, †† p <0.005 vs. sucrose. n = 6 per group.
2.2.3 c-Jun and JunD in situ hybridization
The signal intensity of 35S-labeled riboprobes for c-Jun and JunD mRNA was not above tissue background levels, and no induction of c-Jun or JunD was observed after any treatment.
2.3 Experiment 3. Fra-2 immunohistochemistry
Because an increase in Fra-2 mRNA was observed by in situ hybridization, we checked the levels of Fra-2 protein by immunohistochemistry in an additional set of rats. One hour after the 4 different treatments, rats (n=6 each group) were overdosed with sodium pentobarbital, perfused and tissue sections through the amygdala were processed with a Fra-2 polyclonal antibody. There was no difference in intake between the two groups receiving intraoral infusions of sucrose; average intake was 4.0 ± 0.4 g. The pattern of Fra-2 expression observed with immunohistochemistry was similar to the pattern of Fra-2 mRNA expression (see Figures 6 and 7). A large number of Fra-2 positive cells was seen in the BLA under all conditions. There was also a significant effect of treatment (F(3,23) = 6.79, p < 0.005; see Figure 7A). LiCl increased the number of Fra-2 cells in the BLA compared to the no treatment and sucrose groups. Sucrose/LiCl treatment increased the number of Fra-2-positive cells in the BLA compared to sucrose alone, but not compared to the no treatment group (p = 0.08). The CeA also had a large number of Fra-2 positive cells under all conditions, and there was a significant effect of treatment (F(3,23) = 7.83, p < 0.005; see Figure 7B). LiCl increased the number of Fra-2 cells compared to no treatment and sucrose treatment. The pairing of sucrose with LiCl induced significantly more Fra-2-positive cells than sucrose alone, but did not induce significantly more cells than no treatment (p = 0.07). Very few Fra-2-positive cells (<10 cells per section) were seen in the LA, with no differences between treatment groups (see Figure 7C).
Figure 6.
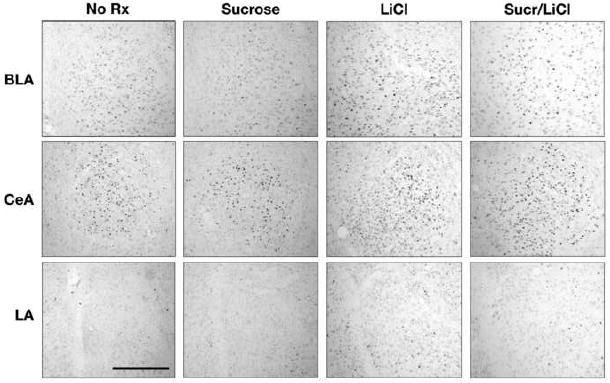
Photomicrographs of Fra-2 immunohistochemistry in the BLA (top row), CeA (middle row) and LA (bottom row) from an untreated rat (“No Rx”) and 1 h following an intraoral infusion of sucrose, injection of LiCl or the pairing of sucrose with LiCl (“Sucr/LiCl”) Scale bar, 500 μm.
Figure 7.
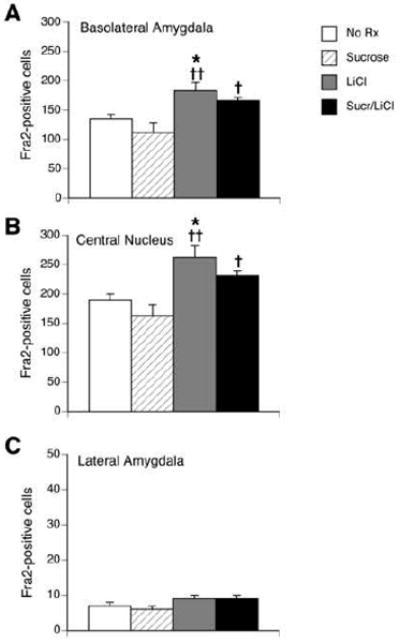
Quantification of Fra-2 immuno-positive cells in BLA (A), CeA (B) and LA (C) in untreated rats (“No Rx”), or 1 h following an intraoral infusion of sucrose, injection of LiCl or the pairing of sucrose with LiCl (“Sucr/LiCl”). In both the BLA and the CeA, LiCl-treated rats had significantly more Fra-2 positive cells compared to untreated rats or sucrose rats, while the Sucr/LiCl group had significantly more cells than sucrose rats only. No differences across groups were found in the LA. * p <0.05 vs. untreated rats, † p < 0.05, †† p < 0.005 vs. sucrose. n = 6 per group.
Because the injection of LiCl (with or without sucrose infusion) appeared to increase the number of Fra-2-positive cells in the CeA and BLA compared to uninjected controls, we compared the effects of injecting NaCl or LiCl (0.15 M, 12 ml/kg, n=4/group) as a control for the injection procedure. LiCl induced significantly more Fra-2 positive cells in the BLA and CeA, and significantly more c-Fos in the CeA (see Figure 8).
Figure 8.
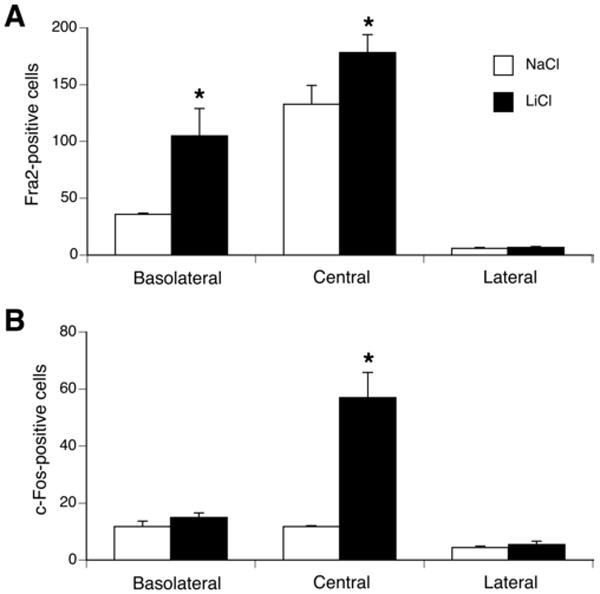
Quantification of Fra-2 (A) and c-Fos (B) immuno-positive cells in BLA, CeA and LA in rats 1 h following an injection (0.15M, 12 ml/kg) of NaCl (white) or LiCl (black). Compared to a NaCl injection, LiCl induced significantly more Fra-2 positive cells in the BLA and CeA, and significantly more c-Fos in the CeA. No differences in the number of Fra-2 or c-Fos positive cells between groups were found in the LA. * p <0.05 vs. saline group. n = 4 per group.
2.4 Experiment 4. Effect of sucrose pre-exposure on Fra-2 and c-Fos expression during CTA learning
One test of whether a gene product is important in CTA learning is if expression of the gene is diminished when CTA learning is diminished (Koh et al., 2003b). This can be tested using pre-exposure to the taste (“learned safety”), which impairs the formation of LiCl-induced CTA learning (Bakner et al., 1991; Revusky and Bedarf, 1967; Turgeon and Reichstein, 2002) and taste-induced c-Fos in the central nucleus of the amygdala (Koh et al., 2003b). Therefore, we investigated differences in Fra-2 and c-Fos expression between groups that would be predicted to have robust CTA learning (with novel sucrose) or diminished CTA learning (after sucrose pre-exposure). The familiar and novel groups were pre-exposed 6 times to 5% sucrose or distilled water, respectively, before CTA conditioning (see the experimental procedure for details). During pre-exposure, rats in the familiar group receiving intraoral infusions of 5% sucrose consumed significantly more than did rats in the novel group receiving intraoral infusions of distilled water (4.3 ± 0.5 g vs. 1.8 ± 0.3 g, p < 0.005). During the final infusion prior to the injection of LiCl, both groups consumed most of the 5% sucrose (familiar, 4.1 ± 0.8 g vs novel, 4.6 ±0.6 g, p = 0.3). One hour after the pairing of sucrose and LiCl, rats were perfused and processed for c-Fos and Fra-2 immunohistochemistry. The familiar group showed a significantly decreased number of Fra-2-positive cells compared with the novel group in the BLA (p < 0.05; see Figure 9A). However, no significant differences in the number of Fra-2-positive cells in the CeA (p = 0.2) and LA (p=0.2) were observed (see figure 9A). There was no significant difference in the number of c-Fos-positive cells between familiar and novel groups in the LA (p = 0.051), BLA (p = 0.08) and CeA regions (p =0.2; see figure 9B).
Figure 9.
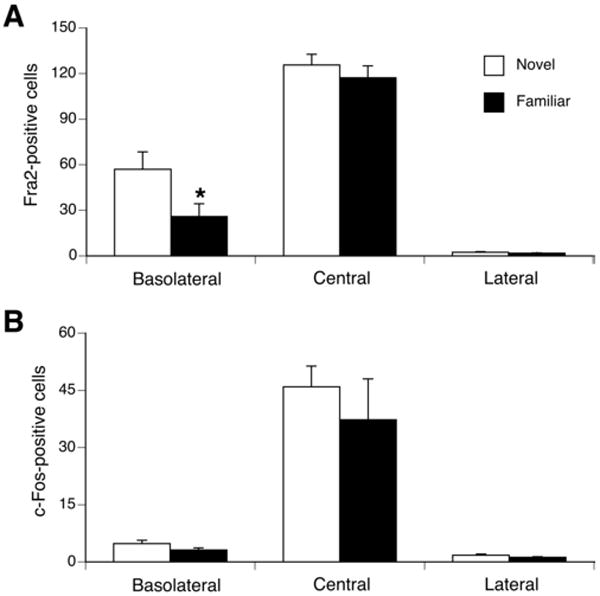
Quantification of Fra-2 (A) and c-Fos (B) immuno-positive cells in BLA, CeA and LA in sucrose (familiar) or water (novel) pre-exposed rats 1 h after an intraoral infusion of sucrose paired with LiCl injection. In the BLA, the familiar group had significantly less Fra-2 positive cells compared to the novel group. No differences in the number of Fra-2 positive cells between groups were found in the CeA and LA. No differences in the number of c-Fos positive cells between groups were found in the BLA, CeA and LA. * p <0.05 vs. novel group. n = 6 per group.
3. Discussion
In the present study, we examined the expression patterns of AP-1 transcription factors in the amygdala during CTA learning. Using laser capture microscopy and RT-PCR, we screened discrete regions of the amygdala for the presence and regulation of AP-1 family members after sucrose, LiCl, or the pairing of sucrose with LiCl. Semi-quantitative RT-PCR showed the consistent presence of c-Fos, Fra-2, c-Jun, and JunD. Regulation of the detected genes was further examined using in situ hybridization and immunohistochemistry. In situ hybridization confirmed that c-Fos mRNA expression was increased in the CeA after LiCl and sucrose/LiCl treatment, although sucrose infusion itself did not induce c-Fos mRNA. Similar to c-Fos regulation, LiCl and sucrose/LiCl treatment increased Fra-2 mRNA and immunolabeling in the CeA. Unlike the low basal levels of c-Fos, however, immunohistochemistry revealed high baseline levels of Fra-2 positive cells in the CeA and basolateral amygdala under all conditions. When rats with pre-exposure to sucrose were tested with sucrose/LiCl, the familiar (pre-exposure) group showed a significantly decreased number of Fra-2-positive cells compared with the novel group in the BLA. Because the familiar group would be expected to have decreased CTA learning, the correlation of Fra-2 expression in the BLA suggests a specific response during CTA learning.
3.1 LCM and RT-PCR
We profiled mRNA expression of a number of genes in small subregions of the amygdala using RT-PCR with LCM. The LCM technique has some advantages over dissection with tissue punches. Discrete regions of arbitrary shape can be visualized under the microscope and dissected using laser punches of 7 – 30 μm diameter. Thus, the closely-packed BLA, CeA, and LA subnuclei were dissociated and individually analyzed by RT-PCR.
Using a panel of specific primer pairs, RT-PCR allowed us to investigate mRNA expression of multiple AP-1 genes within small amount of the amygdala tissue (i.e. < 4 μg of CeA / rat). Although RT-PCR is a convenient and quick method to examine mRNA expression, it provides only limited experimental conclusions due to the absence of precise quantification. Because of its sensitivity, however, we can rely on RT-PCR to show the presence or absence of gene expression. Thus, we have found evidence for the presence of mRNAs for c-Fos, Fra-2, FosB, c-Jun, JunB and JunD. Because RT-PCR showed consistent robust expression of c-Fos, Fra-2, c-Jun and JunD mRNA, the products of these AP-1 genes were further examined by in situ hybridization and immunohistochemsitry (for Fra-2).
Fra-1 and ICER were not detected in the amygdala after any treatment. Fra-1 is not constitutively expressed in the adult rat brain, but it can be induced, e.g. by kainic acid in the hippocampus (Pozas et al., 1999). Even then, however, Fra-1 expression appears limited to glial cells and not neurons, and may be expressed as part of a response to brain injury. ICER mRNA in this study was not detected 1 h after LiCl by RT-PCR, although it has previously been observed using in situ hybridization in the CeA (Spencer and Houpt, 2001). However, ICER mRNA is maximally induced 3-6 h after LiCl, and so may have been below the detection threshold of RT-PCR at 1 h.
TH was used as a negative control because TH mRNA is not expressed in the rat amygdala. Variable detection of TH in the CeA may be due to trace amounts of TH mRNA within the fibers of catecholaminergic cells that densely innervate the CeA (Asan, 1998).
3.2 In situ hybridization and immunohistochemistry
The significant increase in c-Fos mRNA in the CeA after LiCl or sucrose/LiCl treatment is consistent with previous studies that have shown induction of c-Fos protein (Wilkins and Bernstein, 2006) and mRNA (Slattery et al., 2005) in the CeA after LiCl. We did not observe an increase in c-Fos mRNA after exposure to sucrose alone, although an increase in c-Fos immunoreactivity has been reported in the CeA after rats drank a novel 0.5% saccharin solution (Koh et al., 2003b). This may reflect a relative insensitivity of in situ hybridization vs. immunohistochemistry, or it may reflect a reduced response to 5% sucrose vs. 0.5% saccharin.
Although Fra-2 mRNA levels were low throughout the amygdala of untreated rats, Fra-2 protein was present constitutively in the CeA and BLA of untreated rats. This contrasts with c-Fos, which has very low basal levels of both mRNA expression and immunoreactivity in the amygdala (Spencer and Houpt, 2001). Similar to the response of c-Fos, we found that Fra-2 mRNA and protein (i.e. immuno-positive cells) were increased by LiCl and sucrose/LiCl in the CeA. In addition, the number of Fra-2 immuno-positive cells in the BLA was also increased after LiCl or sucrose/ LiCl. The effects of LiCl on Fra-2 expression have not been previously reported, although increased Fra-2 expression can be induced in various brain regions by a variety of stimuli (e.g. kainic acid (Beer et al., 1998), morphine (Nye and Nestler, 1996), osmotic stress (Miyata et al., 2001), photic stimulation (Schwartz et al., 2000), capsaicin-induced stress (Honkaniemi et al., 1994) or sleep deprivation (Terao et al., 2003)). The similarity between c-Fos and Fra-2 expression after LiCl needs to be investigated in other brain regions that show LiCl-induced c-Fos expression such as the PBN (Yamamoto et al., 1992) and NTS (Houpt et al., 1994; Swank and Bernstein, 1994; Yamamoto et al., 1992).
Our finding of Fra-2 induction in both CeA and BLA by LiCl is consisent with the involvement of the BLA as well as the CeA in CTA learning. The BLA has long been implicated in CTA learning in lesion, pharmacological, or electrophysiological studies (Sakai and Yamamoto, 1999). c-Fos expression may also occur in the BLA during CTA learning, as we have recently found in mice that the number of c-Fos immuno-positive cells was increased in the BLA 3-6 hours after LiCl injection. Thus the BLA may respond to CTA stimuli, but with a different temporal pattern of immediate early gene expression than the CeA.
3.3 Effect of pre-exposure on Fra-2 and c-Fos expression
Animals learn “safety” to the taste during pre-exposure and this “learned safety” blocks the association between the CS and US during conditioning (Lubow, 1973; Revusky and Bedarf, 1967). Previous experiments demonstrated that pre-exposure to sucrose or saccharin blocked the formation of LiCl-induced CTA learning (Bakner et al., 1991; Koh and Bernstein, 2005; Revusky and Bedarf, 1967; Turgeon and Reichstein, 2002). This behavioral result may be due to changes in gene expression in the brain because rats with pre-exposure to CS taste using bottles showed decreased c-Fos expression in the CeA and BLA during LiCl-induced CTA learning, compared with rats without prior exposure to the CS taste (Koh et al., 2003b; Koh and Bernstein, 2005; Wilkins and Bernstein, 2006).
We investigated another possible change in gene expression between CTA learning and pre-exposed non-CTA learning groups. The novel (CTA learning) group showed an increased number of Fra-2 proteins in the BLA compared with the pre-exposed (non-CTA learning) group. The expression difference in Fra-2 protein in the BLA between the familiar and novel groups provides another correlate of Fra-2 expression with CTA learning. Specifically, the pairing of sucrose and LiCl during CTA learning in the novel group induced LiCl, but under conditions known to retard acquisition of a CTA in the familiar group, Fra-2 expression was decreased.
However, there was no difference in expression of c-Fos-positive cells in the CeA, BLA and LA between the familiar and novel groups in this study. This result conflicts with an earlier study (Wilkins and Bernstein, 2006) which showed that pre-exposure to saccharin using intraoral infusions reduced c-Fos expression in the CeA during LiCl-induced CTA learning. This discrepancy may result from differences in experimental methods. Compared to the current study, Wilkins et al. used a lower dose of LiCl (5 vs. 12 ml/kg, 0.15 M LiCl) and higher intensity of CS (0.5% saccharin vs. 5% sucrose). The higher dose of LiCl may cause more cellular activation (c-Fos expression) in the amygdala that masks a pre-exposure effect; however, under our conditions, the higher dose of LiCl is required to achieve long-term consolidation against 5% sucrose (Houpt and Berlin, 1999).
It is possible that any additive effects of sucrose and LiCl, or the effects of sucrose pre-exposure, on Fra-2 and c-Fos expression could have been masked by a ceiling effect if the relatively high dose of LiCl alone had induced a maximal response in the amygdala. In this and previous studies we have typically used 1.8 mEq/kg LiCl, as this is the minimal dose that reliably induces a maximal CTA. Dose response curves for LiCl induction of CTA, as measured in single-bottle tests, have shown that long-term CTA is acquired after sucrose or saccharin is paired with as little as 0.3 - 0.6 mEq/kg LiCl; a maximal CTA is achieved with 1.2-1.8 mEq/kg LiCl (Nachman and Ashe, 1973; Sakai and Yamamoto, 1997).
We and others have also found, however, that CTA induced and measured by intraoral infusions requires higher doses of LiCl than bottle-mediated CTA (Houpt and Berlin, 1999; Wolgin and Wade, 1990). Thus, a single dose of 0.9 mEq/kg LiCl is not sufficient to induce a long-term intraoral CTA (Houpt and Berlin, 1999), while a single dose of 1.5 or 1.8 mEq/kg is sufficient for long-term intraoral CTA acquisition (Houpt and Berlin, 1999; Wolgin and Wade, 1990). (This distinction between bottle and intraoral CTA is particularly relevant for the amygdala, because lesions of the amygdala block intraoral CTA acquisition but not bottle-mediated CTA acquisition (Schafe et al., 1998)(Schafe)). Because the CS was administered in this study by intraoral infusion, we employed the higher dose of LiCl. Nonetheless, it is possible and likely that a lower dose of LiCl, e.g. after repeated pairings, could induce a long-term CTA via lower levels of gene expression.
There have been few published dose-response studies for acute systemic LiCl effects on gene expression. ICER mRNA is dose-dependently induced in the adrenal cortex by LiCl, in proportion to the LiCl-induced secretion of corticosterone, with maximal induction after 0.9 and 1.8 mEq/kg (Spencer et al., 2005). c-Fos immunoreactivity is induced in the AP, NTS, and PBN dose-dependently by LiCl; the number of c-Fos-positive cells induced in these areas by a variety of treatments is significantly correlated with the magnitude of acquired CTAs (Sakai and Yamamoto, 1997). Importantly, the dose employed in the current study (1.8 mEq/kg) was not the maximally effective dose reported to induce c-Fos in the brainstem (2.4 and 3.0 mEq/kg; (Sakai and Yamamoto, 1997). Thus, it is possible that the induction of c-Fos and Fra2 in the amygdala is also not maximal after 1.8 mEq/kg. The dose-response function for LiCl and immediate early gene expression in the forebrain remains to be empirically established, however.
3.4 Regulation of c-Fos and Fra-2
The parallel increases in Fra-2 and c-Fos in the amygdala after LiCl administration might be due to common regulatory sites and intracellular pathways. For example, many of the enhancers in the c-Fos promoter, such as the CRE, SRE, SCM and TATA box sequences, are also located in the Fra-2 promoter (Yoshida et al., 1993). Among these enhancers, the CRE site is critical for c-Fos expression. The putative molecular cascade of LiCl-induced c-Fos expression involves activation of protein kinases by increased cAMP or intracellular Ca2+, the subsequent phosphorylation of CREB, and the binding of phosphorylated CREB to the CRE site. The Fra-2 promoter also has a CRE site in its enhancer region, and it has been reported that Fra-2 mRNA can be induced in vitro by cAMP and Ca2+ (Yoshida et al., 1993). Thus, the cAMP/Ca2+/CREB pathway might induce both Fra-2 and c-Fos expression.
However, we also observed intra-amygdalar differences after LiCl or sucrose/LiCl treatment in c-Fos expression (in CeA only) vs. Fra-2 expression (in both CeA and BLA). Others have reported tissue specific differences in c-Fos and Fra-2 expression and induction. In the supraoptic nucleus, for example, Fras (Fra-1 and Fra-2) immunoreactivity is constitutively expressed at high background levels, but increased Fras and c-Fos are both induced by osmotic stimulation (Miyata et al., 2001). In the rat locus coeruleus, c-Fos (but not Fra-2) is induced by acute immobilization stress, but after repeated immobilization both c-Fos and Fra-2 are present (Hebert et al., 2005). Presumably these differences are due to tissue- or stimulus-specific engagement of signaling pathways, transcription factors, or epigenetic mechanisms that have distinct effects on the expression of c-Fos vs. Fra-2.
In the present study, we found constitutively high levels of Fra-2 immuno-positive cells in the CeA and BLA. The higher baseline levels of Fra-2 might be due to the long-term accumulation of the protein, given the extended lifespan of Fra-2 vs c-Fos mRNA (5 h vs 2 h; (Greenberg and Ziff, 1984; Muller et al., 1984; Yoshida et al., 1991)) and Fras vs c-Fos immunoreactivity (8 h vs 2 h; (Miyata et al., 2001)). High levels of Fra-2 protein per se may not reflect Fra-2 activity, however, because Fra-2 is also regulated by post-translational phosphorylation (Murakami et al., 1997; Yoshida et al., 1991). Unlike c-Fos, Fra-2 must be phosphorylated in order to bind to AP-1 enhancer sites and induce gene transcription (e.g., induction of Fra-2 itself; (Murakami et al., 1999)). Thus, phosphorylation of Fra-2 by protein kinase activity induced by LiCl may be crucial to its transcriptional function with other AP-1 family members in the amygdala.
Although in this study FosB, c-Jun, JunB and JunD mRNAs were detected by RT-PCR in the amygdala, there were no specific changes among treatment groups and their expression patterns were irregular. It has previously been reported in the CeA of the mouse that FosB was constitutively expressed, while JunB immunoreactivity was increased by LiCl injection (Swank, 1999). The presence of constitutive Jun family expression and induced Fos family expression would satisfy the requirement that Fos and Jun proteins dimerize to regulate transcription.
3.5 Role in CTA Learning
This study demonstated that c-Jun and JunD are constitutively expressed in the amygdala, while Fra-2 and c-Fos expression is correlated with LiCl injection both as an unconditioned response (LiCl group) and during CTA learning (sucrose/LiCl group). This is consistent with a role for Fra-2 in the response to LiCl, but does not confirm a specific or functional involvement in CTA learning. Even though their expression is not exclusive to the pairing of taste and toxin, however, Fra-2, c-Jun, and JunD may still serve a functional role during CTA learning, as shown for c-Fos using transgenic and molecular knockdown approaches.
The specific genomic response to contingent taste and toxin stimuli underlying CTA consolidation may include not only a) the expression of a set of genes specific and exclusive to contingent stimulation, but also b) the combined expression of taste-stimulated genes and toxin-stimulated genes. Both types of responses would generate a profile different from the unconditioned responses and specific to CTA learning. Genes induced specifically by gustatory stimulation have not been identified. Fra-2 and c-Fos may represent toxin-stimulated genes, albeit modulated by taste experience.
3.5 Summary
In conclusion, using LCM technology with RT-PCR, we profiled mRNA expression of a number of AP-1 genes in small discrete regions of the amygdala during CTA learning. In situ hybridization and immunohistochemistry were then employed to confirm changes in expression of some AP-1 genes. The results revealed that LiCl and sucrose/LiCl induced Fra-2 as well as c-Fos in the amygdala. This confirmed activation of AP-1 immediate early genes within the CeA. Importantly, we also found that Fra-2 mRNA and protein expression can serve as a marker of cellular activation within the BLA during CTA learning. Pre-exposure to sucrose, which would decrease subsequent CTA learning, decreased Fra-2 expression in the BLA induced by sucrose/LiCl; this correlation specific to taste experience suggests that Fra-2 in the BLA plays a specific role in CTA learning. Although other AP-1 genes were detected within amygdalar subnuclei (FosB, cJun and JunD), no changes in expression were found after sucrose or LiCl treatment. The presence of both Fos and Jun family members, however, is critical for transcriptional regulation. It remains to be determined if the differences in AP-1 gene expression between LiCl and sucrose/LiCl pairing contribute to consolidation of CTA learning and memory.
4. Experimental Procedure
4.1 Animals
Adult male Sprague-Dawley rats (Charles River Laboratories, Wilmington, MA) were individually housed under a 12-h light –12-h dark cycle (lights on 07:00) at 25 °C with free access to Purina rodent chow and distilled water. Rats weighed an average of 396 ± 10 g; by ANOVA, there was no difference in body weight between groups in any of the experiments. Rats were not food- or water-deprived during the experiments. To minimize handling stress on the day of sucrose infusion and LiCl injection, rats were handled daily for 5-7 days prior to treatments. All procedures were conducted in the first half of the lights-on period. Anesthesia (halothane, sodium pentobarbital) was used to minimize pain and discomfort, and all experiments were approved by the Florida State University institutional animal care and use committee.
4.2 Intraoral catheterization and infusions
Under halothane anesthesia, all rats were implanted with intraoral catheters made of PE-90 tubing that entered the mouth through the lateral cheek and were externalized on the dorsal surface between the scapulae, as described previously (Eckel and Ossenkopp, 1994). Intraoral catheters were flushed daily with water to maintain patency. For intraoral infusions, rats were weighed and placed in a glass aquarium subdivided into 4 individual compartments by Plexiglas sheets. Syringe pumps infused 5% sucrose dissolved in distilled water into the mouth at a rate of 1 ml/min over 6 min. After the infusion, rats and any feces were weighed again as a measure of consumption, and rats were returned to their home cages. Although all rats were implanted with intraoral catheters, only rats in the sucrose and sucrose/LiCl groups received intraoral infusions. In each experiment, intakes of sucrose were compared between the sucrose and sucrose/LiCl groups by t-test.
4.3 Treatment Groups
In experiments 1-3 below, rats were divided into four different groups (sucrose, LiCl, sucrose/LiCl and no treatment). On the experimental day, rats in the sucrose group received an intraoral infusion of 5% sucrose at the rate of 1 ml/min for 6 min. Rats in the LiCl group were injected with LiCl (i.p., 0.15 M, 12 ml/kg). Rats in the sucrose/LiCl paired group received an intraoral infusion of 5% sucrose at the rate of 1 ml/min for 6 min and then were immediately injected with LiCl (i.p., 0.15 M, 12 ml/kg). Rats in the sucrose and no treatment groups did not receive any injections, and rats in the LiCl and no treatment groups did not receive an intraoral infusion of sucrose. Thus we examined rats after presentation of the CS alone (sucrose group), after the US alone (LiCl group), and after the pairing of US and CS (sucrose/LiCl); our laboratory has previously shown that this pairing of sucrose and LiCl induces a long-term CTA (Houpt et al., 1994; Houpt and Berlin, 1999).
4.3 Experiment 1. Laser capture microdissection
4.3.1 Tissue Collection
One hour after the four treatments described above (n = 3-5 per group), rats were anesthetized with sodium pentobarbital (104 mg/0.4 ml), decapitated, and the brains dissected. The brains were emmersed in M-1 Embedding Matrix (Shandon, Pittsburgh, PA), frozen with dry ice, and stored in a −80 °C freezer until used.
The frozen brains were sectioned between -2.30 and -3.14 mm from bregma (Paxinos and Watson, 1986) at 5 μm thickness and mounted on slides in a −20 °C cryostat using the CryoJane system (Instrumedics, Hackensack, NJ). The frozen brain sections were defrosted at room temperature for 30 sec, then stained and dehydrated by the following procedure: 75% ethanol for 30 sec, DEPC-treated deionized H2O (DEPC-dH2O) for 30 sec, Histogene Staining solution (Arcturus, Mountain View, CA) for 3 min, DEPC-dH2O for 30 sec, 75% ethanol for 30 sec, 95% ethanol for 30 sec, 100% ethanol for 30 sec, xylene for 5 min, air dried in a fume hood for 15 min, and then desiccated with Drierite (W.A. Hammond Drierite, Xenia, OH) for 1 h.
LCM parameters were 15 or 30 μm diameter laser spot, a 10 ms laser pulse duration, and a 65 mW laser power. Multiple laser shots (150-200) were required to transfer each amygdala region. Following dissection, tissue sections were stained with methyl green (Vector Laboratories, Burlingame, CA) and coverslipped to verify the specificity of the dissection.
4.3.2 RNA extraction and RT-PCR
Total RNA was extracted from individual LCM samples with the Total RNA Microprep Kit (Stratagene, La Jolla, CA) according to the manufacturer’s protocols. RT-PCR was performed by using the OneStep RT-PCR Kit (Qiagen, Valencia, CA). Ten primer pairs were used targeting the seven AP-1 family transcription factors, with ICER, TH, and β-actin as controls (see Table 1). For each RT-PCR reaction, 3.3 μl out of 40 μl of the total RNA extract from each LCM sample was mixed with 4 μl of 5X buffer, 4 μl of 5X Q-solution, 0.8 μl of 10 mM dNTP mix, 0.4 μl of RNase Inhibitor, 0.8 μl of 10 μM sense primer, 0.8 μl of 10 μM antisense primer, and 0.8 μl of enzyme mix; reactions were brought to 20 μl with RNase-free H2O. The RT reaction was performed at 50°C for 30 min first, and then PCR was started with an incubation at 95°C for 15 min. The PCR for all primer pairs was performed with 40 cycles of 94°C for 30 s, 55°C for 30 s and 72°C for 60 s, ending with a final incubation at 72°C for 5 min. 10 μl out of 20 μl of total reaction volume was loaded in a 1.6% agarose gel; RT-PCR products were visualized with SYBR green (Invitrogen, Carlsbad, CA).
Table 1.
Primer sequences for RT-PCR
| Genes | Primer sequences | Product size (bp) |
|---|---|---|
| c-fos | S 5’-GGAGCTGACAGATACGCTCCA-3’ AS 5’-GCTAATGTTCTTGACCGGCTC-3’ |
304 |
| fosB | S 5’-TTGAAGAGGAAAAGGCAGAGC-3’ AS 5’-AGCAAGAAGGGAGGGCGAGTT-3’ |
433 FosB 304 dFosB |
| Fra1 | S 5’-AGAGCTGCAGAAGCAGAAGG-3’ AS 5’-AGGAGCCTACAGGGTGTCCT-3’ |
800 |
| Fra2 | S 5’-AAGTGTCGGAACCGTCGACGTGAG-3’ AS 5’-TTCAAGGAGTCTGATGACTGGTCC-3’ |
539 |
| c-Jun | S 5’-TAGATTGCGGATGAACTCCC-3’ AS 5’-CAACACCCTCTTCTTCCAGC-3’ |
513 |
| JunB | S 5’-TGAAACCCACCTTAGCGCTCAACC-3’ AS 5’-AGACACGTTGGGGGGCGTCACGTG-3’ |
362 |
| JunD | S 5’-CGACCAGTACGCAGTTCCTC-3’ AS 5’-CGTTCTTGCGTGTCCATGTC-3’ |
433 |
| ICER | S 5’-GGCCAACAAGACCACTCTGTATGC-3’ AS 5’-TCTACTAATCTGTTTTGGGAGAGC-3’ |
378 |
| TH | S 5’-TGTCACGTCCCCAAGGTTCAT-3’ AS 5’-GGGCAGGCCGGGTCTCTAAGT-3’ |
274 |
| β-actin | S 5’-TTGTAACCAACTGGGACGATATGG-3’ AS 5’-GATCTTGATCTTCATGGTGCTAGG-3’ |
740 |
S, sense; AS, antisense.
4.4 Experiment 2. In Situ Hybridization
4.4.1 RNA probe synthesis
Amplified cDNAs were purified from RT-PCR reactions as above, and inserted into pCRII-TOPO cloning vectors (Invitrogen, Carlsbad, CA). Plasmids were sequenced by the FSU Sequencing Core to confirm the specificity of RT-PCR and determine the orientation of the cDNA within the vector. Linearized plasmid (1 μg) was used as the template to make 35S-UTP-labeled antisense RNA probes by in vitro transcription (MAXIscript kit, Ambion, Austin, TX). The template was mixed with 2 μl of 10x transcription buffer, 1 μl of ATP, CTP, and GTP (each 10 mM), 5 μl of 35S-labeled UTP (20 mci/ml) (Amersham, UK) 2 μl of T7 or SP6 RNA polymerase, and 1 ug of cDNA templates, and brought to 20 μl with RNase-free H2O. The mixture was incubated at 37 °C for 45 min, with 1 μl of DNase I added at 30 min. The reaction was stopped with 1 μl of 0.5 M EDTA, and the RNA probes purified by ProbeQuant™ G-50 Microcolumns (Amersham, Piscataway, NJ).
4.4.2 Tissue collection and hybridization
One hour after the four different treatments (n=6 in each group), rats were anesthetized with sodium pentobarbital (104 mg/0.4 ml) and perfused first with 100 ml of isotonic saline containing 0.5% sodium azide and 1000 U heparin, and then with 400 ml phosphate-buffered 4% paraformaldehyde. The brains were removed and post-fixed for 1 hour, then cyroprotected in 30% sucrose solutions for 1-2 days. The brains were cut at 40 μm on a -20°C microtome and transferred into 20-ml glass scintillation vials containing 2x saline sodium citrate (SSC, 0.15 M NaCl-0.015 M sodium citrate) buffer. Free-floating sections were prehybridized at 55°C for 2-3 h in 1 ml per vial of 50% formamide, 2x SSC, 10% dextran sulfate, 0.7% Ficoll, 0.7% polyvinylpyrrolidone, 0.7% bovine serum albumin (BSA), 85 mM dithiothreitol (DTT) and 1.4 mg/ml of yeast transfer RNA. Sections were then hybridized at 55°C for 18 h with heat-denatured 35S-labeled antisense RNA probes (0.5 to1.5×107 cpm per 1 ml buffer per vial). Following hybridization with RNA probes, sections were washed sequentially in 2×SSC, 2×SSC, 1×SSC, 0.5×SSC, 0.25×SSC, 0.125×SSC, 0.125×SSC at 55°C for 15 min each. After the final washing in 0.125×SSC, sections were transferred into 1 ml of 0.1 M sodium phosphate buffer (PB). To decrease nonspecific binding of probes, 50 ug of RNase A was added and incubated at 37°C for 30 min. Sections were washed in 0.1 M PB at RT for 5 min, mounted on gelatin-coated slides, and RNase A treatment performed again. Slides were soaked at 37°C for 30 min in RNase buffer (8 mM Tris-HCl, 0.4 M NaCl, 0.8 M EDTA) with 30 ug/ml RNase A, and then blocked at 37°C for 30 min in RNase buffer with 1 mM DTT. Slides were washed sequentially in 2×SSC containing 50% formamide and 0.1% β-mercaptoethanol at 53°C for 15 min, 0.1×SSC containing 1% β-mercaptoethanol at 53°C for 30 min, 50% ethanol / 0.3 M ammonium acetate at 25°C for 3 min, 85% ethanol / 0.3 M ammonium acetate at 25°C for 3 min, 100% ethanol at 25°C for 3 min. The slides were apposed to Biomax MR film (Kodak, Rochester, NY) for 4-12 days (c-Fos), 5-10 days (Fra-2), 1-2 days (JunD) and 1-2 days (c-Jun).
4.5 Experiment 3. Fra-2 Immunohistochemistry
One hour after the 4 different treatments, rats (n=6 each group) were overdosed with sodium pentobarbital (104 mg/0.4 ml) and perfused with 4% paraformaldehyde as above. To assess the specificity of LiCl injections, two additional unoperated groups (n = 4 /group) were included: rats injected with 0.15 M NaCl (12 ml/kg), and rats injected with 0.15 M LiCl (12 ml/kg).
Brains were dissected, post-fixed for 1 h, then cyroprotected in 30% sucrose for 1-2 days. Brain sections were cut at 40 μM on a freezing microtome, and washed twice in 0.1 M sodium phosphate-saline (PBS) for 15 min, then permeabilized in 0.2% Triton-1% BSA-PBS for 30 min. After PBS-BSA washes, the sections were incubated overnight at 25°C with a Fra-2 polyclonal antibody (Q-20, Santa Cruz Biotechnology, Santa Cruz, CA) at a dilution of 1:1,000. Sections were washed in PBS-BSA for 15 min, and incubated for 1 h with a biotinylated goat anti-rabbit antibody (Vector Laboratories) at a dilution of 1:200. Antibody complexes were amplified using the Vectastain ABC Elite kit (Vector Laboratories), and visualized by a 5-min reaction in 0.05% 3,3-diaminobenzidine tetrahydrochloride. Sections were immediately washed twice in 0.1 M sodium phosphate and mounted on gelatin-coated slides. Slides were counterstained with methyl green and coverslipped with Permount.
4.6 Experiment 4. Effect of sucrose pre-exposure on Fra-2 and c-Fos expression during CTA learning
Rats were implanted with intraoral catheters and divided into two different groups (familiar and novel groups, n=6 each group). After recovery from the surgery, familiar and novel groups received 5% sucrose and water respectively for 6 min (1 ml/min) by intraoral infusions. The pre-exposure was performed once a day for 6 days. On the seventh day, all rats were infused with 5% sucrose and then LiCl (i.p., 0.15 M, 12 ml/kg) was immediately injected. One hour after LiCl injections, rats were perfused with 4% paraformaldehyde and their brains were dissected out. Immunohistochemistry for Fra-2 and c-Fos (Ab-5, 1:20,000, Oncogene Research, San Diego, CA) was performed as described above.
4.7 Quantification and statistical analysis
For the RT-PCR results, band density was measured from the gels using the Gel Logic 100 system (Kodak, Rochester, NY). To normalize the numbers of band density, each band density was compared with the density of the β-actin band. For the immunohistochemistry, cells expressing darkly-positive, nuclear Fra-2 staining were quantified with custom software (MindsEye, T. Houpt). Regions were digitally-captured at 40x magnification on a Macintosh computer using an Olympus Provis AX-70 microscope with a Dage-MTI DC-330 CCD camera and Scion LG-3 framegrabber. Counting was restricted to the BLA, CeA, or LA as delineated by a hand-drawn outline. Bilateral cell counts were averaged for 6 sections of the amygdala for each rat. The individual mean counts for each region were then averaged across rats within experimental groups. For in situ hybridization results, pixel density within the BLA, CeA, and LA was quantified after digitizing the autoradiographic films through a Zeiss Stemi-2000 stereoscope attached to a Dage-MTI CCD 72 camera. Light levels provided by a fiber optic light table (Fostec) were adjusted to standardize gray levels of film background. For each rat and probe, average pixel densities were obtained from delineated areas of 3-5 brain sections. Individual mean values for each region were then averaged across rats within experimental groups.
Significant effects across treatment groups were detected by one-way ANOVA and Neuman-Keuls post-hoc tests (Kaleidagraph, Synergy Software). Results of post-hoc tests are reported in the figures. All data are presented as the mean ± standard error of the mean.
Acknowledgments
This work was supported by National Institute on Deafness and other Communication Disorders grant R01DC03198 (TAH) and a research grant from the B.W. Robinson Memorial Endowment for the Neurosciences (BSK). We thank Stephanie McCormack for technical assistance and Dr. Frank Johnson for access to the PixCell II system.
Abbreviations
- AP-1
activator protein 1
- ATP
adenosine triphosphate
- BLA
basolateral amygdala
- BSA
bovine serum albumin
- cAMP
cyclic adenosine monophosphate
- CeA
central nucleus of the amygdala
- CRE
cAMP response element
- CREB
cAMP response element binding protein
- CS
conditioned stimulus
- CTA
conditioned taste aversion
- CTP
cytosine triphosphate
- DEPC
diethylpyrocarbonate
- DTT
dithiothreitol
- EDTA
ethylenediaminetetraacetic acid
- GTP
guanine triphosphate
- ICER
inducible cAMP response element repressor
- LA
lateral amygdala
- LCM
laser capture microdissection
- LiCl
lithium chloride
- NTS
nucleus of the solitary tract
- PB
phosphate buffer
- PBN
parabrachial nucleus
- PBS
phosphate-buffered saline
- PKA
protein kinase A
- SCM
sis-conditioned medium
- SON
supraoptic nucleus
- SRE
serum response element
- SSC
sodium chloride-sodium citrate buffer
- TH
tyrosine hydroxylase
- US
unconditioned stimulus
- UTP
uracil triphosphate
Footnotes
Publisher's Disclaimer: This is a PDF file of an unedited manuscript that has been accepted for publication. As a service to our customers we are providing this early version of the manuscript. The manuscript will undergo copyediting, typesetting, and review of the resulting proof before it is published in its final citable form. Please note that during the production process errors may be discovered which could affect the content, and all legal disclaimers that apply to the journal pertain.
References
- Asan E. The catecholaminergic innervation of the rat amygdala. Adv Anat Embryol Cell Biol. 1998;142:1–118. doi: 10.1007/978-3-642-72085-7. [DOI] [PubMed] [Google Scholar]
- Bakner L, Strohen K, Nordeen M, Riccio DC. Postconditioning recovery from the latent inhibition effect in conditioned taste aversion. Physiol Behav. 1991;50:126–72. doi: 10.1016/0031-9384(91)90595-f. [DOI] [PubMed] [Google Scholar]
- Beer J, Mielke K, Zipp M, Zimmermann M, Herdegen T. Expression of c-jun, junB, c-fos, fra-1 and fra-2 mRNA in the rat brain following seizure activity and axotomy. Brain Res. 1998;794:255–66. doi: 10.1016/s0006-8993(98)00233-9. [DOI] [PubMed] [Google Scholar]
- Bonner RF, Emmert-Buck M, Cole K, Pohida TCR, Goldstein S, Liotta LA. Laser capture microdissection: molecular analysis of tissue. Science. 1997;278:1481–1483. doi: 10.1126/science.278.5342.1481. [DOI] [PubMed] [Google Scholar]
- Bravo R, Neuberg M, Burckhardt J, Almendral J, Wallich R, Müller R. Involvement of common and cell type-specific pathways in c-fos gene control: stable induction of cAMP in macrophages. Cell. 1987;48:251–60. doi: 10.1016/0092-8674(87)90428-4. [DOI] [PubMed] [Google Scholar]
- Chiu R, Boyle WJ, Meek J, Smeal T, Hunter T, Karin M. The c-Fos protein interacts with c-Jun/AP-1 to stimulate transcription of AP-1 responsive genes. Cell. 1988;54:541–2. doi: 10.1016/0092-8674(88)90076-1. [DOI] [PubMed] [Google Scholar]
- Fisch TM, Prywes R, Simon MC, Roeder RG. Multiple sequence elements in the c-fos promoter mediate induction by cAMP. Genes Dev. 1989;3:198–211. doi: 10.1101/gad.3.2.198. [DOI] [PubMed] [Google Scholar]
- Foletta VC. Transcription factor AP-1 and the role of Fra-2. Immunol Cell Bio. 1996;74:121–133. doi: 10.1038/icb.1996.17. [DOI] [PubMed] [Google Scholar]
- Gallagher M, Chiba AA. The amygdala and emotion. Curr Opinion Neurobiol. 1996;6:221–227. doi: 10.1016/s0959-4388(96)80076-6. [DOI] [PubMed] [Google Scholar]
- Garcia J, Hankins WG, Rusiniak KW. Behavioral regulation of the milieu interne in man and rat. Science. 1974;185:824–831. doi: 10.1126/science.185.4154.824. [DOI] [PubMed] [Google Scholar]
- Greenberg ME, Ziff EB. Stimulation of 3T3 cells induces transcription of the c-fos proto-oncogene. Nature. 1984;311:433–8. doi: 10.1038/311433a0. [DOI] [PubMed] [Google Scholar]
- Hebert MA, Serova LI, Sabban EL. Single and repeated immobilization stress differentially trigger induction and phosphorylation of several transcription factors and mitogen-activated protein kinases in the rat locus coeruleus. J Neurochem. 2005;95:484–98. doi: 10.1111/j.1471-4159.2005.03386.x. [DOI] [PubMed] [Google Scholar]
- Honkaniemi J, Kononen J, Kainu T, Pyykonen I, Pelto-Huikko M. Induction of multiple immediate early genes in rat hypothalamic paraventricular nucleus after stress. Brain Res Mol Brain Res. 1994;25:234–41. doi: 10.1016/0169-328x(94)90158-9. [DOI] [PubMed] [Google Scholar]
- Houpt TA, Philopena JM, Wessel TC, Joh TH, Smith GP. Increased c-Fos expression in the rat nucleus of the solitary tract after conditioned taste aversion formation. Neurosci Lett. 1994;172:1–5. doi: 10.1016/0304-3940(94)90648-3. [DOI] [PubMed] [Google Scholar]
- Houpt TA, Berlin RA. Rapid, labile and protein-synthesis-independent short-term memory in conditioned taste aversion. Learning and Memory. 1999;6:37–46. [PMC free article] [PubMed] [Google Scholar]
- Karin M, Liu Z-G, Zandi E. AP-1 function and regulation. Curr Opinion Cell Bio. 1997;9:240–246. doi: 10.1016/s0955-0674(97)80068-3. [DOI] [PubMed] [Google Scholar]
- Koh MT, Thiele TE, Bernstein IL. Inhibition of protein kinase A activity interferes with long-term, but not short-term, memory of conditioned taste aversions. Behav Neurosci. 2002;116:1070–1074. [PubMed] [Google Scholar]
- Koh MT, Clarke SN, Spray KJ, Thiele TE, Bernstein IL. Conditioned taste aversion memory and c-Fos induction are disrupted in RIIbeta-protein kinase A mutant mice. Behav Brain Res. 2003a;143:57–63. doi: 10.1016/s0166-4328(03)00024-x. [DOI] [PubMed] [Google Scholar]
- Koh MT, Wilkins EE, Bernstein IL. Novel tastes elevate c-fos expression in the central amygdala and insular cortex: implication for taste aversion learning. Behav Neurosci. 2003b;117:1416–1422. doi: 10.1037/0735-7044.117.6.1416. [DOI] [PubMed] [Google Scholar]
- Koh MT, Bernstein IL. Mapping conditioned taste aversion associations using c-Fos reveals a dynamic role for insular cortex. Behav Neurosci. 2005;119:399–98. doi: 10.1037/0735-7044.119.2.388. [DOI] [PubMed] [Google Scholar]
- Kruijer W, Schubert D, Verma IM. Induction of the proto-oncogene fos by nerve growth factor. Proc Nat l Acad Sci USA. 1985;82:7330–4. doi: 10.1073/pnas.82.21.7330. [DOI] [PMC free article] [PubMed] [Google Scholar]
- Lamprecht R, Dudai Y. Transient expression of c-Fos in rat amygdala during training is required for encoding conditioned taste aversion memory. Learning and Memory. 1996;3:31–41. doi: 10.1101/lm.3.1.31. [DOI] [PubMed] [Google Scholar]
- Lamprecht R, Hazvi S, Dudai Y. cAMP response element-binding protein in the amygdala is required for long- but not short-term conditioned taste aversion memory. J Neurosci. 1997;17:8443–50. doi: 10.1523/JNEUROSCI.17-21-08443.1997. [DOI] [PMC free article] [PubMed] [Google Scholar]
- Lasiter PS, Glanzman DL. Cortical substrates of taste aversion learning: involvement of dorsolateral amygdaloid nuclei and temporal neocortex in taste aversion learning. Behav Neurosci. 1985;99:257–276. doi: 10.1037//0735-7044.99.2.257. [DOI] [PubMed] [Google Scholar]
- LeDoux JE. Emotional memory systems in the brain. Behav Brain Res. 1993;58:69–79. doi: 10.1016/0166-4328(93)90091-4. [DOI] [PubMed] [Google Scholar]
- Lubow RE. Latent inhibition. Psychol Bull. 1973;79:398–407. doi: 10.1037/h0034425. [DOI] [PubMed] [Google Scholar]
- Mickley GA, Kenmuir CL, McMullen CA, Yocom AM, Valentine EL, Dengler-Crish CM, Weber B, Wellman JA, Remmers-Roeber DR. Dynamic processing of taste aversion extinction in the brain. Brain Res. 2004;1016:79–89. doi: 10.1016/j.brainres.2004.04.071. [DOI] [PubMed] [Google Scholar]
- Miyata S, Tsujioka H, Itoh M, Matsunaga W, Kuramoto H, Kiyohara T. Time course of Fos and Fras expression in the hypothalamic supraoptic neurons during chronic osmotic stimulation. Brain Res Mol Brain Res. 2001;90:39–47. doi: 10.1016/s0169-328x(01)00072-9. [DOI] [PubMed] [Google Scholar]
- Muller R, Bravo R, Burckhardt J, Curran T. Induction of c-fos gene and protein by growth factors precedes activation of c-myc. Nature. 1984;312:716–20. doi: 10.1038/312716a0. [DOI] [PubMed] [Google Scholar]
- Murakami M, Sonobe MH, Ui M, Kabuyama Y, Watanabe H, Wada T, Handa H, Iba H. Phosphorylation and high level expression of Fra-2 in v-src transformed cells: a pathway of activation of endogenous AP-1. Oncogene. 1997;14:2435–44. doi: 10.1038/sj.onc.1201077. [DOI] [PubMed] [Google Scholar]
- Murakami M, Ui M, Iba H. Fra-2-positive autoregulatory loop triggered by mitogen-activated protein kinase (MAPK) and Fra-2 phosphorylation sites by MAPK. Cell Growth Differ. 1999;10:333–42. [PubMed] [Google Scholar]
- Nachman M, Ashe JH. Learned taste aversions in rats as a function of dosage, concentration, and route of administration of LiCl. Physiol Behav. 1973;10:73–78. doi: 10.1016/0031-9384(73)90089-9. [DOI] [PubMed] [Google Scholar]
- Nye HE, Nestler EJ. Induction of chronic Fos-related antigens in rat brain by chronic morphine administration. Mol Pharmacol. 1996;49:636–45. [PubMed] [Google Scholar]
- Paxinos G, Watson C. The rat brain in stereotaxic coordinates. Academic Press; San Diego: 1986. [DOI] [PubMed] [Google Scholar]
- Pozas E, Aguado F, F I. Fra-1 immunoreactivity in the rat brain during normal postnatal development and after injury in adulthood. Neurosci Res. 1999;33:137–145. doi: 10.1016/s0168-0102(98)00123-0. [DOI] [PubMed] [Google Scholar]
- Rauscher FJ, Voulalas PJ, Franza BR, Curran T. Fos and Jun bind cooperatively to the AP-1 site: reconstitution in vitro. Genes Dev. 1988;2:1687–99. doi: 10.1101/gad.2.12b.1687. [DOI] [PubMed] [Google Scholar]
- Revusky SH, Bedarf EW. Association of illness with prior ingestion of novel foods. Science. 1967;155:219–20. doi: 10.1126/science.155.3759.219. [DOI] [PubMed] [Google Scholar]
- Roldan G, Bures J. Tetrodotoxin blockade of amygdala overlapping with poisoning impairs acquisition of conditioned taste aversion in rats. Behav Brain Res. 1994;65:213–219. doi: 10.1016/0166-4328(94)90107-4. [DOI] [PubMed] [Google Scholar]
- Sakai N, Yamamoto T. Conditioned taste aversion and c-fos expression in the rat brainstem after administration of various USs. Neuroreport. 1997;8:2215–2220. doi: 10.1097/00001756-199707070-00025. [DOI] [PubMed] [Google Scholar]
- Sakai N, Yamamoto T. Possible routes of visceral information in the rat brain in formation of conditioned taste aversion. Neurosci Res. 1999;35:53–61. doi: 10.1016/s0168-0102(99)00067-x. [DOI] [PubMed] [Google Scholar]
- Sassone-Corsi P, Visvader J, Ferland L, Mellon PL, Verma IM. Induction of proto-oncogene fos transcription through the adenylate cyclase pathway: characterization of a cAMP-responsive element. Genes Dev. 1988;2:1529–38. doi: 10.1101/gad.2.12a.1529. [DOI] [PubMed] [Google Scholar]
- Schafe GE, Bernstein IL. Forebrain contribution to the induction of a brainstem correlate of conditioned taste aversion: I. The amygdala Brain Res. 1996;741:109–116. doi: 10.1016/s0006-8993(96)00906-7. [DOI] [PubMed] [Google Scholar]
- Schafe GE, Thiele TE, Bernstein IL. Conditioning method dramatically alters the role of amygdala in taste aversion learning. Learning and Memory. 1998;5:481–492. [PMC free article] [PubMed] [Google Scholar]
- Schutze K, Lahr G. Identification of expressed genes by laser-mediated manipulation of single cells. Nat Biotechnol. 1998;16:737–742. doi: 10.1038/nbt0898-737. [DOI] [PubMed] [Google Scholar]
- Schwartz WJ, Carpino A, Jr, de la Iglesia HO, Baler R, Klein DC, Nakabeppu Y, Aronin N. Differential regulation of fos family genes in the ventrolateral and dorsomedial subdivisions of the rat suprachiasmatic nucleus. Neuroscience. 2000;98:535–47. doi: 10.1016/s0306-4522(00)00140-8. [DOI] [PubMed] [Google Scholar]
- Slattery DA, Morrow JA, Hudson AL, Hill DR, Nutt DJ, Henry B. Comparison of alterations in c-fos and Egr-1 (zif268) expression throughout the rat brain following acute administration of different classes of antidepressant compounds. Neuropyschopharmacol. 2005;30:1278–1287. doi: 10.1038/sj.npp.1300717. [DOI] [PubMed] [Google Scholar]
- Spencer CM, Houpt TA. Dynamics of c-Fos and ICER mRNA expression in rat forebrain following lithium chloride injection. Molec Brain Res. 2001;93:113–126. doi: 10.1016/s0169-328x(01)00173-5. [DOI] [PubMed] [Google Scholar]
- Spencer CM, Jahng JW, Ryu V, Houpt TA. Lithium-induced gene expression of inducible cyclic adenosine monophosphate early repressor in the rat adrenal gland. J Neurosci Res. 2005;82:273–82. doi: 10.1002/jnr.20617. [DOI] [PubMed] [Google Scholar]
- Swank MW, Bernstein IL. c-Fos induction in response to a conditioned stimulus after single trial taste aversion learning. Brain Res. 1994;636:202–208. doi: 10.1016/0006-8993(94)91018-9. [DOI] [PubMed] [Google Scholar]
- Swank MW. Coordinate regulation of Fos and Jun proteins in mouse brain by LiCl. Neuroreport. 1999;10:2685–9. doi: 10.1097/00001756-199911260-00041. [DOI] [PubMed] [Google Scholar]
- Swank MW. Phosphorylation of MAP kinase and CREB in mouse cortex and amygdala during taste aversion learning. NeuroReport. 2000;11:1625–1630. doi: 10.1097/00001756-200006050-00006. [DOI] [PubMed] [Google Scholar]
- Terao A, Greco MA, Davis RW, Heller HC, Kilduff TS. Region-specific changes in immediate early gene expression in response to sleep deprivation and recovery sleep in the mouse brain. Neuroscience. 2003;120:1115–24. doi: 10.1016/s0306-4522(03)00395-6. [DOI] [PubMed] [Google Scholar]
- Turgeon SM, Reichstein DA. Decreased striatal c-Fos accompanies latent inhibition in a conditioned taste aversion paradigm. Brain Res. 2002;924:120–3. doi: 10.1016/s0006-8993(01)03245-0. [DOI] [PubMed] [Google Scholar]
- Wilkins EE, Bernstein IL. Conditioning method determines the pattern of c-fos expression following novel taste-illness pairings. Behav Brain Res. 2006;169:93–97. doi: 10.1016/j.bbr.2005.12.006. [DOI] [PubMed] [Google Scholar]
- Wolgin DL, Wade JV. Effect of lithium chloride-induced aversion on appetitive and consummatory behavior. Behav Neurosci. 1990;104:438–40. doi: 10.1037//0735-7044.104.3.438. [DOI] [PubMed] [Google Scholar]
- Yamamoto T, Fujimoto Y, Shimura T, Sakai N. Conditioned taste aversion in rats with excitotoxic brain lesions. Neurosci Res. 1995;22:31–49. doi: 10.1016/0168-0102(95)00875-t. [DOI] [PubMed] [Google Scholar]
- Yamamoto Y, Shimura T, Sako N, Azuma S, Bai WZ, Wakisaka S. c-Fos expression in the rat brain after intraperitoneal injection of lithium chloride. Neuroreport. 1992;3:1049–1052. doi: 10.1097/00001756-199212000-00004. [DOI] [PubMed] [Google Scholar]
- Yoshida T, Sato H, Iba H. Transcription of fra-2 mRNA and phosphorylation of Fra-2 protein are stimulated by serum. Biochem Biophys Res Commun. 1991;174:934–9. doi: 10.1016/0006-291x(91)91508-a. [DOI] [PubMed] [Google Scholar]
- Yoshida T, Suzuki T, Sato H, Nishina H, Iba H. Analysis of fra-2 gene expression. Nucleic Acids Res. 1993;21:2715–21. doi: 10.1093/nar/21.11.2715. [DOI] [PMC free article] [PubMed] [Google Scholar]
- Zhou H, Zarubin T, Ji Z, Min Z, Zhu W, Downey JS, Lin S, Han J. Frequency and distribution of AP-1 sites in the human genome. DNA Res. 2005;12:139–150. doi: 10.1093/dnares/12.2.139. [DOI] [PubMed] [Google Scholar]