Abstract
The synthesis, structural framework, magnetic and oxygen-sensing properties of a lithium naphthalocyanine (LiNc) radical probe are presented. LiNc was synthesized in the form of a microcrystalline powder using a chemical method and characterized by electron paramagnetic resonance (EPR) spectroscopy, magnetic susceptibility, powder X-ray diffraction analysis, and mass spectrometry. X-Ray powder diffraction studies revealed a structural framework that possesses long, hollow channels running parallel to the packing direction. The channels measured approximately 5.0 × 5.4 Å2 in the two-dimensional plane perpendicular to the length of the channel, enabling diffusion of oxygen molecules (2.9 × 3.9 Å2) through the channel. The powdered LiNc exhibited a single, sharp EPR line under anoxic conditions, with a peak-to-peak linewidth of 630 mG at room temperature. The linewidth was sensitive to surrounding molecular oxygen, showing a linear increase in pO2 with an oxygen sensitivity of 31.2 mG per mmHg. The LiNc microcrystals can be further prepared as nano-sized crystals without the loss of its high oxygen-sensing properties. The thermal variation of the magnetic properties of LiNc, such as the EPR linewidth, EPR intensity and magnetic susceptibility revealed the existence of two different temperature regimes of magnetic coupling and hence differing columnar packing, both being one-dimensional antiferromagnetic chains but with differing magnitudes of exchange coupling constants. At a temperature of ∼50 K, LiNc crystals undergo a reversible phase transition. The high degree of oxygen-sensitivity of micro- and nano-sized crystals of LiNc, combined with excellent stability, should enable precise and accurate measurements of oxygen concentration in biological systems using EPR spectroscopy.
Introduction
Metal complexes of phthalocyanine and naphthalocyanine macrocycles are widely used as molecular materials in a variety of applications.1 An important consideration in the architectural design of these macrocycles is to introduce peripheral substitutions to create changes in their intrinsic properties. The modified macrocycles exhibit varied optical and magnetic properties, mostly because of changes in their conjugational π-electron network. The naphthalocyanine rings are derived from benzoannulation of the phthalocyanines. The molecular orbital (MO) calculations of the naphthalocyanines by Bredas and co-workers have predicted very different electronic energy levels when compared to the simple phthalocyanines.2,3 For example, the highest occupied molecular orbital (HOMO) of naphthalocyanine is destabilized compared to that of phthalocyanine, resulting in the reduced energy gap between the HOMO and the lowest unoccupied molecular orbital (LUMO) in naphthalocyanines leading to changes in their magnetic and semiconducting properties. These predictions have been confirmed by the work of Hanack and co-workers on metallated naphthalocyanines.4,5 Because of their unusual optical, magnetic, semiconductor, and redox properties, there have been avid interests in the development of novel molecular materials of alkali metal complexes of phthalocyanine and naphthalocyanine macrocycles.6-8
Lithium phthalocyanine (LiPc) was the first molecule to be extensively studied for its intrinsic semiconductor property.9-11 LiPc exhibits three distinct crystalline polymorphs, namely α, β and x-forms, all of which are paramagnetic, but only the x-form is oxygen-sensitive.12 The needle-like crystals of the x-form has a tetragonal crystalline packing containing micro-channels of 6 Å width running along the stack axis.9 In the cases of α and β forms, the molecular packing is tilted to some angle, and hence these channels are narrowed and partially blocked. The magnetic susceptibility of the x-form at room temperature was about 10% of the expected value for S = ½ non-interacting spins, and there have been many interesting studies on temperature dependence.12,13 The x-form of LiPc is also known for its unique electron paramagnetic resonance (EPR) properties.12,14 The material exhibits a single, narrow EPR line, the width of which is sensitive to the concentration of the surrounding molecular oxygen.15-19 While the LiPc probes possess many of the oximetry characteristics, their use in EPR oximetry is limited because of incident microwave power saturation. The EPR absorption of LiPc microcrystalline particles, for example, is saturated at about 1 mW of microwave power with typical EPR resonators at L-band (1.2 GHz), thus precluding the use of higher power for signal enhancement. In addition, the LiPc crystals lack long-term stability upon implantation in tissues.18,19
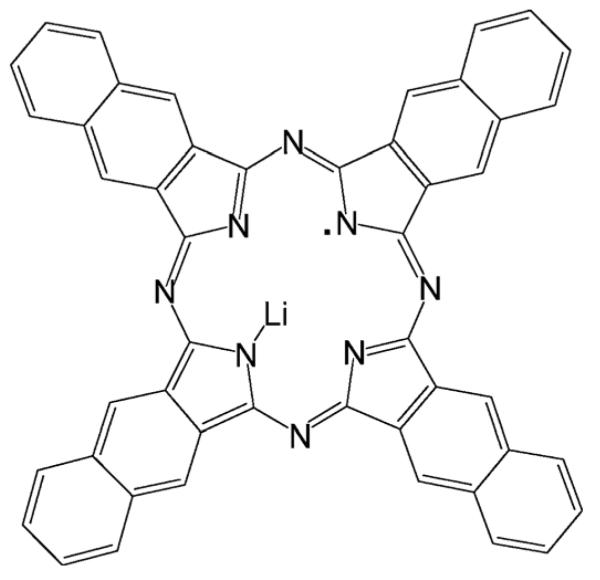
Recently, we reported the synthesis and characterization of two neutral radicals of lithium 1,8,15,22-tetraphenoxyphthalocyanine (LiPc–OPh)20 and lithium 5,9,14,18,23,27,32,36-octa-n-butoxy-2,3-naphthalocyanine (LiNc–BuO).21,22 These radicals showed certain advantages over LiPc, especially with respect to oxygen sensitivity, power saturation, and nanoparticle formation.20,22,23 Subsequently, these materials were used for a variety of biological oximetry applications.24-32 Our earlier attempts to synthesize LiNc in a pure form was not successful. The product turned out to be an aggregate of Li2Nc and LiNc.33-35 Although the aggregate was found to be remarkably sensitive to molecular oxygen, it was not stable in biological tissues.33 In this article, we report a modified synthesis for the preparation of LiNc radical (Structure 1) in a pure form and its structural characterization, variable temperature EPR and magnetic susceptibility measurements, and oxygen-sensing paramagnetic properties. The material possesses unique structural and paramagnetic properties including high oxygen sensitivity for molecular oximetry.
Structure 1.
Materials and methods
Lithium granules, n-pentanol, acetone, THF and methanol were obtained from Aldrich (St. Louis, MO, USA). 2,3-Dicyanonaphthalene was synthesized by following a published procedure.36
Synthesis of lithium naphthalocyanine (LiNc) radical
Clean lithium metal (0.2 g) was placed in a mixture of 4 ml methanol and 36 ml n-pentanol and the mixture was heated under nitrogen for 3 h. After the mixture was cooled down to room temperature, 2,3-dicyanonaphthalene (1.2 g, 6.7 mmol) was added and refluxed until it was completely consumed. The reaction mixture was filtered under dry nitrogen atmosphere and left in air overnight. A bluish material was obtained upon evaporation of the solvent under reduced pressure. This was washed with dry acetone, transferred to a thimble, placed in a Soxhlet extractor, and washed for 3 h with acetone, followed by a methanol–THF (1 : 1 v/v) mixture overnight. The bluish-green insoluble material, LiNc, was collected from the thimble and kept under vacuum at 70 °C overnight. Since the material was insoluble in most organic solvents it was used without further purification or recrystallization. The yield obtained was 37%. MS-MALDI: exact mass (m/z) calculated for C48H24N8Li (M+) 719.23; observed mass 719.15.
X-Ray diffraction
X-Ray powder diffraction was performed using a Bruker D8 diffractometer. The instrument uses a Cu-Kα radiation tube (λ = 1.5406 Å) and an incident beam Ge monochromator along with a Braun linear position sensitive detector. The patterns were collected in capillary mode at room temperature. The sample was packed in a 1 mm diameter glass capillary and data was collected over a 2θ range of 3–40° using a step size of 0.014347° and a counting time of 10 seconds per step.
EPR measurements
EPR measurements were carried out using a Bruker X-band (9.8 GHz) spectrometer (Bruker Instruments, Karlsruhe, Germany) equipped with a TM110 cavity. A small amount (∼10 μg) of the LiNc microcrystals was encapsulated in a 0.8 mm diameter gas-permeable Teflon tube (Zeus Industrial Products, Orangeburg, SC, USA) and placed in 4 mm quartz tube, open at both ends. The quartz tube was then inserted vertically into the center of the TM110 cavity for spectral acquisition. The LiNc microcrystals were precalibrated for EPR oximetry as reported earlier.22 EPR power-saturation studies were carried out at X-band frequencies at room temperature under anoxic condition (100% nitrogen-equilibrated) using incident microwave power levels of up to 150 mW.
Low-temperature EPR measurements
Samples prepared for low-temperature EPR studies were transferred to 4 mm clean fused quartz EPR tubes (707 SQ250M, Wilmad Co.) evacuated to 10−5 atm and sealed. The fused EPR tube containing the sample was placed outside the 4 mm EPR tubes, EPR spectra were measured using a Bruker EPR spectrometer with 100 kHz modulation. An Oxford continuous flow ESR900 cryogenic unit with an ITC 502 temperature controller was used to measure the temperature-dependant EPR spectra in the temperature region of the sample 22–300 K. Unless mentioned otherwise, the EPR linewidths reported in this manuscript are peak-to-peak (ΔBpp) of the first derivative spectra. The g values were calculated using the measured frequency from a frequency counter and the calibrated magnetic field. The DPPH marker was not used as a calibrant for g measurement, since it was found to overlap with the EPR line of the experimental sample. Furthermore, it was considered likely to affect the precise measurement of linewidth.
Preparation of LiNc nanoparticulates
Microcrystalline particulates of LiNc were suspended in phosphate-buffered saline (PBS) solution (10 mg per 0.5 ml) and sonicated for a total of 5 times at 30 s intervals using a microtip titanium horn and a generator power setting of 5. The particulate suspension was cooled for 1 min between each successive 30 s burst of sonication. At the end of sonication, the suspension was placed on ice for 2 min to allow the heavier particulates to settle at the bottom of the tube, and the supernatant liquid possessing smaller-sized particles was transferred to a separate tube. Particle-size analysis was performed using a Zetasizer (Malvern Instruments, model nano-s) with the capability to characterize particle sizes ranging from 0.6 nm to 10 μm. The supernatant contained fine particulates of LiNc with a mean particulate size of 330 nm.
Magnetic susceptibility measurements
Magnetic measurements were carried out on a powder sample at a field of 1000 G using a SQUID magnetometer operating in the temperature range 3–300 K. The magnetic susceptibility was corrected for underlying diamagnetism using Pascal constants. Molar susceptibilities are given in emu G−1 mol−1; magnetic moments in Bohr Magnetons were calculated according to the relation μ = 2.84 × (χmT)½. The SQUID experiments used a 25 mg LiNc sample, weighed and transferred to the capsule (for the evacuated samples), which was open at the top to create a vacuum (10−3 Torr) in the quartz tube and sealed using a torch. This capsule was introduced into a plastic tube which was mounted on the sample rod. The temperature dependence of the sample magnetic moment was measured in an applied magnetic field of 1000 G and was subsequently converted to molar magnetic susceptibility value. The magnetic susceptibility values were corrected by diamagnetism, χd, using Pascal's constants.
Results and discussion
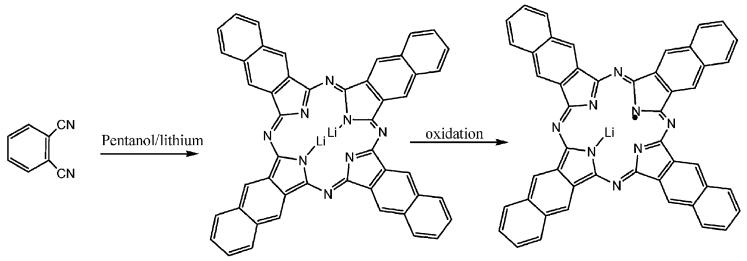
Microcrystals of LiNc were prepared by a two-step chemical procedure as described in Scheme 1. In the first step, Li2Nc was synthesized by cyclotetramerization of 2,3-dicyanonaphthalene in the presence of lithium–pentanol. The Li2Nc was then oxidized to form LiNc microcrystals. The mass spectral, EPR, and magnetic properties of the LiNc were in accordance with the proposed structure. The microcrystalline property was similar to those observed earlier for LiPc,15,18,19 LiNc–BuO21,22 and LiPc–OPh.20 All of these molecules form columnar stacks in the solid state. LiNc crystals are highly insoluble in water and most common organic solvents in contrast to their derivatives LiNc–BuO and LiPc–OPh, which are soluble in common organic solvents such as chloroform, dichloromethane, THF, ethyl acetate, toluene, benzene, xylenes and hexanes. The highly insoluble character of LiNc made it difficult to purify this compound using column chromatography and subsequent crystallization. This material LiNc is stable at high temperature (up to 250 °C) in air for a long time.
Scheme 1.
Crystal and molecular structure
The molecular packing arrangement of LiNc was determined using real space–structure solution methods to extract structural information from X-ray powder diffraction data. The autoindexing suite of Topas Academic was implemented to determine the unit cell parameters as well as the space group.37 The first twenty-five peaks were used to index the pattern while the rest were not included due to the large drop-off in intensity at higher angles. Peak positions were determined by profile fitting and used as input for the indexing algorithm. Twelve possible unit cells, with triclinic or monoclinic Bravais lattices, were found from the autoindexing program.
After indexing, the DASH software package was used to determine the molecular packing of LiNc.38,39 To further examine the possible solutions, the Pawley method was used to extract the peak intensities via the DASH software suite.40 The best Pawley fits were found for cell 4, cell 10, and cell 11, with χ2 values of 11.68, 9.74, and 9.28, respectively. All three of these unit cells are triclinic with nearly identical volumes (∼820 Å3) and therefore, are most likely related. If we assume that one molecule is present in the unit cell (Z = 1), the density is 0.877 g cm−3, which is similar to the crystalline forms of NiNc, CuNc, and ZnNc.41 Therefore, we can be confident in our assignment of Z = 1.
Next, the preparation for the simulated annealing runs was completed. The molecular geometry was created by the Materials Studio software package.42 The only possible space groups in a triclinic lattice are P1 and P1̄, and for this simulation, we assume the correct space group for LiNc is the more prevalent, higher symmetry P1̄ space group. This space group possesses an inversion center which means that only half of the unit cell is crystallographically unique. As a result, because Z = 1, the molecule is constrained to the center of the cell, at the inversion center and only half of the atomic positions of LiNc are used in the input. Due to the rigidity of the napthalocyanine ring, only three variables, describing the rotational degrees of freedom, were left unconstrained.
Twenty-five simulated annealing runs were performed for each of the three unit cells mentioned above to determine the best fit of the experimental data. One individual run in the simulation consisted of 20 million moves starting at a temperature of approximately 300 K with 3500 moves at each temperature.
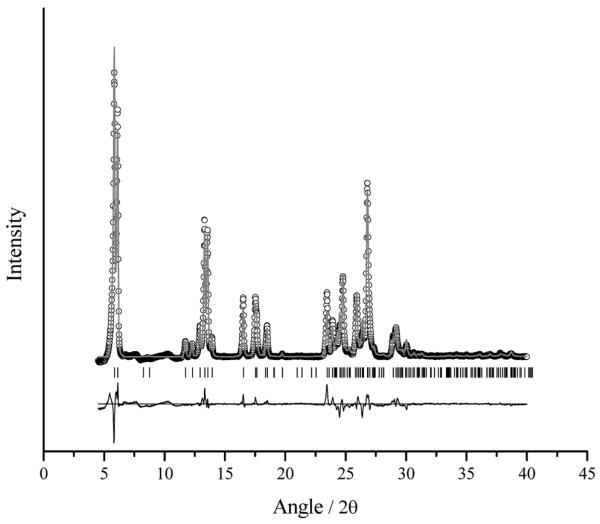
The results from the simulated annealing runs gave similar results in the case of all three of the possible unit cells. For each set of runs, the χ2(pro) ranged from 39 to 44, where the calculated pattern can be seen in Fig. 1. Reproducibility of the packing and orientation of the LiNc molecule was consistent within each set of runs as well as between the runs for each of the three possible unit cells confirming our earlier assumption that cells 4, 10 and 11 are related.
Fig. 1.
X-Ray powder diffraction pattern of LiNc. The points represent the experimental data points, while the calculated pattern from the simulated annealing is shown by the solid line. The tick marks indicate the allowed peak positions for this specific structure, while the difference curve is shown underneath the patterns.
Simulated annealing runs were also performed using the space group P1, where the entire molecule is unique and therefore, no constraints due to symmetry are placed on the molecule. The same computational conditions were used as above. Results from the simulations based on the P1 space group neither improved or worsened the quality of the fit with χ2(pro) values in the same range as the simulations using the P1̄ space group. Also, upon examination of the possible simulated annealing solutions, in a majority of the runs, the center of the molecule naturally fell on the point (½, ½, ½) which is the inversion center in the P1̄ space group. Therefore, P1̄ is chosen as the correct space group as it has a higher symmetry than P1. Also after examining the three possible unit cells, which all produced fits of the same quality as well as essentially the same packing structure, cell 10 was chosen as the correct unit cell. All three of the unit cells have similar volumes, which indicate that they are related, but the angles of the unit cell in cell 10 remain the closest to 90°. Therefore, the correct unit cell for LiNc is reported as a = 3.7950(9) Å, b = 15.50922(10) Å, c = 14.4260(8) Å, α = 92.4590(3)°, β = 93.350(5)°, γ = 103.440(6)° with a volume of 822.99 Å3.
Simulated annealing runs were performed on the remaining possible unit cells listed in Table 1, however, the χ2(pro) values were all much greater than 100 and as a result, were discarded as possibilities. The chosen unit cell is satisfactory based on the quality of the fit compared to the Pawley refinement. In any rigid body refinement using DASH, a solution is generally satisfactory if the χ2(pro) value is within a factor of 5 or less from the χ2 value of the Pawley refinement. The χ2(pro) from this unit cell is approximately 4.1 times the χ2 of the Pawley refinement.
Table 1.
Possible lattice parameters and their figures of merit obtained from the Topas Academic autoindexing suite. Cell 1 is the unit cell of CuNc, ZnNc, and NiNc which has a similar molecular structure to LiNc
| Cell | Figure of merit | Space group | V/Å3 | a/Å | b/Å | c/Å | α/° | β/° | γ/° |
|---|---|---|---|---|---|---|---|---|---|
| Cell 1 | P21/c | 1650 | 6.9 | 7.9 | 30.2 | 90 | 91 | 90 | |
| Cell 2 | 15.25 | P21 | 1687 | 15.07252 | 7.8227 | 14.39855 | 90 | 93.34418 | 90 |
| Cell 3 | 28.56 | P1/P1̄ | 820 | 3.8394 | 14.427 | 15.6439 | 85.827 | 104.6187 | 93.3737 |
| Cell 4 | 26.89 | P1/P1̄ | 820 | 3.79497 | 21.47332 | 15.59867 | 43.1940 | 104.7990 | 92.7630 |
| Cell 5 | 16.1 | P1/P1̄ | 1657 | 14.4072 | 15.1392 | 7.6474 | 94.952 | 91.878 | 93.251 |
| Cell 6 | 10.1 | P1/P1̄ | 1677 | 14.4212 | 15.08754 | 7.68832 | 90.64836 | 93.34585 | 86.5591 |
| Cell 7 | 15.1 | C2/c | 3536 | 30.1197 | 4.0882 | 28.7715 | 90 | 93.405 | 90 |
| Cell 8 | 15.45 | C2/m | 3698 | 30.2476 | 8.5365 | 14.4054 | 90 | 93.458 | 90 |
| Cell 9 | 15.45 | P1/P1̄ | 1670 | 3.8512 | 20.3007 | 21.4428 | 87.2654 | 91.11457 | 94.6697 |
| Cell 10 | 27.18 | P1/P1̄ | 820 | 3.79518 | 15.50922 | 14.42598 | 92.4590 | 93.3550 | 103.4400 |
| Cell 11 | 26.72 | P1/P1̄ | 821 | 3.7937 | 14.4152 | 20.6901 | 48.399 | 77.603 | 86.698 |
| Cell 12 | 26.27 | P1/P1̄ | 820 | 3.7937 | 21.607 | 15.5182 | 132.753 | 104.829 | 97.324 |
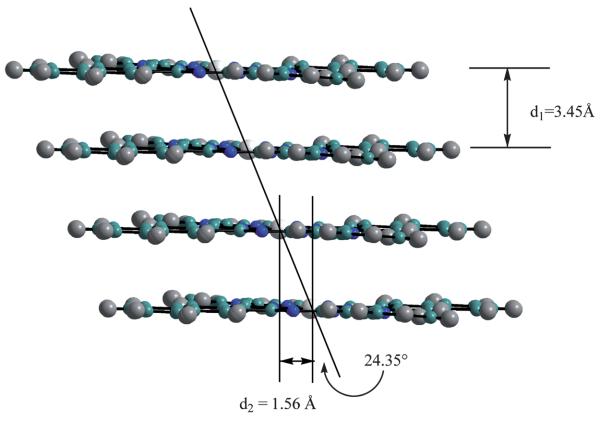
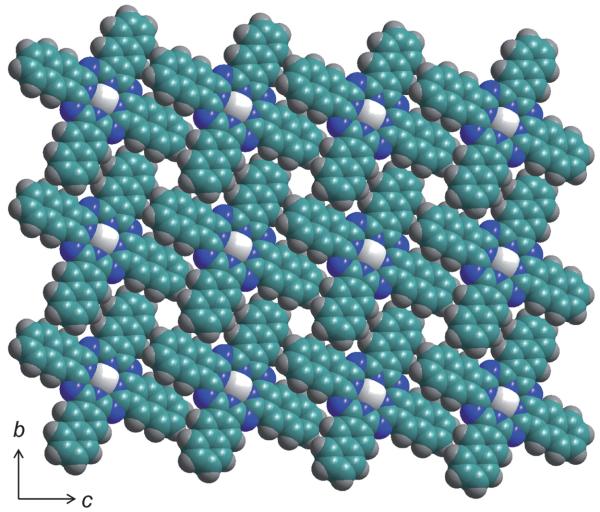
The molecules are arranged in columns that are slightly slip-stacked, as shown in Fig. 2. This same type of stacking is seen in KPc,43 both the α and β forms of LiPc,44 and LiPc-α-OPh;20 however, the slipping in LiNc is much less than in the other cases. The slipping distance, represented by d2 is only 1.56 Å in LiNc, while it is 4.85 Å in KPc43 and 4.65 Å in LiPc–α-OPh. The columns are held together by π–π stacking along the a-axis where the planes of the molecules are 3.45 Å apart. The angle between the stacking direction and the line connecting the equivalent atoms/points in adjacent units is 24.35°, an indication of the slip-stack. Along the bc plane, the adjacent LiNc molecules are packed closely together with a naphthalene unit of one molecule lying in-between two naphthalene units of the adjacent molecule. However, in the bc plane, the adjacent molecules do not lie along the same plane, but are offset from one another, as can be seen in the 3D representation in Fig. 3. LiNc has large channels which are formed by end units of the naphthalene units of four adjacent molecules and can be seen in Fig. 3. These channels are approximately 5.0 × 5.4 Å2 and run parallel to the a-axis. These large open spaces in the network could allow for the easy diffusion of oxygen molecules, which have a size of 2.8 × 3.9 Å2.
Fig. 2.
Slip-stacking of LiNc along the a-axis. d1 represents the distance between the LiNc planes and d2 represents the slip-stacking distance along the a-axis. The white spheres represent lithium, the green spheres carbon, the blue spheres nitrogen and the grey spheres hydrogen.
Fig. 3.
Three-dimensional representation of the packing of LiNc molecules showing the large channels running parallel to the a-axis. The color scheme is the same as in Fig. 2.
EPR studies of LiNc at room temperature
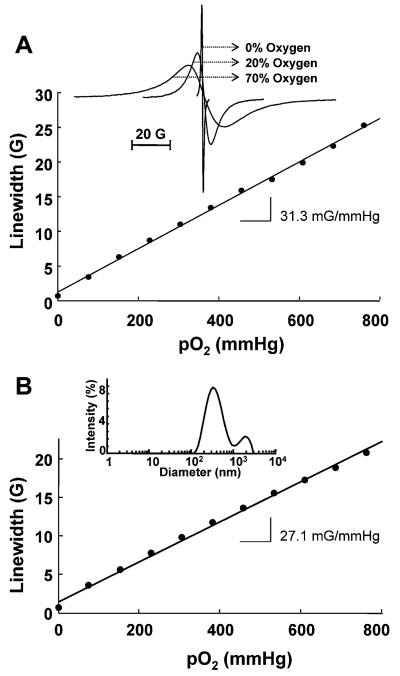
The X-band EPR spectrum of LiNc microcrystals, measured under vacuum, consists of a single sharp peak with a peak-to-peak width of 0.630 G (Fig. 4A, inset). The observation of a single line ensures that there is only one paramagnetic form present in the LiNc sample. The line is quite symmetrical revealing its isotropic nature though at high pO2 conditions a certain amount of anisotropic nature is visible. The EPR linewidth at anoxic conditions when pumping under vacuum (10−3 torr) or at 100% N2 conditions is one-tenth of the normoxy condition. The observation of a single sharp line in the EPR spectrum of lithium phthalocyanine radical crystals is a common feature that is attributed to the phenomenon of exchange narrowing. The observed linewidth of LiNc under anoxic conditions is, however, significantly larger than the reported values for LiPc crystals (0.01–0.05 G). The linewidth of LiNc was highly sensitive to the surrounding amount of molecular oxygen (Fig. 4A, inset). Lineshape analysis of the powder spectra, essentially isotropic, revealed that the shape was closer to the Fourier Transform of exp[−At3/2] somewhat in-between Gaussian and Lorentzian. One can also fit it by a linear combination of widths from Lorentzian (0.63 G) and Gaussian (0.07 G). This refers to the 1-d character of the material as observed in N(CH3)4MnCl3(TMMC) by Dietz et al. and others45 and in many works of Manoharan and co-workers.46,47 The g factor did not deviate from that of free electron; this observation confirms the efficiency of the spin diffusion at high temperature. The x-form of LiPc, a structurally related analog of LiNc without the benzo-substitution, is of a tetragonal unit cell with straight molecular packing along the c-axis and with an interplanar LiPc–LiPc spacing of 3.245 Å.9 A comparison of structural parameters of LiNc, LiPc, LiNc–BuO and LiPc–α-OPh is found in Table 2.
Fig. 4.
Effect of molecular oxygen on the EPR linewidth of LiNc crystals. (A) Variation of EPR linewidth of microcrystals with pO2. A linear variation of linewidth with the pO2 is observed. The probe sensitivity (as measured by the slope) is 31.3 mG per mmHg. Inset shows the EPR spectra of LiNc microcrystals measured under vacuum, in the presence of 20% O2–80% N2, or 70% O2–30% N2 using an X-band EPR spectrometer at room temperature. The instrumental settings were: microwave power, 1 mW; modulation amplitude, 1 G (250 mG for 0% oxygen); modulation frequency, 100 kHz; receiver time constant, 41 ms; receiver gain, variable; acquisition time, 10 s (single scan); A single sharp peak with a peak-to-peak width (ΔBpp) of 0.63, 6.3, and 17.5 G in 100% N2, 20% O2 and 70% O2, respectively, is observed. (B) Effect of molecular oxygen on the EPR linewidth of LiNc nanocrystals. A linear variation of linewidth with the pO2 is observed. The probe sensitivity (as measured by the slope) is 27.1 mG per mmHg. The inset shows particle-size distribution in nano-particulate suspension of LiNc.
Table 2.
A comparison of properties of LiPc, LiNc, LiNc–BuO and LiPc–α-OPh lattices
| Parameters | LiNc | LiPc | LiNc BuO | LiPc-α-OPh |
|---|---|---|---|---|
| Slipping distance/Å | 1.56 | — | 4.7 | 4.65 |
| Interstack or interplanar distance/Å | 3.45 | 3.25 | 4.7 | 3.36 |
| Channel size (cross-sectional diameter)/Å2 | 5.0 × 5.4 | 6 × 6 | 10 × 6; 6 × 4; 5 × 5 | 4.9 × 4.6; 4.6 × 8.7 |
The larger anoxic EPR linewidth in LiNc (0.63 G) as compared to LiPc (0.1–0.05 G) is caused by weaker exchange due to larger interstack distance in the lattice, decreased channel size with a concomitant reduction in spin diffusion, and also by unresolved hyperfine interaction due to increased π-conjugation network.
The anoxic EPR linewidth of lithium octabutoxynaphthalocyanine (LiNc–BuO)21,22 is significantly different from that of LiNc suggesting that the spin-exchange interactions, and crystalline packing in both cases are different. In addition to this the electron-releasing butoxy substituents present in LiNc–BuO or the phenoxy groups present in LiPc–OPh further contribute to the altering of spin delocalization.
Effect of molecular oxygen on the EPR spectrum of LiNc
The introduction of molecular oxygen broadens the EPR spectrum of the LiNc, as shown in Fig. 4A. The broadening of the EPR spectrum in the presence of molecular oxygen is due to the Heisenberg intermolecular spin exchange between the LiNc probe and molecular oxygen and subsequent shortening of the spin–spin relaxation time. The line-broadening in the presence of oxygen may be due to the weakening of the strong exchange interaction along chains by allowing oxygen-induced transverse coupling between chains. The diffusion of oxygen inside the crystals is greatly favoured by the presence of channels between the columns of macrocycles. The increased peak-to-peak EPR linewidth varying linearly with pO2 observed for LiNc, as shown in Fig. 4A, reveals the linear increase in spin exchange with pO2 over the entire 0 to 760 mmHg range. Probably a significant observation is that the slope of the linewidth versus pO2 calibration line, which reflects the sensitivity of the probe to pO2, is large (31.2 mG per mmHg). The effect of oxygen on the EPR linewidth or intensity was reversible on cycles of oxygenation–deoxygenation processes (data not shown). A similar oxygen-induced broadening of the EPR spectrum has been observed for LiPc (5–9 mG per mmHg),15,18,19 lithium naphthalocyanines,33 and chars.48,49 The linear variation of linewidth with pO2 observed for LiNc up to 760 mmHg suggests that oxygen is transported freely into its channel, without any adverse chemical or physical interactions. The relatively larger increase in linewidth of LiNc on exposure to oxygen (31.2 mG per mmHg) as compared to that in LiPc (5–9 mG per mmHg), LiPc–α-OPh (13.7 mG per mmHg) and other substituted naphthalocyanines such as LiNc–BuO (8.45 mG per mmHg) can be explained by two factors: (i) the relatively smaller pore size (5.0 × 5.4 Å2) as against, say in LiPc (6 × 6Å2), restricts the free motion of oxygen molecules and thereby increased linewidth by increased dipolar interaction from the rather stationary oxygen molecules and the LiNc stack; and (ii) increased unresolved hyperfine linewidth from the protons of the extended π-network in LiNc as compared to LiPc and its substituted derivatives. The g factor does not change with oxygen diffusion inside the channel in LiNc, supporting the uniform distribution of oxygen in the sample.
Effect of crystal-size on the anoxic linewidth and the oxygen sensitivity of LiNc
It was found to be difficult to produce crystals of reproducible size and hence the lack of reproducibility in oxygen calibration from batch to batch. Our preparations showed variations of 30–50 mG in anoxic linewidth and oxygen sensitivity as well. In order to obtain particles of uniform size/sensitivity we generally reduce the size of particles from the raw preparations by sonication. The particle-size distribution for LiNc particles sonicated at 22.5 kHz showed that the particle suspension had a distribution of size, ranging from 120 to 500 nm, with a maximum number of particles at approximately 330 nm. (Fig. 4B inset). The sonicated particles retained both oxygen sensitivity and linearity in the linewidth versus pO2 curve (Fig. 4B). However, the size-reduction of LiNc resulted in a partial loss of oxygen sensitivity. Despite of the variability in the oxygen sensitivity among different batches, the crystals of LiPc and LiNc derivatives always showed a decrease in their oxygen sensitivity upon sonication.20,22 A possible reason for the partial loss of oxygen sensitivity when decreasing the size of the crystals by sonication could be the sonochemical effect of acoustic cavitation which could result in chemical reactions on the surface of the particles, resulting in blockage of the opening of these channels. Blockage of the channels on the surface of the particle could hinder the free diffusion of oxygen into the channel and might result in the partial loss of oxygen sensitivity. Similar effects could also be brought about if cavitation effects created new defects in the crystal structure.23 The result of sonolysis of LiNc is similar to that of sonolysis of LiPc, LiPc–α-OPh and LiNc–BuO crystals exposed to 22.5 kHz ultrasound. However, it should be noted that exposure of LiPc microparticles to a combination of 22.5 kHz sonolysis, followed by higher frequency sonolysis (i.e., 354 kHz) was shown to result in a further decrease in particle size, but a striking loss of oxygen sensitivity (linewidth 0.14 G).23 The ability to form LiNc nanoparticles that remain sensitive to the partial pressure of oxygen is particularly advantageous for internalizing these nanoparticles in cells for a variety of novel biological applications.
Microwave power saturation of LiNc
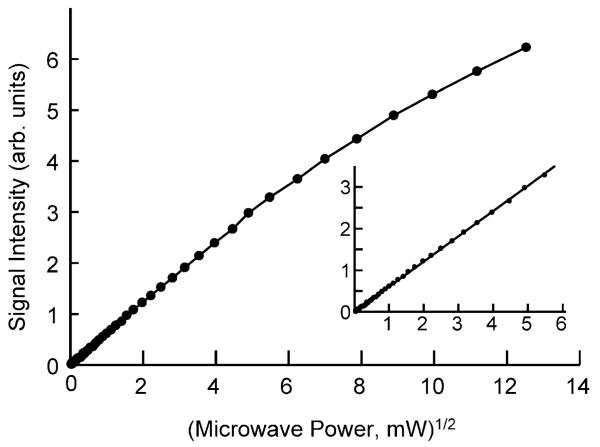
The dependence of the X-band EPR signal intensity on the incident microwave power is shown in Fig. 5. The spectrum was not saturated for up to 30 mW of incident power. This is an important feature that possibly may offer an advantage over that of LiPc in terms of its use as a biological oximetry probe since higher powers can be used to enhance signal intensity without line-width distortions. This property of LiNc is particularly in contrast to that of LiPc, which requires the use of very low microwave power, typically less than 1 mW, at low oxygen concentrations. The use of low power, particularly with aqueous biological samples with movement and other sources of instability, can limit (i) signal intensity (signal-to-noise ratio), (ii) coupling of the resonator to the microwave source, and (iii) stability of the microwave tuning circuit. Moreover, under EPR spectral saturating conditions, the dependence of linewidth to oxygen concentration is modified in such a way that the useful range of oxygen sensitivity is reduced, particularly in the lower end of oxygen measurement range. Instability in the coupling also causes frequent loss of lock due to animal motion resulting in artifacts and disruptions in the measurement.
Fig. 5.
Effect of incident microwave power on the signal intensity of X-band EPR spectrum of LiNc microcrystals under anoxic conditions. The inset shows an expanded view of the variation of signal intensity in the low microwave power region < 30 mW.
Low temperature EPR studies of LiNc under vacuum
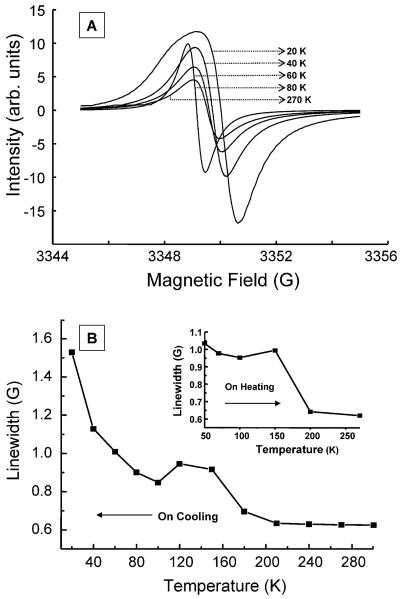
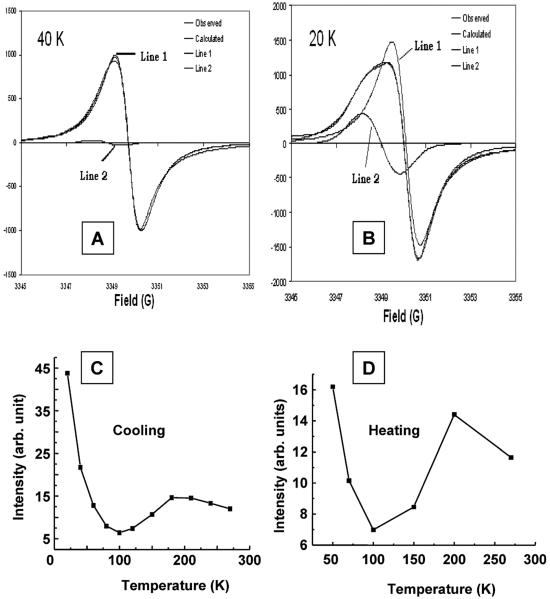
To get a clear understanding of the magnetic properties of LiNc, the EPR oximetry probe, variable temperature EPR studies of LiNc were carried out down to 20 K at X-band frequency under anoxic conditions. To avoid the effect of oxygen on LiNc crystals, LiNc samples were sealed under vacuum (10−3 to 10−4 Torr) in an EPR quartz tube. LiNc crystals showed a single EPR line when measured in the 20–273 K temperature range and indicate that a majority of single (or two) magnetic species are present in LiNc. Fig. 6A shows a temperature dependence of the EPR linewidth of LiNc at 20, 40, 60, 80 and 270 K viz. 1.55 G, 1.1 G, 0.95 G, 0.80 G and 0.63 G, respectively. Increased line broadening on decreasing the temperature (Fig. 6B) probably means an increased dipolar broadening due to the contraction of the lattice. Also, at temperatures below 60 K, the EPR line looks a bit anisotropic, in addition to becoming more broadened, probably because of either changes in stacking with puckering of the π-moiety or shortening of interplanar distances. The isotropic linewidth increase down at 60 K is quite obvious; however, a careful look at the EPR spectra at ≤60 K reveals that either an additional broad line is formed or anisotropy sets in on cooling even in the spectral range down to 60 K. But the appearance of this is more visible at 40 K and is easily seen at 20 K. The transition from a pure isotropic single line to the formation of two isotropic lines with differing intensity and linewidth takes place at ∼50 K, in agreement with the magnetic measurements (vide infra). Fig. 7(A and B) shows a comparison of the simulated two lines, their relative intensities while Table 3 shows the analyzed data.
Fig. 6.
Temperature dependence of EPR spectra of LiNc crystals. (A) Typical EPR spectra of LiNc crystals obtained under vacuum at 20, 40, 60, 80 and 270 K are shown. Spectrum at room temperature is given in Fig. 5. The EPR instrumental settings were: microwave frequency, 9.7 GHz; microwave power, 0.5 mW; modulation amplitude, 0. 25 G; modulation frequency, 100 kHz; receiver time constant, 41 ms; acquisition time, 15 s (single scan). (B) Temperature dependence of linewidth of LiNc crystals under vacuum. The peak-to-peak linewidth of LiNc crystals decreases with increasing temperatures. The inset shows the same variation on heating the sample.
Fig. 7.
Simulation of the EPR spectra and temperature dependence of EPR intensity. The simulations of spectra measured at (A) 40 K and (B) 20 K show their decomposition into two isotropic lines. Though the intensities of both lines increase on decrease of temperature, the relative intensity of the low-field high-g line is higher on lowering the temperature. (C) and (D) show temperature dependence of integrated EPR intensity of LiNc crystals under vacuum on cooling and heating.
Table 3.
A comparison of EPR parameters of the experimental spectra of LiNc at 20, 40 and 270 K
| Line 1 |
Line 2 |
|||||
|---|---|---|---|---|---|---|
| Temperature/K | g | ΔBpp/G | Relative intensity |
g | ΔBpp/G | Relative intensity |
| 270 | 2.0023 | 0.637 | 1400 | — | — | — |
| 40 | 2.0020 | 1.143 | 4676 | 2.0025 | 1.203 | 41 |
| 20 | 2.0017 | 1.260 | 8425 | 2.0024 | 1.668 | 1359 |
The formation of two lines presumably originates from the first order structural transition that alters the packing of molecules. In addition, even at temperatures above 50 K there is a small component of the second line at higher g value i.e., at lower field as could be clearly recognized by a slight flattening of the peak maxima at lower field as compared to the sharp minima at high field. Also the first order phase transition is clearly seen by the EPR lines on cooling and heating in Fig. 7(C and D). Fig. 7(C and D) shows the integrated EPR intensity of LiNc crystals under vacuum as a function of temperature. Though the substantial increase in the intensity below 100 K could be interpreted as the breaking down of the antiferromagnetically coupled system into a monomeric material, the integrity of linewidth variation on reversing the temperature cycle by heating negates this suggestion. Hence the material undergoes a simple first order phase transition (vide infra, magnetic susceptibility). The EPR intensity exhibits two regimes. On decreasing the temperature from 270 to 220 K there is an increase in intensity followed by a decrease up to 100 K with the maximum intensity at 220 K, in the first region. In the second region, below 100 K, there is a continuous increase in intensity due to a combination of intensities from the two species. The magnetic properties of LiNc are fully reproducible and easier to interpret than those obtained for single crystals or powders of LiPc.14,16,50 This results mainly from the absence of structural defects in LiNc, in contrast to that observed for LiPc. In the whole comparative range, a majority of single magnetic species is observed. A similar temperature-induced broadening of the EPR spectrum has been observed for lithium octamethoxyphthalocyanine (LiPc–MeO).17 Unlike in the parent LiPc, two components were observed separately in a crystal, due to a large anisotropy of the g factor of the broad EPR line at low temperature. The g shift is specific of a low temperature magnetic behaviour of the spin species involved in the broad EPR line whereas the g factor for the narrow line is close to the free electron g value. It has low anisotropy over the whole investigated temperature range.
Magnetic susceptibility measurements
The magnetic properties of phthalocyanine and their annulated derivatives have been extensively studied. Most of the existing work, especially on the magnetism of these compounds, has been done either on highly doped or poorly characterized metallophthalocyanines. Lithium phthalocyanines and their derivatives are especially known for their unusually narrow EPR lines and oxygen-sensing properties, with possible applications in biomedical work, all at room temperature. However, by studying the temperature-dependant bulk susceptibility as well as the crystal structure it is possible to obtain important insight regarding the magnetic coupling between neighbours or within a column of molecules. Furthermore, the spin dynamics of the system have to be correctly inferred. Already, some of these systems suggest the presence of phase transition in addition to magnetic interaction referred to above. It would, therefore, be better that we study in detail temperature-dependent EPR on both the anoxic and oxy samples to correlate such results with bulk magnetic susceptibility and the crystal structure. This will throw substantial light on the nature of magnetism in the condensed phase as well as reveal the nature of spin dynamics. While we have studied the magnetic susceptibility of the anoxic from ambient temperature to 3 K using a SQUID magnetometer, temperature-dependent EPR studies have been conducted only down to 20 K due to experimental constraints.
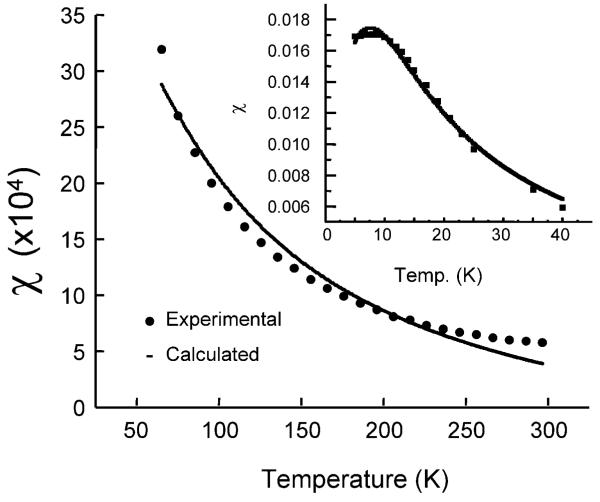
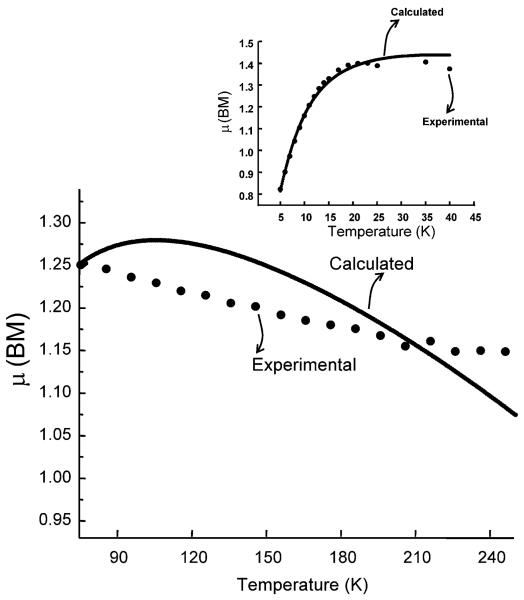
The thermal variation of measured susceptibility of LiNc in an applied field of 1000 G corrected for diamagnetism with the use of Pascal's constant χD = 4.97686 m J T−2 is shown in Fig. 8 for two different regions, 40–300 K and 3–40 K using the rationale from EPR studies. The experimental values of magnetic susceptibility were fitted using a Bonner–Fisher model for a low dimensional magnet. Low dimensional magnetism has support from EPR as well as the fitting of the bulk susceptibility. EPR lineshape is indicative of low-dimensional character, which is the Fourier transform of exp[–At3/2] somewhere between Gaussian and Lorentzian. Similarly, magnetic susceptibility can be interpreted in terms of two different temperature regimes above and below 50 K analogous to the EPR results, in terms of a reversible phase transition. Magnetism below 50 K can be concretely defined in terms of the Bonner–Fisher model for a low dimensional material (Fig. 8) with JBF = −4.065 cm−1 using a fitting procedure adapted from the work of Chandramouli and co-workers.51 The fitting is not only excellent but also reveals the absence of any monomeric impurities and hence the integrity of packing of LiNc molecules as a one-dimensional linear chain, even after cooling where one can expect breaking of chains to form monomeric impurities. However, at temperatures above 50 K, they can either be defined in terms of Bleany–Bowers dimers with a large value for J = −715.75 cm−1 or by a Bonner–Fischer model of linear chain with a J value of −17.95 cm−1 Though the fitting is good by the first model it shows the presence of about 30% monomeric impurities. It cannot be true since the low temperature fitting by the BF model shows a total lack of monomeric impurities. Normally more monomeric impurities are created due to the irreversible cracking of crystals on lowering the temperature. Hence the Bonner–Fischer low-dimensional model with a J value of −17.95 cm−1 must be the correct interpretation. In addition, on lowering the temperature, the crystals are expected to contract and this could have caused a decrease in the antiferromagnetic character. This reduction of −2J = −17.95 cm−1 to −2J −4.065 cm−1 must have been brought about by a phase transition, as clearly revealed by EPR results. The effective increase in magnetic moment (Fig. 9) of individual molecules at <50 K is due to ‘reduced antiferromagnetism’. However, the reduction in the magnetic moment below 10 K is due to additional antiferromagnetic inter-chain interaction as seen in many organic magnets. It is also possible that the domination of the second species at lower temperatures, especially below 15 K could have created this variation. Particular attention must be paid to the analogous nature of temperature-dependent EPR results and bulk magnetism. The lack of separate EPR lines due to monomeric impurities again supports the Bonner–Fischer model of a linear chain both at high-and low-temperature regions. The room-temperature crystal structure also supports the presence of linear chain rather than the strongly coupled dimers at high temperature.
Fig. 8.
Magnetic susceptibility (high-temperature regime) and inset (low-temperature regime) of LiNc crystals as a function of temperature for an applied magnetic field of 1000 G. The experimental (·) and theoretical values (—) using a Bonner–Fischer model for LiNc crystals are given for comparison. The experimental susceptibility values have been corrected for diamagnetism.
Fig. 9.
Effective magnetic moment (high-temperature regime) and inset (low-temperature regime) of LiNc crystals as a function of temperature for an applied magnetic field of 1000 G. The experimental (·) and theoretical values (—) using a Bonner—Fischer model for LiNc crystals are shown for comparison.
Conclusions
A naphthalocyanine-based radical probe, LiNc, with attractive EPR properties, was synthesized using a modified chemical procedure and purification. The material was obtained as fine crystals and characterized by EPR, magnetic susceptibility, powder X-ray diffraction and mass spectroscopy. The X-ray powder diffraction analysis showed that packing of LiNc molecules creates open channels with size greater than 5.0 × 5.4 Å2 which permits diffusion of oxygen molecules (2.8 × 3.9 Å2) through the crystals. The probe showed an exchange-narrowed single-line EPR spectrum whose linewidth was sensitive to the surrounding oxygen concentration. The effect of molecular oxygen on the EPR linewidth was linear up to 760 mmHg. The sensitivity of the EPR linewidth to molecular oxygen is 31.2 mG per mmHg, which suggests that changes in pO2 can be measured with high resolution using this probe under the experimental conditions described in this work. The magnetic property of thermal variation versus linewidth, EPR intensity and magnetic susceptibility of LiNc indicate that at higher temperature, it shows a highly exchanged system with narrow linewidth, whereas at low temperature exchange interaction is substantially reduced and it shows a localized spin state. These results support LiNc as a highly promising candidate for very sensitive and fast measurement of oxygen concentrations in biological systems.
Acknowledgements
This work was supported by NIH grant EB 004031. We thank Dr Denis Pelekhov for his help with the susceptibility measurements. PTM thanks the JNCASR for the honorary professorship and the DST, Govt. of India for Ramanna Fellowship. PTM also thanks Dr Chandramouli Gadisetti and Mr Balaji for scientific help.
References
- 1.Leznoff CC, Lever ABP, editors. Phthalocyanines: Properties and Applications. VCH; New York: 1989. [Google Scholar]
- 2.Orti E, Crespo R, Piqueras MC, Bredas JL. Synth. Met. 1991;42:2647–2652. [Google Scholar]
- 3.Orti E, Piqueras MC, Crespo R, Bredas JL. Chem. Mater. 1990;2:110–116. [Google Scholar]
- 4.Hanack M, Lang M. Adv. Mater. 1994;6:819. [Google Scholar]
- 5.Hanack M, Renz G, Strahle J, Schmid S. Chem. Ber. 1988;121:1479–1486. [Google Scholar]
- 6.Leznoff CC, Lever ABP, editors. Phthalocyanines: Properties and Applications. VCH Publishers, Inc.; Weinheim; 1996. [Google Scholar]
- 7.Armstrong NR. J. Porphyrins Phthalocyanines. 2000;4:414–417. [Google Scholar]
- 8.de la Torre G, Vázquez P, Agulló-López F, Torres T. J. Mater. Chem. 1998;8:1671–1683. [Google Scholar]
- 9.Sugimoto H, Mori M, Masuda H, Taga T. J. Chem. Soc., Chem. Commun. 1986:962–963. [Google Scholar]
- 10.Turek P, Andre JJ, Giraudeau A, Simon J. Chem. Phys. Lett. 1987;134:471–475. [Google Scholar]
- 11.Turek P, Petit P, Andre JJ, Simon J, Even R, Boudjema B, Guillaud G, Maitrot M. J. Am. Chem. Soc. 1987;109:5119–5122. [Google Scholar]
- 12.Brinkmann M, Turek P, Andre JJ. J. Mater. Chem. 1998;8:675–685. [Google Scholar]
- 13.Dumm M, Nicklas M, Loidl A. Synth. Met. 1999;103:2070. [Google Scholar]
- 14.Turek P, Andre JJ, Simon J. Solid State Commun. 1987;63:741–744. [Google Scholar]
- 15.Afeworki M, Miller NR, Devasahayam N, Cook J, Mitchell JB, Subramanian S, Krishna MC. Free Rad. Biol. Med. 1998;25:72–78. doi: 10.1016/s0891-5849(98)00039-2. [DOI] [PubMed] [Google Scholar]
- 16.Bensebaa F, Andre JJ. J. Phys. Chem. 1992;96:5739–5745. [Google Scholar]
- 17.Bensebaa F, Petit F, Andre JJ. Synth. Met. 1992;52:57–69. [Google Scholar]
- 18.Ilangovan G, Li H, Zweier JL, Kuppusamy P. J. Phys. Chem. B. 2001;105:5323–5330. [Google Scholar]
- 19.Liu KJ, Gast P, Moussavi M, Norby SW, Vahidi N, Walczak T, Wu M, Swartz HM. Proc. Natl. Acad. Sci. U. S. A. 1993;90:5438–5442. doi: 10.1073/pnas.90.12.5438. [DOI] [PMC free article] [PubMed] [Google Scholar]
- 20.Pandian RP, Dolgos M, Dang V, Sostaric JZ, Woodward PM, Kuppusamy P. Chem. Mater. 2007;19:3545–3552. [Google Scholar]
- 21.Pandian RP, Kim Y, Woodward PM, Zweier JL, Manoharan PT, Kuppusamy P. J. Mater. Chem. 2006;16:3609–3618. [Google Scholar]
- 22.Pandian RP, Parinandi NL, Ilangovan G, Zweier JL, Kuppusamy P. Free Rad. Biol. Med. 2003;35:1138–1148. doi: 10.1016/s0891-5849(03)00496-9. [DOI] [PubMed] [Google Scholar]
- 23.Sostaric JZ, Pandian RP, Weavers LK, Kuppusamy P. Chem. Mater. 2006;18:4183–4189. [Google Scholar]
- 24.Bratasz A, Pandian RP, Deng Y, Petryakov S, Grecula JC, Gupta N, Kuppusamy P. Magn. Reson. Med. 2007;57:950–959. doi: 10.1002/mrm.21212. [DOI] [PMC free article] [PubMed] [Google Scholar]
- 25.Bratasz A, Pandian RP, Ilangovan G, Kuppusamy P. Adv. Exp. Med. Biol. 2006;578:375–380. doi: 10.1007/0-387-29540-2_58. [DOI] [PubMed] [Google Scholar]
- 26.Kutala VK, Parinandi NL, Pandian RP, Kuppusamy P. Antioxid. Redox Signal. 2004;6:597–603. doi: 10.1089/152308604773934350. [DOI] [PubMed] [Google Scholar]
- 27.Pandian RP, Kutala VK, Liaugminas A, Parinandi NL, Kuppusamy P. Mol. Cell. Biochem. 2005;278:119–127. doi: 10.1007/s11010-005-6936-x. [DOI] [PubMed] [Google Scholar]
- 28.Wisel S, Chacko SM, Kuppusamy ML, Pandian RP, Khan M, Kutala VK, Burry RW, Sun B, Kwiatkowski P, Kuppusamy P. Am. J. Physiol. Heart Circ. Physiol. 2007;292:H1254–1261. doi: 10.1152/ajpheart.01058.2006. [DOI] [PubMed] [Google Scholar]
- 29.Zhao X, He G, Chen YR, Pandian RP, Kuppusamy P, Zweier JL. Circulation. 2005;111:2966–2972. doi: 10.1161/CIRCULATIONAHA.104.527226. [DOI] [PubMed] [Google Scholar]
- 30.Mohan IK, Khan M, Wisel S, Selvendiran K, Sridhar A, Carnes CA, Bognar B, Kalai T, Hideg K, Kuppusamy P. Am. J. Physiol. Heart Circ. Physiol. 2008 doi: 10.1152/ajpheart.00687.2008. [DOI] [PMC free article] [PubMed] [Google Scholar]
- 31.Khan M, Iyyapu KM, Kutala V, Kotha S, Parinandi NL, Hamlin RL, Kuppusamy P. Antioxid. Redox Signal. 2008 doi: 10.1089/ars.2008.2155. [DOI] [PMC free article] [PubMed] [Google Scholar]
- 32.Khan M, Kutala VK, Vikram DS, Wisel S, Chacko SM, Kuppusamy ML, Mohan IK, Zweier JL, Kwiatkowski P, Kuppusamy P. Am. J. Physiol. Heart Circ. Physiol. 2007;293:H2129–2139. doi: 10.1152/ajpheart.00677.2007. [DOI] [PMC free article] [PubMed] [Google Scholar]
- 33.Ilangovan G, Manivannan A, Li H, Yanagi H, Zweier JL, Kuppusamy P. Free Rad. Biol. Med. 2002;32:139–147. doi: 10.1016/s0891-5849(01)00784-5. [DOI] [PubMed] [Google Scholar]
- 34.Manivannan A, Yanagi H. Chem. Lett. 2001:568–569. [Google Scholar]
- 35.Manivannan A, Yanagi H, Ilangovan G, Kuppusamy P. J. Magn. Magn. Mater. 2001;233:L131–L135. [Google Scholar]
- 36.Cava MP, Deana AA, Muth MJ. J. Am. Chem. Soc. 1959;81:6548. [Google Scholar]
- 37.Coelho AA. Topas-Academic. 2004 [Google Scholar]
- 38.David WIF, Shankland K, Shankland N. Chem. Commun. 1998:931–932. [Google Scholar]
- 39.David WIF, Shankland K, van de Streek J, Pidcock E, Motherwell WDS, Cole JC. J. Appl. Crystallogr. 2006;39:910–915. [Google Scholar]
- 40.Pawley GS. J. Appl. Crystallogr. 1981;14:357–361. [Google Scholar]
- 41.Morishige K, Araki K. J. Chem. Soc., Dalton Trans. 1996:4303–4305. [Google Scholar]
- 42.A.I. Materials Studio; San Diego, CA: 2001. [Google Scholar]
- 43.Margadonna S, Prassides K, Iwasa Y, Taguchi Y, Craciun MF, Rogge S, Morpurgo AF. Inorg. Chem. 2006;45:10472–10478. doi: 10.1021/ic060727+. [DOI] [PubMed] [Google Scholar]
- 44.Ilangovan G, Zweier JL, Kuppusamy P. J. Phys. Chem. B. 2000;104:4047–4059. [Google Scholar]
- 45.Dietz RE, Merrit FR, Dingle R, Hone D, Silbernagel BG, Richards PM. Phys. Rev. Lett. 1971;26:1186–1189. [Google Scholar]
- 46.Kuppusamy P, Ramakrishnan BL, Manoharan PT. Proc. Indian Acad. Sci. (Chem. Sci.) 1984;93:977–1001. [Google Scholar]
- 47.Manoharan PT. Proc. Indian Natl. Sci. Acad. 1986;52:715–735. [Google Scholar]
- 48.Gallez B, Jordan BF, Baudelet C. Magn. Reson. Med. 1999;42:193–196. doi: 10.1002/(sici)1522-2594(199907)42:1<193::aid-mrm25>3.0.co;2-c. [DOI] [PubMed] [Google Scholar]
- 49.Goda F, Liu KJ, Walczak T, O'Hara JA, Jiang J, Swartz HM. Magn. Reson. Med. 1995;33:237–245. doi: 10.1002/mrm.1910330214. [DOI] [PubMed] [Google Scholar]
- 50.Turek P, Andre JJ, Moussavi M, Fillion G. Mol. Cryst. Liq. Cryst. 1989;176:535–546. [Google Scholar]
- 51.Chandramouli GVR, Balagopalakrishna C, Rajasekaran MV, Manoharan PT. Comp. Chem. 1996;20:353–358. [Google Scholar]


