Abstract
The accurate simulation of a neuron’s ability to integrate distributed synaptic input typically requires the simultaneous solution of tens of thousands of ordinary differential equations. For, in order to understand how a cell distinguishes between input patterns we apparently need a model that is biophysically accurate down to the space scale of a single spine, i.e., 1 μm. We argue here that one can retain this highly detailed input structure while dramatically reducing the overall system dimension if one is content to accurately reproduce the associated membrane potential at a small number of places, e.g., at the site of action potential initiation, under subthreshold stimulation. The latter hypothesis permits us to approximate the active cell model with an associated quasi-active model, which in turn we reduce by both time-domain (Balanced Truncation) and frequency-domain (ℋ2 approximation of the transfer function) methods. We apply and contrast these methods on a suite of typical cells, achieving up to four orders of magnitude in dimension reduction and an associated speed-up in the simulation of dendritic democratization and resonance. We also append a threshold mechanism and indicate that this reduction has the potential to deliver an accurate quasi-integrate and fire model.
Keywords: Balanced truncation, Krylov methods, Quasi-active, Dendritic democratization, Dendritic resonance, Integrate-and-fire, Compartmental models
1 Introduction
Accurate delineation of the single cell map from synaptic input to membrane potential at the site of action potential initiation requires large, complex models. The size is dictated by synapse density and total dendritic length. With approximately one synapse per micron on a cell with 5 millimeters of dendrite we arrive at 5000 compartments. The complexity arises from both geometric tapering and nonuniform distribution of a variety of channel types. With both transient and persistent Na+ and K+ currents, a low threshold Ca2+ current, a leak current and current activated upon hyperpolarization we reach 10 (1 voltage and 9 gating) equations per compartment. Altogether, we arrive at a coupled system of 50,000 ordinary differential equations.
Wilfrid Rall was the first to build such models and the first to contemplate their systematic reduction. In particular, he showed how cells with symmetric geometry, receiving symmetric synaptic input, satisfying the “3/2” law at each branch point, and possessing passive membranes, could be mapped onto a single straight passive cable (Rall, 1959). Although his assumptions were slightly relaxed by (Schierwagen, 1989) and (Poznanski, 1991), they remain too restrictive to be adopted by the general investigator of synaptic integration. If one is content to reproduce only spike shapes or rates then one can arrive at useful reduced models by simply lumping compartments together. (Bush and Sejnowski, 1993) and (Pinsky and Rinzel, 1994) for example, achieve their ends with merely nine and two compartments, respectively. Both models of course surrender spatial precision of individual synapses.
We here employ old and new tools from the field of linear dynamical systems to reduce models with tens of thousands of equations to models with tens of equations without sacrificing either precise synaptic placement or accuracy of the associated subthreshold membrane potential at the site of action potential initiation.
We begin, in §2, by specifying the full, nonlinear, nonuniform, branched, synaptically driven model. We compute the associated rest potential, linearize the full system about rest, and arrive at what Koch terms the quasi-active system (Koch, 1999). In §3 we apply two distinct methods (one in the time domain, the other, in the frequency domain) of model reduction. They share the ability to reduce the dimension of the “internal” dynamics without compromising the input-output map. In §4 and §5 we test and contrast these two strategies via investigations of both dendritic democratization and dendritic resonance. In §6 we append a threshold mechanism to our reduced model and arrive at a morphologically accurate integrate-and-fire model. We close in §7 with a discussion of limitations and extensions.
2 The Quasi–Active System
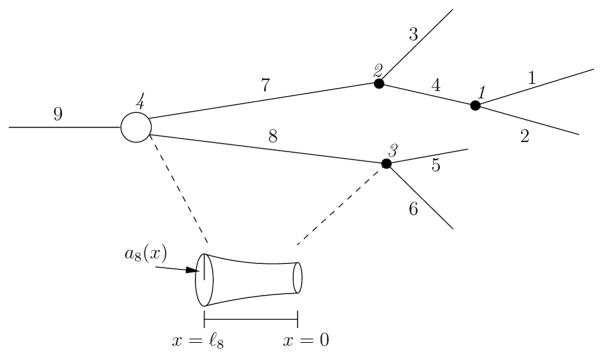
We consider dendritic neurons (see, e.g., Figure 1) with D branched dendrites meeting at the soma. The dth dendrite possesses Bd branches, and so the neuron posseses
Fig. 1.
Example of a toy neuron to demonstrate our labeling scheme. Branches are indexed using the Hines ordering (Hines, 1984), and junctions are labeled with italics. For this cell there are D = 3 dendrites and J = 4 junctions. Our labeling scheme implies, for example, that at junction 3 the children are indexed by and the mother is indexed by
branches. We denote by ℓb the length of branch b and encode its radius, as a function of distance from its distal end, by ab(x). The transmembrane potential along branch b will be denoted by vb(x, t). We assume that the axial resistivity, Ri (kΩ cm), and membrane capacitance, Cm (μF/cm2), are uniform throughout the cell. We suppose that branch b carries C distinct currents, with associated densities, Gbc(x) (mS/cm2) and reversal potentials Ec, c = 1,…, C. The kinetics of current c on branch b are governed by (powers of) the Fc gating variables, wbcf, f = 1, …, Fc. When subjected to input at Sb synapses, these gating variables, together with vb, obey the nonlinear cable equation
| (1) |
| (2) |
Here gbs(t) (nS) is the time course, xbs is the spatial location, and Ebs is the reveral potential of the sth synapse on branch b. In this paper, Ebs = 0 mV.
These branch potentials interact at J junction points, where junction J denotes the soma. At junction j < J we denote by and the branch indices of the two children and by the branch index of the mother. Continuity of the potential at each junction requires
| (3) |
while current balance there requires
| (4) |
Our D dendrites join at the soma and associated branch indices are , d = 1,…, D. Continuity of the potential at the soma then reads
| (5) |
while current balance there requires
| (6) |
| (7) |
where σ is the somatic index and Aσ is the surface area of the soma. Finally, we denote by ℒ the set of leaf indices, where a leaf is a branch with no children. We suppose that each leaf is sealed at its distal end, i.e.,
| (8) |
The somatic voltage is thus . Initially the neuron is at rest, implying that ∂tvb(x, 0) = 0. We permit each synapse to have a tonic conductance ḡbs, as in (Manwani and Koch, 1999), which yields the initial condition gbs(0) = ḡbs. We solve for the rest state and denote it by v̄b(x), and similarly for the gating variables, which yields the initial conditions
| (9) |
| (10) |
Consider (1) for branch b at its resting potential v̄b. Small perturbations to this rest state ought to be well-represented by linear approximations to the differential equations (Koch, 1999). If gbs = ḡbs + εg̃bs(x, t), where ε is small, then the perturbed voltage and gating variables are assumed to be
Substituting these into (1), we construct a linearized model by solving for the perturbation terms ṽb, w̃bcf of order ε. After substitution we find
| (11) |
| (12) |
The initial conditions are now
while boundary conditions, because they are already linear, remain the same as in (3), (4), (8). The soma conditions contain nonlinear terms, but they may be linearized in the same manner as shown here.
Expanding wcf,∞ and τcf in (12) in a Taylor series about v̄b yields the linearized equations for the gating variables
In (11), if the product of gating variables is written as
then differentiating with respect to ε yields
The order 0 and order ε terms of Fbc are
respectively. Hence the linearized ionic currents take the form
The linearized synaptic input in (11) has the form
To complete the linearization process, we equate the terms of order ε and arrive at
where
It is now apparent that this is a linear system for the bth branch, namely
or, more concisely,
| (13) |
We discretize the neuron in space by dividing each branch into γb = ceil(ℓb/h) compartments, where h is some desired step size. The connectivity of the full morphology is encapsulated in the Hines matrix H, which is the spatial discretization of each  b coupled with (3) to (5) and (8) (Hines, 1984). Using the Hines matrix imposes an outside-in ordering of branches and compartments, which leads to minimal fill-in for Gaussian Elimination (Hines, 1984). If m and n denote, respectively, the number of gating variables per compartment and the total number of compartments, i.e.
then the discretized system has N = n(m + 1) variables. Restricting our attention to the bth branch, we compartmentalize the voltage by ṽ:,b ∈ ℝγb, and similarly the gating variables, to obtain
where
For example, if branch b receives synaptic input at xb1 and xb2, then we have
where hb = ℓb/γb is the step size on branch b. This term arises as 1/hb when the delta function is discretized. Gathering the branch and soma equations together we define
and now coupling the branch conditions via the Hines matrix by A = Q + H we arrive at the compartmental model
| (14) |
We view u as the input to the neuron. The neuron’s output, y, is the voltage at the site of initiation of action potentials, which is expressed as
| (15) |
We suppose that the output is the soma potential, formally written as y(t) = zN−m(t). This implies C ∈ ℝ1×N where C = 0 except for the entry C1,N−m = 1. Together (14) and (15) give the standard form for linear dynamical systems, where z is called the state vector, u is the input vector, and y is the observable vector. Our goal is to reduce the dimension of this system while exactly preserving the inputs and without sacrificing accuracy of the soma potential.
3 Model Reduction of the Quasi-Active System
We begin with a classical time-domain method known as Balanced Truncation (BT) and then contrast this with a newer frequency-domain approach deemed the Iterative Rational Krylov Algorithm.
3.1 Balanced Truncation
To balance a linear dynamical system is to transform it into one where the controllability and observability gramians coincide. As a result, and in a rigorous quantitative sense, the states that are difficult to reach are rarely observed. We present the method below. For the early history, and further details and applications, see (Kailath, 1980) and (Antoulas and Sorensen, 2001).
The controllability gramian  and observability gramian
  are defined via
but typically are computed as solutions to the Lyapunov equations
We gather their Cholesky factors
and compute the singular value decomposition of the mixed product
Here Σ is a diagonal matrix whose entries are the eigenvalues of U* U, Z is an orthogonal matrix whose columns are the eigenvectors of U*
 U, and Y is an orthogonal matrix whose columns are the eigenvectors of L*
 L (for details on the SVD, see (Trefethen and Bau, 1997)). The diagonal elements of Σ, are nonnegative and in descending order and are known as the Hankel Singular Values (HSV’s) of the dynamical system described by (14) and (15). We now compose
and note that the transformed gramians
are balanced and diagonal in the sense that
Moreover they are the gramians of the transformed state, ẑ = T z, which itself is governed by the transformed dynamical system as
| (16) |
where  = T AT −1, B̂ = T B, Ĉ = CT−1. Based on the decay of the singular values in Σ, we can construct a reduced model by using only the k largest singular values. This corresponds to approximating (16) with
| (17) |
where  11 is the initial k × k submatrix of Â, B̂1 is the first k rows of B̂, and Ĉ1 is the first k columns of Ĉ.
The reduced state vector ξ ∈ ℝk has no apparent physiological sense until it is fed to the equation for ŷ, but when k ≪ n the computational savings from this model reduction is great. Moreover, contrary to the brute force approach of compartment coarsening, we have not sacrificed the rich input structure. In §4.1 we demonstrate that the system in (17) allows for numerically exact (near machine precision) reproduction of the soma potential computed from the quasi-active system in a fraction of the time.
3.2 The Iterative Rational Krylov Algorithm
For small systems, Balanced Truncation is a clean, precise, and feasible method, but as the system dimension grows the cost of computing the gramians becomes prohibitive. Since the reduction comes after the gramians have been computed, this requires storage of dense N × N matrices before the reduction step, meaning that memory is also an issue.
Krylov methods, on the other hand, construct approximate reduced systems of a given dimension from the beginning. Instead of transforming the original system and then truncating, the Krylov process iteratively projects the dynamics of the original system onto a smaller subspace. This reduces the memory requirements significantly, since only matrix-vector products are used, and in turn drastically speeds up the reduction process. We now describe the main ideas behind this algorithm; for full details see (Gugercin et al., 2008).
Consider the quasi-active system given in (14) and (15). We construct two matrices, Vk, Wk ∈ ℝN×k such that z (t) = Vkξ(t) for some ξ(t) ∈ ℝk and such that
| (18) |
and
| (19) |
From (19) we see that is invertible. Hence we can use (18) to construct a reduced model
| (20) |
where
| (21) |
The reduced-order system is computed by finding Vk and Wk so that the L2-norm of the error between the transfer functions of the original and reduced systems along the imaginary axis is minimized, i.e. we solve the optimization problem
One strategy for solving this is to interpolate the full transfer function, to first order, at the negative of each of its poles. Since these poles are not generally known a priori and may be hard to compute, we make an initial guess and then iterate until convergence, indicating that we have arrived at the reduced system. This is achieved in a computationally efficient manner via the Iterative Rational Krylov Algorithm (IRKA), whose implementation details we do not discuss here but are found in (Gugercin et al., 2008).
4 Balanced Truncation Model Reduction Results
We have written a MATLAB suite of functions that loads morphology and channel kinetics and distributions, constructs the associated quasi-active system and both its BT and IRKA reductions, and computes and displays the response of the 4 (nonlinear, quasi-active, BT, IRKA) models to random (in space and time) sequences of synaptic input. These codes are available from the authors upon request. All computations were performed on a Sun Ultra 20 computer with a 2.2 GHz AMD Opteron processor.
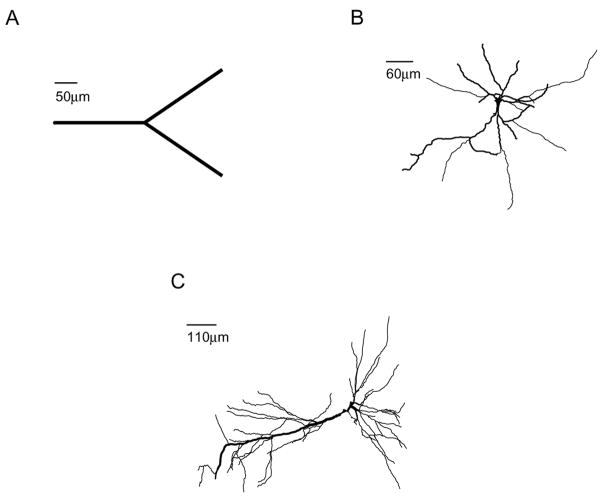
Morphologies, shown in Figure 2, were obtained from the Rice-Baylor archive (Martinez) and from NeuroMorpho.org (http://NeuroMorpho.org) (Ascoli, 2006), and then imported to our software suite, which lets the user visualize and simulate the neuron via GUI’s. Pyramidal and interneuron ion channel models were obtained from the literature and from ModelDB (http://senselab.med.yale.edu/modeldb) (Hines et al., 2004), as detailed in Tables 2 and 3 of the Appendix. Unless otherwise indicated, ḡbs = 0.
Fig. 2.
Renderings of the three morphologies used in this paper: A) a forked neuron; B) cell AR-1-20-04-A, a projection neuron from rat entorhinal cortex (Martinez); C) cell n408, a rat hippocampal cell from region CA1 (Pyapali et al., 1998)
4.1 Dimension Reduction Ratio
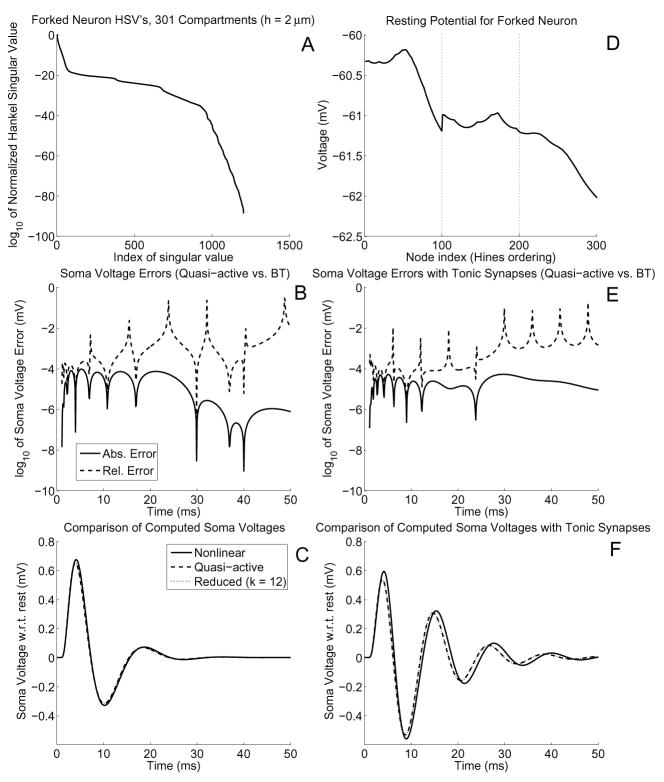
Consider a forked neuron as shown in Figure 2A. Each of the three branches is 200 μm long and is divided into 2 μm-long segments. The root has radius 2 μm while the leaves have radius 1 μm. Ion channels with Hodgkin-Huxley kinetics (see Table 2) were uniformly distributed. This leads to a quasi-active system of dimension 1204. We computed BT matrices and found that the Hankel singular values decay quite rapidly (Figure 3A). Indeed, σn < εmach for n > 65, indicating that a reduction of at least 20-fold can be obtained. Numerically we observe in Figure 3B that, compared to the computed quasi-active soma potential, nearly 5 digits of accuracy can be obtained using only 12 HSV’s, a reduction of fully two orders of magnitude. The BT dynamics also track the dynamics of the soma potential from the nonlinear system qualitatively well, though the error is larger (Figure 3C).
Table 2.
Uniform channel model and kinetics, which corresponds to the Hodgkin-Huxley squid giant axon parameters at 6.3°C (Hodgkin and Huxley, 1952)
| Ionic Current | Gating Variables | G(x) (mS/cm2) | E(mV) |
|---|---|---|---|
| Leak | 0.3 | −54.3 | |
| INa | m3, h | 120 | 56 |
| IK | n4 | 36 | −77 |
| Gating Var. | α | β | τ | ω∞ | ||||
|---|---|---|---|---|---|---|---|---|
| m |
|
4exp(−(v+65)/18) |
|
|
||||
| h | 0.07exp(−(v+65)/20) |
|
|
|
||||
| n |
|
|
|
|
Fig. 3.
A) Hankel singular values for the forked neuron given a 2 μm compartment size. Since there are 301 compartments, and the HH ion channels have 3 gating variables, the quasi-active system has 1204 variables, hence the BT system has the same number of HSV’s. B) Absolute and relative errors between the computed soma potentials of the quasi-active and BT systems. C) Computed soma potentials from the nonlinear, quasi-active, and BT simulations. At the 1 ms mark a 1 nS alpha-function synaptic input with time constant τ = 1 ms was applied to the midpoint of the top distal branch. Notice that the quasi-active and BT curves are indistinguishable. D) Resting potential of each node for the forked neuron with 10% tonic synapses of ḡbs = 0.2 nS each. In the absence of tonic synapses, each node is at rest at ≈ −64.9186 mV. The faint dotted line indicates the end of a branch. E–F) Same as (B–C), but for the case of tonic synapses. Notice that tonic synapses induce more oscillations for the exact same stimulus
Tonic synapses have a significant effect on the dynamics, but no effect on the accuracy of the reduced model versus the quasi-active one. We demonstrate the impact of tonic synapses by randomly choosing 10% of the compartments to have tonic components ḡbs = 0.2 nS, which changes the rest potential of the neuron from a uniform value of ≈ −64.9186 mV to one that is now spatially-varying and elevated (Figure 3D). Using the exact same stimulus as used for Figure 3B–C, we find that the neuron’s output is now more oscillatory, but the reduced system’s accuracy is unchanged (Figure 3E–F).
Computing the BT matrices required about 72 seconds, while the 30 ms simulation required only 0.02 seconds. At first glance this appears expensive when compared to the nonlinear and quasi-active simulation times, both requiring about 1.3 seconds. However, the BT matrix computation is a one-time cost, since these matrices can now be reused to facilitate simulation with their associated morphology.
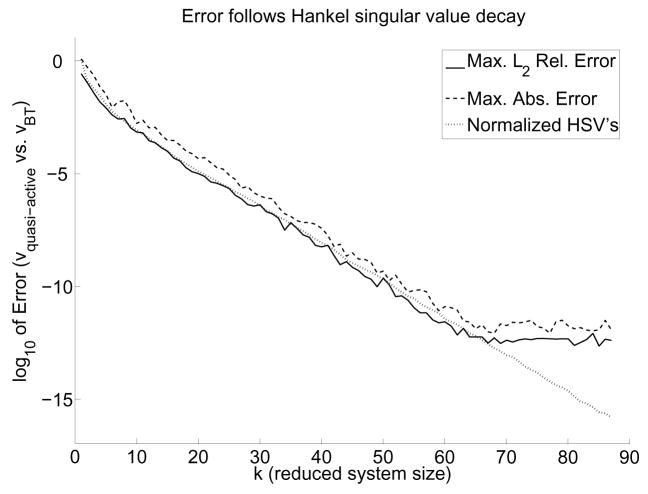
In fact, it can be seen that the decay of the normalized Hankel singular values almost directly corresponds with the numerical accuracy achieved, as Figure 4 illustrates on a more realistic neuron. This result is not surprising, however, given that an error bound exists for BT model reduction (Antoulas and Sorensen, 2001). Therefore, the normalized Hankel singular values may be used as a reliable guide to achieving any desired numerical accuracy compared to the quasi-active system.
Fig. 4.
Simulations demonstrate converging accuracy for the quasi-active versus reduced system. We used the neuron of Figure 2B with the nonuniform channel model of Table 3. The discretized neuron had 1121 compartments, leading to a 6726-dimensional system. For each reduced system size k, we performed 10 simulations of 50 ms each with 35 random alpha-function synaptic inputs for which ĝ bs ∈ [0, 2].
4.2 Application to Synaptic Scaling
An immediate application for such low-dimensional systems is to accurately quantify how synaptic input scales with distance to the soma, also known as “dendritic democratization” (Magee and Cook, 2000) (Häusser, 2001) (Timofeeva et al., 2008). One standard form of synaptic input is an alpha function, which describes the input onto synapse s of branch b as
| (22) |
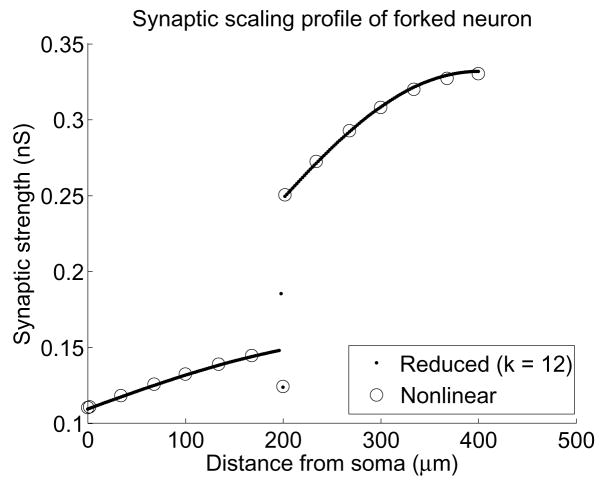
where tstart is the time (in ms) of stimulus onset, and the time constant τ = 1 ms is the time at which the conductance reaches its maximum value of ĝbs. In order to know the strength required for a single synaptic input at a given location to produce a peak target depolarization at the soma, we need to run a parameter sweep for ĝbs. Using the reduced system on the forked neuron with the uniform channels of Table 2, we execute the bisection method with a tolerance of 10−8 to obtain values for each compartment, shown in Figure 5, in a total of 4.7 minutes. By contrast, the nonlinear system would require about 100 minutes to do the same.
Fig. 5.
Strengths ĝbs of alpha-function synaptic input needed at each compartment to get a 0.2 mV peak soma depolarization. Dots were computed using the BT system, while circles were computed using the nonlinear system. Notice that the conductance on the root branch increases slowly with increasing distance from the soma, but at the branch point this trend splits. The large difference at the junction occurs because of the disjoint radii of the root branch and the child branches. Only one distinct set of points can be seen from 200–400 μm because the child branches are identical
For more realistic morphologies, and more complex channel models, the one-time cost of computing the BT matrices grows as  (n3), but the speed-up gained from using the resulting reduced system is substantial. As an example, neuron AR-1-20-04-A (see Figure 2B) was discretized into 1121 compartments, each with length ≈ 2 μm. We included INa and IK currents following Hodgkin-Huxley kinetics, and used Connor-Stevens kinetics (see Table 3) (Connor and Stevens, 1971) for the A-type K+ current IA whose spatial distribution followed that suggested by (Hoffman et al., 1997). The resulting system had 5 gating variables per compartment, and hence the dimension of the linearized system was 6726. The BT matrices were computed in about 4.6 hours, and setting k = 25 we obtained a reduced system that was 269× smaller than the original linearized system and accurate to more than 5 digits.
Table 3.
Non-uniform channel model and kinetics. INa and IK use Hodgkin-Huxley type kinetics, while IA uses Connor-Stevens type kinetics and a spatial distribution of conductance based on Hoffman’s work. For G(x), x is measured in μm from the soma. Note that the IA channel kinetics do not have α and β functions explicitly defined (Connor and Stevens, 1971) (Hoffman et al., 1997)
| Ionic Current | Gating Variables | G(x) (mS/cm2) | E(mV) | |
|---|---|---|---|---|
| Leak | 0.3 | −47 | ||
| INa | m3, h | 60 | 55 | |
| IK | n4 | 20 | −72 | |
| IA | a3, b |
|
−75 |
| Gating Var. | α | β | τ | ω∞ | |||
|---|---|---|---|---|---|---|---|
| m |
|
15.2exp(−0.0556(v+54.7)) |
|
|
|||
| h | 0.266exp(−0.05(v+48)) |
|
|
|
|||
| n |
|
0.25exp(−0.0125(v + 55.7)) |
|
|
| Gating Var. | τ | ω∞ | ||
|---|---|---|---|---|
| a |
|
|
||
| b |
|
|
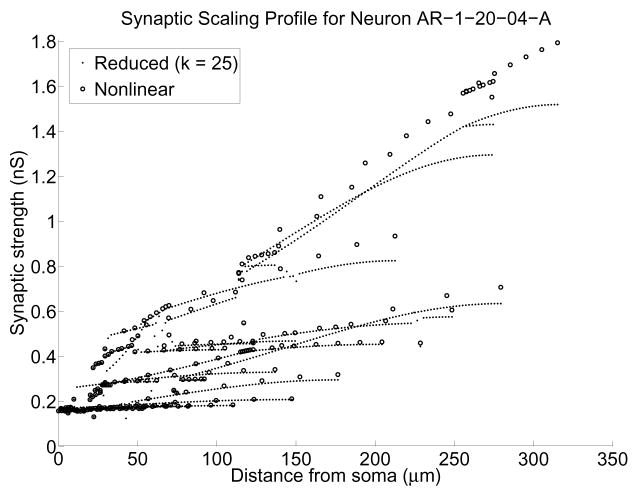
Using this reduced model, we executed a parameter sweep for ĝ bs for each compartment, taking a total of 42 minutes. To compare the output to that of the nonlinear model, we did a sweep for 7 compartments in each branch, taking 268 total minutes. The results indicate (see Figure 6) that the reduced system accurately tracked the scaling of proximal synaptic inputs while underestimating the scaling for distal conductances. The error in the distal computations is not due to our reduction scheme but rather to our initial quasi-active hypothesis. Regarding Figure 6, a value of ĝbs for every compartment was obtained using the reduced model, whereas to do so for the active model would have required about 21 hours. Hence, to obtain a full portrait of synaptic scaling for this neuron, even factoring in the cost of computing the BT matrices, the reduced system offers a factor of 4 speed-up.
Fig. 6.
Strengths ĝbs of alpha-function synaptic input needed at each compartment of neuron AR-1-20-04-A to get a 0.2 mV soma depolarization using the BT method. Dots were computed using the reduced system, while circles were computed using the nonlinear system. The reduced system size was k = 25
4.3 Application to Dendritic Resonance
Neurons have been shown to respond preferentially to stimuli occurring at specific frequencies (Hutcheon and Yarom, 2000) (Hasselmo et al., 2007) (Ulrich, 2002), and quantifying how this resonant frequency varies with stimulus location is a difficult experimental task. However, our reduced model is well-suited to this type of simulation.
Acquiring the resonant frequency data is time-consuming if high frequency resolution is desired. Typical experimental studies stimulate the cell with a ZAP current, which has the form
| (23) |
for some constants a, b, c, and d, with t in ms. The resonant frequency can then be obtained by dividing the Fourier transform of the voltage by the Fourier transform of the input current (Puil et al., 1986). However, this limits the frequency resolution unless very long or detailed simulations are performed. On the other hand, brute force methods give better resolution, but are slow because require many simulations to be performed using oscillatory currents, such as
| (24) |
where I0 is the peak amplitude, t̂ is the time of stimulus onset (in ms), and ω is the frequency (in Hz).
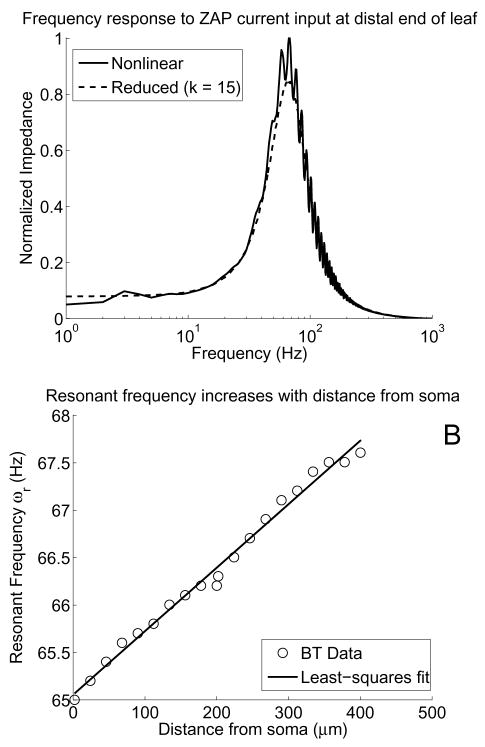
Our reduced model is useful here because we can use the ZAP current to get a band in which the resonant frequency ωr may be and then run a brute-force search to pinpoint this value, all in much less time than the full system requires. For example, using the ZAP current in (23) with parameters a = 50, b = 10−6, and c = 3, we find that the forked neuron with uniform channels has a definite peak near 65 Hz (see Figure 7A). Refining this estimate via a brute-force search using (24) in a small interval around this peak reveals that ωr increases linearly as distance from the soma increases.
Fig. 7.
A) Frequency-response curves for ZAP current injection at different dendritic locations on the forked neuron with uniform channels. We applied ZAP current for 1000 ms with timestep Δt = 0.1 ms and computed the normalized impedance versus frequency. Both curves show the same trend, with a peak near 65 Hz, but the reduced system took only 2 seconds, whereas the nonlinear system took 39 seconds. B) Scatter plot of resonant frequencies versus distance from the soma (○), with the least-squares linear fit to the data (thick line). For this experiment, we sampled frequencies every 0.1 Hz on the interval [55, 75] using the current in (24) and found that the resonant frequency increases nearly linearly as the stimulus location moves away from the soma
5 IRKA Model Reduction Results
With the BT method as a benchmark, we test the model reduction technique based on using IRKA. First we demonstrate typical convergence of IRKA for our problems, and then we show that cells of much larger dimension can be tackled.
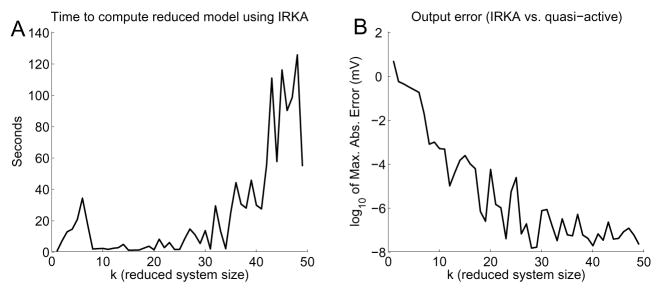
Consider neuron AR-1-20-04-A from Figure 2B. We compute the maximum absolute error in the soma voltage between the quasi-active and reduced systems using IRKA (Figure 8B), and we compare this to the error curve shown in Figure 4A. Notice that nearly 5-digit agreement occurs for a 25-dimensional system using IRKA. This is close to what we would expect from the BT method (20-dimensional system), but IRKA required only 5 seconds to compute the reduced system (Figure 8A), whereas BT required 4.6 hours. Thus similar accuracy with IRKA can be obtained in a fraction of the time needed for BT. Notice that although the error in IRKA as k increases is not as smooth of a trend as that of BT, nor does the error decrease as rapidly, the accuracy is more than enough for neuroscience applications.
Fig. 8.
A) Time to compute reduced system, and B) maximum absolute error between quasi-active and reduced system output using IRKA for cell AR-1-20-04-A (N = 6726)
The main difference between IRKA and BT is that IRKA computes a system of a given size, whereas BT computes full matrices that are then truncated to the desired size. If a reduced system of a different size is desired, IRKA must recompute the matrices, whereas BT can just truncate. But the premium we pay for immediate BT changes is far too expensive, considering that IRKA’s results are just as good but are obtained in a fraction of the time. As an example, the reduced system from IRKA with k = 20 was used to run the same dendritic democratization parameter sweep as in Figure 6. The computed synaptic conductances for the BT and IRKA systems agree to nearly 5 digits for each compartment, indicating that IRKA is indeed computing the right reduced system.
A clear advantage of IRKA is that it handles systems of much larger dimension than BT. We could not use BT for systems where N > 7000, due to lack of memory, and even if we could, the computation time would preclude any practical use for such large systems. IRKA does not suffer from this drawback, which translates into the ability to compute reduced models of cells with much finer discretizations and to reduce cells with much more complex dendritic structure.
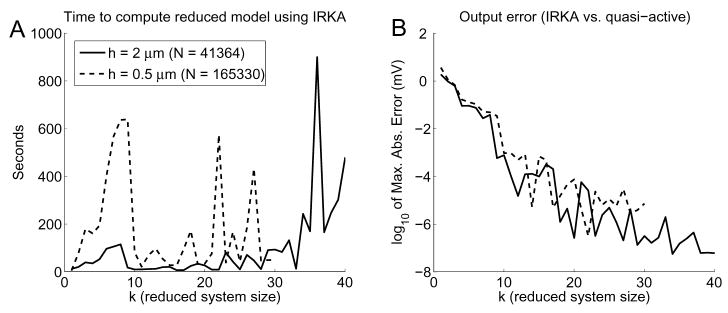
As an example, we consider neuron n408 (Figure 2C), a rat hippocampal cell from region CA1 (Pyapali et al., 1998). We use a 2 μm spatial discretization, yielding 6894 compartments. With a Connor-Stevens ion channel model this gives a total linear system size of N = 41364. Using IRKA we find that 5 digits of accuracy can be obtained using a system of dimension k ≈ 15, which is a 2700-fold reduction, or more than 3 orders of magnitude, in less than a minute (see Figure 9). If we use a finer discretization of h ≈ 0.5 μm, we arrive at a system of size N = 165330. IRKA produces a 15-dimensional system that is accurate to nearly 5 digits, a monstrous 11000-fold reduction, or 4 orders of magnitude!
Fig. 9.
A) Time to compute the reduced system, and B) maximum absolute error between the quasi-active and reduced system output using IRKA on cell n408. Solid lines correspond to the N = 41364 case, while dashed lines are for the N = 165330 case. In (A) the sudden drop in computation time around k = 10 occurs for both cases because at that point, though the shifts have not converged, the reduced system is accurate to a tolerance of 3 digits or more
6 A Quasi-Integrate-and-Fire Model
Quasi-active neuron models cannot spike, but adopting an integrate-and-fire (IAF) mechanism allows such models to emulate this behavior. Under our assumption that the soma is the site of action potential generation, we only need to check whether
| (25) |
where Vth is some threshold voltage (recall that ). At each timestep during the simulation we check if threshold was reached, and if so then we instantaneously reset the soma voltage to the rest and hold it there for a refractory period of τref ms.
6.1 Thresholding at the Soma
Reset values should be chosen to produce as much similarity as possible between the outputs of the active and quasi-active models while still being biophysically reasonable. However, the state variables of the reduced system do not have biophysical significance until transformed into the observable ŷ(t). This implies our choice of rest as the reset value for ξ(t).
Using the forked neuron as our test case, we implement the IAF mechanism using the non-uniform channel model. We discretized using h ≈1 μm so that the nonlinear model had 3606 variables; IRKA computed a reduced model having only 10 variables. First we simulate using the nonlinear system, and then we compare this to the output from the reduced system simulation. The spikes generated from both systems are compared to determine if there are any matches. A match is said to occur when the reduced system’s spike occurs within τref ms before or after a spike in the nonlinear system.
In order to quantify how well the mechanism captures spiking behavior, we compute the coincidence factor Γ (Kistler et al., 1997) (Jolivet et al., 2006), defined as
| (26) |
where Nnonlin and Nreduced are the number of spikes in the nonlinear and reduced models, respectively, and T is the length of the simulation. The coincidence factor measures how close the spike train from the reduced model approximates that of the nonlinear model by comparing the number of coincident spikes, Ncoinc, with the number of coincident spikes occurring by chance. Γ is scaled to ensure that Γ = 1 implies the spike trains are equal and Γ = 0 implies the spike trains would occur purely by chance.
However, Γ can be quite low even when most spikes from the reduced system are coincident. Thus, to better evaluate the effect of false positives, we introduce two metrics: percentage matched, which is the number of spikes from the nonlinear system that are also found in the reduced system; and percentage mismatched, which is how many spikes from the reduced system do not match any spikes from the nonlinear system:
| (27) |
| (28) |
We vary Vth between 8 and 20 mV, with at least 20 simulations at each threshold value, and we use τref = 4 ms throughout. Each simulation lasts 1000 ms, during which alpha-function synaptic inputs arrive at random locations and at random times.
We ran two sets of simulations to assess the effect of low- and high-activity inputs. The low-activity set used 250 “strong” inputs per simulation, while the high-activity one used 1250 “weak” inputs. These inputs are realistically calibrated by computing ĝbs values for the reduced system (as in §4.2). These values are scaled to obtain synaptic conductances at each compartment that would give approximately 3 mV depolarizations at the soma for the strong inputs, but only 1 mV depolarizations for the weak ones, which agrees with typical values in Chapter 3 of (Traub and Miles, 1991) and (Thomson and Lamy, 2007).
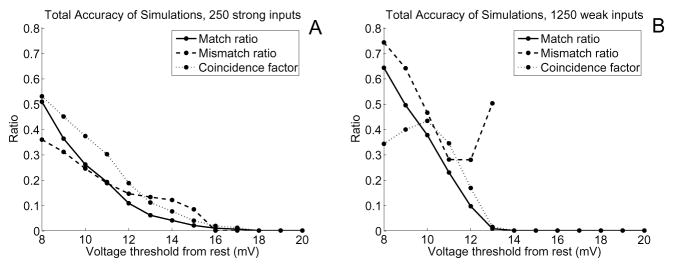
As shown in Figure 10, low thresholds capture a large number of the nonlinear spikes, but also yield more mismatched spikes. Fewer mismatched spikes occur as Vth increases, but this also leads to greatly diminished numbers of spikes generated, and hence fewer nonlinear spikes captured. More mismatched spikes were observed in the “weak” input simulations, but more spikes were matched as well. The coincidence factors were also low for these simulations, reaching a peak of 0.43 at Vth = 10 mV for the “weak” input case and a peak of 0.52 at Vth = 8 mV for the “strong” input case.
Fig. 10.
Ratio of matched and mismatched spikes, as well as coincidence factor, as Vth increases for A) 250 “strong” inputs and B) 1250 “weak” inputs per simulation. For each Vth value we used τref = 4 ms and ran at least 20 simulations of 1000 ms with alpha-function synaptic inputs to random locations. Ratios are given for the match and mismatch values rather than percentages for ease of comparison with Γ
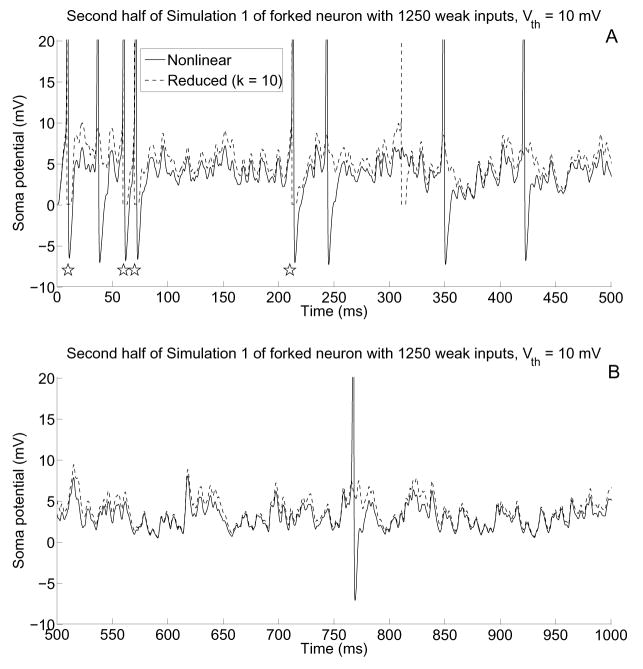
The spike data is shown explicitly in the soma potentials of Figure 11. It is evident from these plots that the reduced system captures the subthreshold behaviors very well even for large depolarizations. Furthermore, the spike times computed by the reduced system tend to be very close to the actual spike times.
Fig. 11.
A–B) Soma potentials corresponding to the first and second halves of simulation 1 of the “weak” input case using Vth = 10 mV. Note that the reduced system spikes are drawn for clarification, and that the voltage axis has been scaled so that subthreshold behavior is more easily seen. Subthreshold behavior is of the nonlinear model is captured well by the reduced model, especially when less firing occurs, and stars below spikes in (A) indicate that four spikes have been captured by the reduced model
6.2 Thresholding at Multiple Sites
Of course one has no right to expect high accuracy when applying supra-threshold stimuli to a sub-threshold model. Nonetheless, there are a number of means by which our crude mechanism may be improved. If we fail to detect a somatic spike because it was generated in the dendrite, then it may pay to build the reduction in order that it accurately tracks the quasi-active response at several, say p, distinct locations.
Proper investigation of this issue would address the questions of optimal placement of p observers, placement and calibration of threshold mechanisms at each site, and the trade of accuracy for speed as p is increased. We offer here only empirical evidence that such an investigation is indeed warranted.
In particular, we apply a multi-site IAF mechanism to the forked neuron subject to the same input streams that generated Figure 10. Since there are 3 branches and a soma, we set p = 4 and designate as observables the voltages at the soma and the midpoints of each branch. Threshold values are Vth = 22 mV at the leaf midpoints, Vth = 16 mV at the root midpoint, and Vth = 14 mV at the soma (these values were chosen after manual trial-and-error). Using the same discretization as in §6.1, IRKA computes a reduced model with k = 40 that is accurate to nearly 5 digits, and hence Ak ∈ ℝ40×40, Bk ℝ40×61, and Ck ∈ ℝ4×40.
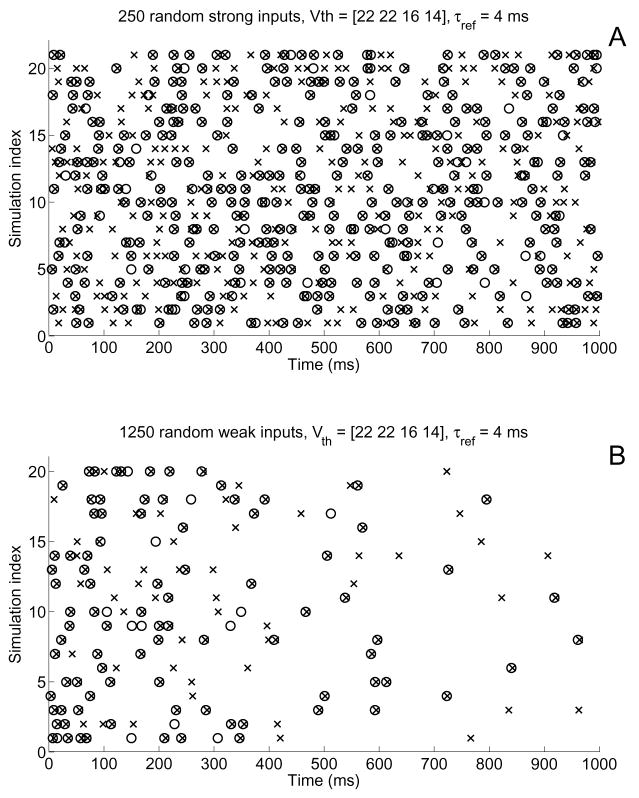
Using the same input patterns as above, we find a significant increase in the accuracy of the spiking behavior (see Figure 12) with very little change in computational cost. For the strong input case we match 56% of the actual spikes and have only a 15% mismatch rate. For the weak input case, we get 65% matched with 13% mismatched. The coincidence factor improves in both cases: from 0.43 to 0.73 for the “weak” input case, and from 0.52 to 0.66 for the “strong” input case. Moreover, the difference in simulation time was negligible when compared to the thresholding mechanism of §6.1.
Fig. 12.
Raster diagrams showing spikes computed for the nonlinear system (×’s) and the reduced system (○’s) for A) “strong” and B) “weak” input cases demonstrate that a variable-threshold, multi-site IAF mechanism improves accuracy of spike generation. The same input patterns as used for Figure 10 were applied to the forked neuron, but this time voltages were observed at the soma and the midpoints of each branch. Threshold values are given in §6.2. In total, the “strong” and “weak” input simulations had match scores of 56% and 65%, respectively, and mismatch scores of 15% and 13%, respectively
Rather than simple thresholding we note that a number of investigations of single compartment models have achieved better spike capturing by incorporating more sophisticated firing mechanisms. For example, (Fourcaud-Trocmé et al., 2003) includes a voltage-dependent exponential term, while (Jolivet et al., 2006) and (Brette and Ger-stner, 2005) consider adaptive thresholding. For the class of morphologies and channel distributions of the previous sections, adaptive thresholding, in our hands, did not produce a significant improvement in spike accuracy. Regarding the implementation of exponential integrate-and-fire we note that there is not a natural means by which to nonlinearize our reduced quasi-active system. More precisely, as we observed at the close of §3.1, the reduced state ξ in (17) is governed by the small but dense pair Â11 and B̂1 and hence reflects a complex combination of thousands of gating and voltage variables. The physiological soma potential does not surface until after multiplication by Ĉ1. As such there is not a distinguished voltage term in the differential equation for ξ to which one might apply a biophysically inspired firing mechanism.
7 Discussion
We have applied two distinct methods to the reduction of dimension of large scale single neuron models. We have demonstrated that in typical settings one may reduce models with tens of thousands of variables to models with merely tens of variables that still accurately track the somatic subthreshold response of spatially distributed synaptic inputs. In regimes where subthreshold stimuli dominate, such as questions of (proximal) dendritic democratization and resonance, our reduced model reveals in minutes what the full models require hours or days to simulate. Although there is no reason to trust our subthreshold integrator on suprathreshold stimuli, we have demonstrated that simply thresholding the reduced voltage at a number of observation points has the potential to capture the cell’s full spiking behavior. Further refinement of this approach holds the promise of bringing morphological specificity to the large scale network contributions of (Rudolph and Destexhe, 2006) with significantly fewer compartments than the approach proposed by (Markram, 2006).
Table 1.
A multi-site variable-threshold IAF mechanism improves spike-capturing accuracy
| Input scheme | Nnonlin | Nreduced | % Matched | % Mismatched | Γ |
|---|---|---|---|---|---|
| 1250 weak | 136 | 101 | 64.7 | 12.9 | 0.73 |
| 250 strong | 582 | 385 | 56.2 | 15.1 | 0.66 |
Acknowledgments
The work in this paper is supported through the Sheafor/Lindsay Fund via the ERIT program at Rice’s Computer and Information Technology Institute CITI, NSF grant DMS-0240058, and NIBIB Grant No. 1T32EB006350-01A1
A Appendix
The following tables contain all the information pertaining to the ion channels and gating variable kinetics used in this paper. Table 2 is for the uniform channel model, which uses the Hodgkin-Huxley squid giant axon parameters. Table 3 is for the non-uniform channel model, whose non-uniformity comes from an A-type K+ current following Connor-Stevens kinetics and consistent with the graded channel distribution of (Hoffman et al., 1997).
References
- Antoulas AC, Sorensen DC. Approximation of large-scale dynamical systems: An overview. International J of Applied Math and Computer Science. 2001;11(5):1093–1121. [Google Scholar]
- Ascoli GA. Mobilizing the base of neuroscience data: the case of neuronal morphologies. Nature Reviews Neuroscience. 2006;7:318–324. doi: 10.1038/nrn1885. [DOI] [PubMed] [Google Scholar]
- Brette R, Gerstner W. Adaptive exponential integrate-and-fire model as an effective description of neuronal activity. J Neurophysiology. 2005;94:3637–3642. doi: 10.1152/jn.00686.2005. [DOI] [PubMed] [Google Scholar]
- Bush PC, Sejnowski TJ. Reduced compartmental models of neocortical pyramidal cells. J Neurosci Methods. 1993;46:159–166. doi: 10.1016/0165-0270(93)90151-g. [DOI] [PubMed] [Google Scholar]
- Connor JA, Stevens CF. Inward and delayed outward membrane currents in isolated neural somata under voltage clamp. J Physiol. 1971;213:1–19. doi: 10.1113/jphysiol.1971.sp009364. [DOI] [PMC free article] [PubMed] [Google Scholar]
- Fourcaud-Trocmé N, Hansel D, van Vreeswijk C, Brunel N. How spike generation mechanisms determine the neuronal response to fluctuating inputs. J Neurosci. 2003;23:11628–11640. doi: 10.1523/JNEUROSCI.23-37-11628.2003. [DOI] [PMC free article] [PubMed] [Google Scholar]
- Gugercin S, Antoulas A, Beattie C. ℋ2 model reduction for large-scale linear dynamical systems. SIAM J on Matrix Analysis and Applications. 2008;30:609–638. [Google Scholar]
- Hasselmo ME, Giocomo LM, Zilli EA. Grid cell firing may arise from interference of theta frequency membrane potential oscillations in single neurons. Hippocampus. 2007;17:1252–1271. doi: 10.1002/hipo.20374. [DOI] [PMC free article] [PubMed] [Google Scholar]
- Häusser M. Synaptic function: Dendritic democracy. Current Biology. 2001;11:R10–R12. doi: 10.1016/s0960-9822(00)00034-8. [DOI] [PubMed] [Google Scholar]
- Hines M. Efficient computation of branched nerve equations. International J of Bio-Medical Computing. 1984;15:69–76. doi: 10.1016/0020-7101(84)90008-4. [DOI] [PubMed] [Google Scholar]
- Hines ML, Morse T, Migliore M, Carnevale NT, Shepherd GM. Modeldb: A database to support computational neuroscience. J Comput Neurosci. 2004;17:7–11. doi: 10.1023/B:JCNS.0000023869.22017.2e. [DOI] [PMC free article] [PubMed] [Google Scholar]
- Hodgkin AL, Huxley AF. A quantitative description of membrane current and its application to conduction and excitation in nerve. J Physiol. 1952;117:500–544. doi: 10.1113/jphysiol.1952.sp004764. [DOI] [PMC free article] [PubMed] [Google Scholar]
- Hoffman DA, Magee JC, Colbert CM, Johnston D. K+ channel regulation of signal propagation in dendrites of hippocampal pyramidal neurons. Nature. 1997;387:869–875. doi: 10.1038/43119. [DOI] [PubMed] [Google Scholar]
- http://NeuroMorpho.org/. The neuromorpho.org inventory. Accessed March 11, 2008. http://NeuroMorpho.org/
- http://senselab.med.yale.edu/modeldb/. Senselab modeldb. Accessed March 11, 2008. http://senselab.med.yale.edu/modeldb/
- Hutcheon B, Yarom Y. Resonance, oscillation and the intrinsic frequency preferences of neurons. Trends Neurosci. 2000;23:216–222. doi: 10.1016/s0166-2236(00)01547-2. [DOI] [PubMed] [Google Scholar]
- Jolivet R, Rauch A, Lüscher HR, Gerstner W. Predicting spike timing of neocortical pyramidal neurons by simple threshold models. J Comput Neurosci. 2006;21:35–49. doi: 10.1007/s10827-006-7074-5. [DOI] [PubMed] [Google Scholar]
- Kailath T. Linear Systems. Prentice Hall; 1980. [Google Scholar]
- Kistler WM, Gerstner W, van Hemmen JL. Reduction of the hodgkin-huxley equations to a single-variable threshold model. Neural Computation. 1997;9:1015–1045. [Google Scholar]
- Koch C. Biophysics of Computation. Oxford University Press, Inc; 1999. [Google Scholar]
- Magee JC, Cook EP. Somatic epsp amplitude is independent of synapse location in hippocampal pyramidal neurons. Nat Neurosci. 2000;3:895–903. doi: 10.1038/78800. [DOI] [PubMed] [Google Scholar]
- Manwani A, Koch C. Detecting and estimating signals in noisy cable structures, I: Neuronal noise sources. Neural Computation. 1999;11:1797–1829. doi: 10.1162/089976699300015972. [DOI] [PubMed] [Google Scholar]
- Markram H. The blue brain project. Nature Rev Neuroscience. 2006;7:153–160. doi: 10.1038/nrn1848. [DOI] [PubMed] [Google Scholar]
- Martinez JO. [Accessed May 1, 2008];Rice-baylor archive of neuronal morphology. http://www.caam.rice.edu/~cox/neuromart.
- Pinsky PF, Rinzel J. Intrinsic and network rhythmogenesis in a reduced Traub model for CA3 neurons. J Comput Neurosci. 1994;1:39–60. doi: 10.1007/BF00962717. [DOI] [PubMed] [Google Scholar]
- Poznanski R. A generalized tapering equivalent cable model for dendritic neurons. Bulletin of Mathematical Biology. 1991;53(3):457–467. doi: 10.1007/BF02460728. [DOI] [PubMed] [Google Scholar]
- Puil E, Gimbarzevsky B, Miura RM. Quantification of membrane properties of trigeminal root ganglion neurons in guinea pigs. J Neurophysiol. 1986;55:995–1016. doi: 10.1152/jn.1986.55.5.995. [DOI] [PubMed] [Google Scholar]
- Pyapali G, Sik A, Penttonen M, Buzsaki G, Turner D. Dendritic properties of hip-pocampal ca1 pyramidal neurons in the rat: Intracellular staining in vivo and in vitro. J of Comparative Neurology. 1998;391:335–352. doi: 10.1002/(sici)1096-9861(19980216)391:3<335::aid-cne4>3.0.co;2-2. [DOI] [PubMed] [Google Scholar]
- Rall W. Branching dendritic trees and motoneuron membrane resistivity. Experimental Neurology. 1959;1:491–527. doi: 10.1016/0014-4886(59)90046-9. [DOI] [PubMed] [Google Scholar]
- Rudolph M, Destexhe A. Analytical integrate-and-fire neuron models with conductance-based dynamics for event-driven simulation strategies. Neural Computation. 2006;18:2146–2210. doi: 10.1162/neco.2006.18.9.2146. [DOI] [PubMed] [Google Scholar]
- Schierwagen AK. A non-uniform equivalent cable model of membrane voltage changes in a passive dendritic tree. J of Theoretical Biology. 1989;141:159–179. doi: 10.1016/s0022-5193(89)80015-3. [DOI] [PubMed] [Google Scholar]
- Thomson AM, Lamy C. Functional maps of neocortical local circuitry. Frontiers in Neuroscience. 2007;1:19–42. doi: 10.3389/neuro.01.1.1.002.2007. [DOI] [PMC free article] [PubMed] [Google Scholar]
- Timofeeva Y, Cox SJ, Coombes S, Josíc K. Democratization in a passive dendritic tree: an analytical investigation. J Comput Neurosci. 2008;25:228–244. doi: 10.1007/s10827-008-0075-9. [DOI] [PubMed] [Google Scholar]
- Traub RD, Miles R. Neuronal Networks of the Hippocampus. Cambridge University Press; 1991. [Google Scholar]
- Trefethen LN, Bau D. Numerical Linear Algebra. SIAM; 1997. [Google Scholar]
- Ulrich D. Dendritic resonance in rat neocortical pyramidal cells. J Neurophysiol. 2002;87:2753–2759. doi: 10.1152/jn.2002.87.6.2753. [DOI] [PubMed] [Google Scholar]


