

Abstract
The Wistar-Furth (WF) rat is protected against chronic renal disease (CRD) following 5/6th ablation/infarction vs. the Sprague-Dawley (SD) rat, and protection was associated with preserved renal nitric oxide (NO) production. This study examined CRD induced with repeated administration of puromycin aminonucleoside (PAN). SD PAN developed nephrotic range proteinuria (>1 g/24 h), and at 15 wk severe renal injury developed and the glomerular filtration rate (GFR) was reduced to ~10% of sham. Total NO production, renal NO synthase (NOS) activity, and renal neuronal (n) and medullary endothelial (e)NOS abundance were reduced in the SD PAN. WF PAN exhibited less severe initial proteinuria (>400 mg/24 h), which abated within weeks, whereas GFR was normal and injury was minimal at 15 wk. Total NO production and renal NOS activity and abundance were significantly elevated compared with SD PAN. NOS mRNA (nNOS, eNOS, and inducible NOS) was not altered in WF, whereas SD showed significant increases in NOS gene expression with PAN. In conclusion, WF showed resistance to a second model of CRD with maintained renal NOS activity compared with SD.
Keywords: glomerular filtration rate, proteinuria, nitric oxide deficiency
Several lines of investigation suggest that nitric oxide (NO) deficiency is both a cause and consequence of chronic renal disease (CRD) (4). Clinical studies in CRD and end-stage renal disease (ESRD) patients have shown decreased total NO production (32-34). Animal models of CRD have shown decreases in renal NO synthase (NOS) abundance and activity as well as in total NO production (1, 3, 11, 31, 39, 40). Furthermore, chronic NOS inhibition causes proteinuria, renal injury, and glomerular hypertension (45). These studies suggest that a vicious cycle may occur in CRD with NO deficiency, causing further damage and contributing to progression.
Most animal studies have used the 5/6 renal mass reduction model, characterized by early hyperfusion and hyperfiltration in the remnant with developing proteinuria and focal and segmental glomerulosclerosis (FSGS) (20). Fitzgibbon et al. (12) reported that the Wistar-Furth (WF) rat strain shows remarkable resistance to induced CRD by renal mass reduction. We subsequently confirmed this finding and reported that maintained renal NO production is seen in the WF compared with the vulnerable Sprague-Dawley (SD) and appears to be critical in protection against CRD, because low-dose NOS inhibition following ablation/infarction (A/I) in the WF causes severe kidney damage (11).
Another animal model that results in FSGS and CRD is induced by administration of puromycin aminonucleoside (PAN). An initial dose of PAN causes a nephrotic range proteinuria followed by a “recovery” phase, leading to a slowly evolving CRD that resembles human FSGS (2). Repeated injections of PAN result in an accelerated model of CRD (13).
The present study examined the renal NO system in PAN-induced CRD and investigated whether the WF would again exhibit protection against progression of kidney damage leading to CRD together with preserved renal NOS.
METHODS
Studies were conducted in two strains of male rats at 12 wk of age. SD (n = 8) rats were purchased from Harlan Sprague Dawley (Indianapolis, IN), and WF (n = 10) rats were purchased from Charles River. The right jugular was chronically catheterized under full sterile conditions, and immediately following surgery a bolus of PAN (Biomol Research Laboratories, Plymouth Meeting, PA) was given (50 mg/kg) and supplemental intravenous doses were administered at weeks 3, 4, and 5 (20 mg/kg). Sham rats were given 0.9% saline. Twenty-four-hour urine collections were made in control (presurgery) and weekly following the initial bolus of PAN to determine total protein, NO2 + NO3 (NOx), and creatinine excretion. All rats were placed on a low-NOx diet (ICN AIN 76C) 2 days before placement in metabolic cages. Total urine protein was determined using the Bradford assay, and urine NOx was measured via the Greiss reaction as described by us previously (35). Creatinine was measured by HPLC using an assay described earlier (11). Blood pressure (BP) was measured under anesthesia via the aorta just before death, blood was collected (3–5 ml), and tissues were perfused with cold PBS and harvested onto dry ice and then snap-frozen in liquid nitrogen. Plasma NOx and creatinine were determined as above, and blood urea nitrogen (BUN) was measured using a Sigma kit (640-A).
NOS activity was measured from the conversion of l-[3H]-arginine to l-[3H]-citrulline in the kidney cortex and medulla as described by us earlier (44). Briefly, tissues were homogenized in iced homogenization buffer, ultracentrifuged, and both supernatant (soluble) and membrane fractions were assayed; the soluble fraction contains predominantly neuronal (n) and inducible (i)NOS, whereas the membrane fraction contains mostly endothelial (e)NOS. Endogenous arginine was removed from the supernatant using Dowex while the pellet was reconstituted in 5 ml of homogenization buffer, ultracentrifuged, and resuspended in 350 μl Samples were run in triplicate at baseline and duplicate in the presence of nonselective NOS inhibitors NG-monomethyl-l-arginine (5 mM), NG-nitro-l-arginine methyl ester (10 mM), and the calcium chelator trifluperazine (2 mM). Data are expressed as picomoles of l-[3H]-arginine converted to l-[3H]-citrulline per minute per milligram of protein (pmol citrulline · min−1 · mg protein−1) minus any activity not inhibited by the NOS inhibitor cocktail and adjusted for background. Background was determined on heat-inactivated samples and represented <5% of the 100% standard, representing free tritium or noncationic tritiated species not bound by the Dowex resin. The 100% standard was prepared without Dowex, and this value represented the total number of counts available for conversion.
Western blot analysis
Briefly, nNOS was detected with a rabbit polyclonal antibody (24) (1:5,000 dilution, 1-h incubation; secondary antibody, goat, anti-rabbit IgG-horseradish peroxidase, Bio-Rad; 1:3,000 dilution, 1 h). Membranes were stripped and reprobed for eNOS (mouse, monoclonal antibody, Transduction Labs, 1:250 dilution, 1 h; secondary antibody goat, anti-mouse IgG-horseradish peroxidase conjugate, Transduction Labs, 1:2,000 dilution, 1 h). All steps were performed at room temperature. Bands of interest were visualized using ECL reagent and quantitated by densitometry, as integrated optical density (IOD) after subtraction of background. The IOD was factored for Ponceau red staining to correct for any variations in total protein loading and for an internal standard (eNOS = 10 μg bovine aortic endothelial cell lysate; nNOS = 1 μg of rat cerebellar homogenate) to allow comparison between different membranes. Additional details have been published previously (44).
Real-time PCR analysis
Briefly, RNA was extracted using TRI Reagent (Sigma, St. Louis, MO), treated with DNase I (Ambion, Austin, TX) to remove DNA contamination, and 2 μg were reversed transcribed (SuperScript II RNase H− Reverse Transcriptase, Invitrogen, Bethesda, MD) with random primers (Invitrogen) in a total volume of 40 μl. Control RT reactions were performed by omitting the RT enzyme, and PCR was amplified to ensure that DNA did not contaminate the RNA. Two-step quantitative real-time PCR was conducted using Quantitect SYBR Green PCR Reagents (Qiagen, Valencia, CA) according to the manufacturer’s protocol on an iCycler iQ Multi-color Real-Time PCR Detection System (Bio-Rad, Hercules, CA). Primers were designed using GeneTool Software (Biotools, Edmonton, Alberta, Canada) with an annealing temperature of 57–60°C and PCR products between 80 and 150 bp (Table 1). Cyclophilin was used as a reference. All samples were run in duplicate (2.5 μl of cDNA/well in a 96-well format). Preliminary experiments were conducted to optimize conditions. Melting curve analysis was performed on all primers for experimental and control samples. No primer dimer formation was detected. After real-time PCR, all primer products were electrophoresed on a 3% agarose gel and stained with ethidium bromide. A single band at the desired length was detected for each primer product. All real-time PCR products were verified by restriction endonuclease digestion.
Table 1.
Real-time PCR primer sequences
| Primers | Sequence | Annealing Temperature, °C | Location | Accession Number (Product Size) | Diagnostic Restriction Enzyme |
|---|---|---|---|---|---|
| eNOS | |||||
| Forward | 5′-cggcgtgctgcgggatca-3′ | 58.8 | 587–604 | AJ011116 (86bp) | Acil |
| Reverse | 5′-tgcggatgcggctcgtcac-3′ | 654–672 | |||
| nNOS | |||||
| Forward | 5′-aagcctatgccaagaccctgtgtgagatc-3′ | 58.3 | 2401–2429 | NM 052799 (105bp) | Ncol |
| Reverse | 5′-ccagggcttcgtgctccaggtg-3′ | 2484–2505 | |||
| iNOS | |||||
| Forward | 5′-agaggaacaactactgctggtggtgacaa-3′ | 57.2 | 300–328 | S71597 (141bp) | Acil |
| Reverse | 5′-gagcccaggccaaataccgcatac-3′ | 417–440 | Aval | ||
| Cyclophilin | |||||
| Forward | 5′-gcccttgggtcgcgtctgct-3′ | 57 | 87–106 | M19533 (149bp) | Styl |
| Reverse | 5′-caccctggcacatgaatcctgga-3′ | 213–235 | Alul |
eNOS, endothelial nitric oxide synthase; nNOS, neuronal NOS; iNOS, inducible NOS.
For the relative quantification of gene expression, the comparative threshold cycle (CT) method was employed (25). The CT value reflects the cycle number at which fluorescence is first detected. Validation methods were conducted over a 10-fold range of cDNA and over a 2-fold range of primer concentrations from control and experimental kidneys to confirm that the efficiency of NOS and cyclophilin was equal. CT values were averaged from duplicate wells for each sample. The averaged NOS CT was subtracted from the corresponding averaged cyclophilin CT value for each sample, resulting in ΔCT. ΔΔCT was achieved by subtracting the average control ΔCT value from the average experimental ΔCT. The fold-increase was established by calculating 2−ΔΔCT for experimental vs. control samples (25).
Histopathology
Kidneys were fixed in 10% formalin, dehydrated in graded alcohols, and embedded in paraffin. Five-micrometer sections were cut, stained with periodic acid-Schiff stain (PAS), and examined for the extent of glomerular and tubulointerstitial injury. A pathologist without knowledge of the groups examined PAS-stained slides of kidneys from animals of each of the four groups. The slides were assessed and given an overall rank from 1 to 18 for least to most severe damage. This assessment included evaluation of glomerular, tubular, and interstitial injury. Slides were placed in three groups containing similar degrees of injury and then ranked within each group with overlap between groups checked. This procedure was done twice with a month interval to ensure that the ranking was reproducible. Slides with equivalent damage were assigned equal ranks. In addition, glomeruli were assigned to one of three types and the percentage of each type was determined for each animal. The glomeruli were defined as unremarkable, showing segmental sclerosis, or demonstrating global sclerosis. The unremarkable glomeruli had thin and delicate capillary loops with, at most, minor mesangial prominence. Glomeruli with segmental sclerosis showed involvement of only a portion of the glomerulus by increased mesangial matrix and often contained hyalinosis lesions and/or adhesion of the tuft to Bowman’s capsule. Glomeruli with global sclerosis showed no open capillary loops.
Data analysis
Statistics were done through unpaired t-test, Wilcoxon rank sum analysis, Kruskal-Wallis test, Bonferroni method for multiple comparisons, repeated-measures ANOVA, and least squares means. All data are expressed as means ± SE.
RESULTS
Body weight (BW) was lower in WF than in SD at the beginning of the study and increased similarly during the 15-wk experimental period in both SD and WF shams (+19 ± 3 and 17 ± 1%, respectively) as well as in WF-PAN (15 ± 1%) but did not change significantly in the SD-PAN (−6 ± 8%; Table 2). The ratio of BW to left kidney weight (KW) was similar in sham SD and WF (0.34 ± 0.02 and 0.34 ± 0.02, respectively). Administration of PAN caused a disproportionate increase in KW in both strains, but of greater magnitude in SD so that the KW/BW ratio increased moderately in WF (0.41 ± 0.02; P < 0.05 vs. sham) representing a 23 ± 8% increase but markedly in SD (0.75 ± 0.03; P < 0.001 vs. sham) representing a 118 ± 5% increase.
Table 2.
Functional indexes of PAN-treated and sham rats
| BW1, g | BW2, g | LKW, g | BUN, mg/dl | PCr, mg/dl | Ccr, ml · min−1 · kg BW−1 | BP, mmHg | PNOx, μM | PNOx/PCr | |
|---|---|---|---|---|---|---|---|---|---|
| SD Sham | 402±9 | 478±11 | 1.6±0.1 | 24±2 | 0.28±0.02 | 9.9±0.8 | 95±3 | 9±1 | 0.37±0.07 |
| SD PAN | 386±6 | 362±29* | 2.7±0.2* | 199±70* | 4.43±1.50* | 0.9±0.1* | 86±6 | 34±12 | 0.09±0.01* |
| WF Sham | 282±9† | 331±11† | 1.1±0.1† | 20±1 | 0.23±0.02 | 10.0±1.0 | 75±2† | 13±2 | 0.64±0.11 |
| WF PAN | 309±2† | 356±5 | 1.5±0.1† | 23±1† | 0.23±0.02† | 11.4±0.8† | 73±2† | 9±1† | 0.45±0.05† |
Values are means ± SE. BW1, average body weight in control; BW2, average BW after 15 wk; LKW, left kidney weight at death; BUN, blood urea nitrogen; PCr, plasma creatinine clearance; Ccr, creatinine clearance; BP, blood pressure; PNOx, plasma NO2 + NO3; SD, Sprague-Dawley rat; WF, Wistar-Furth rat; PAN, puromycin aminonucleoside.
P < 0.05, Sham vs. PAN.
P < 0.01, SD vs. WF.
SD rats given intravenous PAN were severely proteinuric at week 1, and supplemental doses at weeks 3, 4, and 5 caused further increases in protein excretion (Fig. 1). Although total urinary protein excretion (UpV) declined after week 8, UpV was always higher in SD-PAN rats vs. the controls (SD sham), which showed only a mild age-dependent increase in protein excretion over the 15-wk observation period. The WF also showed a significant acute increase in total protein excretion with PAN, although the absolute level was blunted compared with the SD-PAN. The fold-increase was lower in WF at week 1 (17 ± 2) than in SD (26 ± 5, P = 0.05), which tended to persist although the strain difference in proteinuria diminished in the last few weeks. In WF sham, there was no tendency for UpV to change with age (5 ± 1 and 4 ± 1 mg · 100 g BW−1 · 24 h−1, presurgery and week 15, respectively) as also seen with the SD (7 ± 1 and 9 ± 2 mg · 100 g BW−1 · 24 h−1) with a strain difference present at all times (P < 0.05).
Fig. 1.
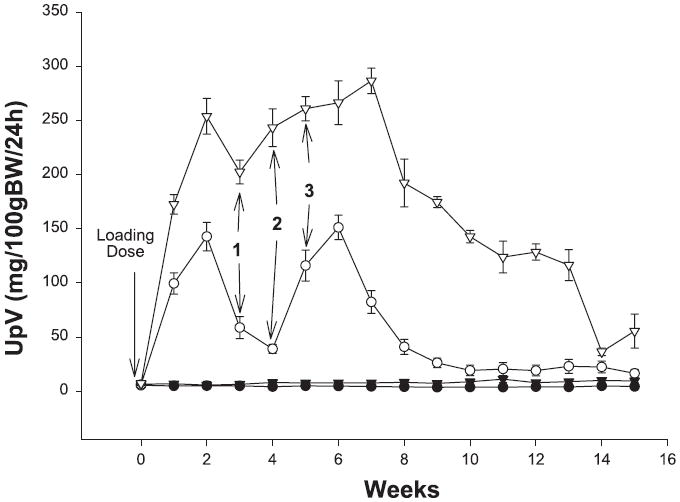
Total urinary protein excretion (UpV) in Wistar-Furth (WF; circles) and Sprague-Dawley (SD; triangles) rats during the 15-wk period following puromycin aminonucleoside (PAN) or sham surgery. Open symbols are PAN and filled symbols are sham data. Maintenance doses of PAN are represented by 1, 2, and 3. BW, body weight.
SD-PAN had markedly increased BUN and plasma creatinine concentrations at 15 wk following the initial dose of PAN compared with sham rats, indicating decreased renal function, as shown by a creatinine clearance (Ccr) of <10% of sham values (Table 2). No increase in BUN or plasma creatinine (PCr) due to PAN treatment was seen in the WF at 15 wk and Ccr was also unchanged relative to WF sham rats. Also shown in Table 2, a strain difference exists in BP with WF having consistently lower BP than SD and PAN having no effect in either strain at 15 wk following the initial dose of PAN.
WF sham had no injury (Figs. 2 and 3) except for occasional small foci of interstitial lymphocytes. SD sham rats had little injury, showing no more than 5% glomerulosclerosis with occasional areas of interstitial inflammation and tubular casts. Glomerular injury was present in two-thirds of WF treated with puromycin; however, the injury was mild in three (segmental sclerosis affecting fewer than 10% of glomeruli with little tubulointerstitial change) and moderate in only one. The difference in segmental sclerosis in WF-PAN was not different compared with WF sham (Fig. 2), although analysis of the ranks of overall injury showed a statistical significance (P < 0.01; Fig. 3). Administration of PAN to SD caused considerable injury with segmental sclerosis present in more than one-third of glomeruli in all animals. An additional 25–30% of glomeruli demonstrated global sclerosis. Extensive tubular injury was characterized by dilated tubules containing large casts and often surrounded by inflammatory infiltrates comprised largely of lymphocytes. This group showed much more injury than either the SD sham or WF-PAN rats by the analysis of both extent of glomerulosclerosis (Fig. 2) and the rank of overall injury (Fig. 3). Of note, creatinine clearance was reduced ~90%, whereas glomerulosclerosis affected ~65% glomeruli in the SD-PAN, suggesting concomitant renal vasoconstriction in our model at the time of harvest. Also, extensive tubulointerstitial injury/inflammation was observed in the SD-PAN, which could further contribute to reduced clearance.
Fig. 2.
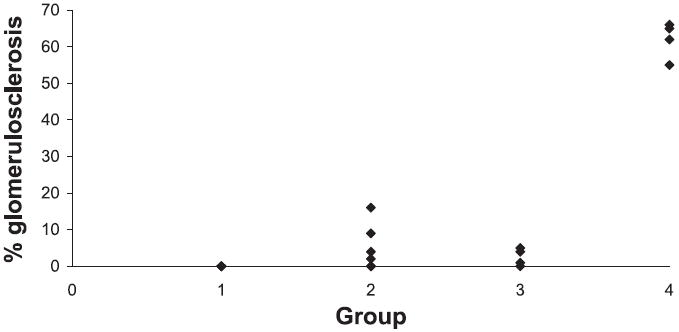
Percent glomerulosclerosis, focal and segmental, shown for WF sham (group 1), WF PAN (group 2), SD sham (group 3), and SD PAN (group 4). SD PAN show significance compared with all other groups (P < 0.01). Each symbol represents an individual rat.
Fig. 3.
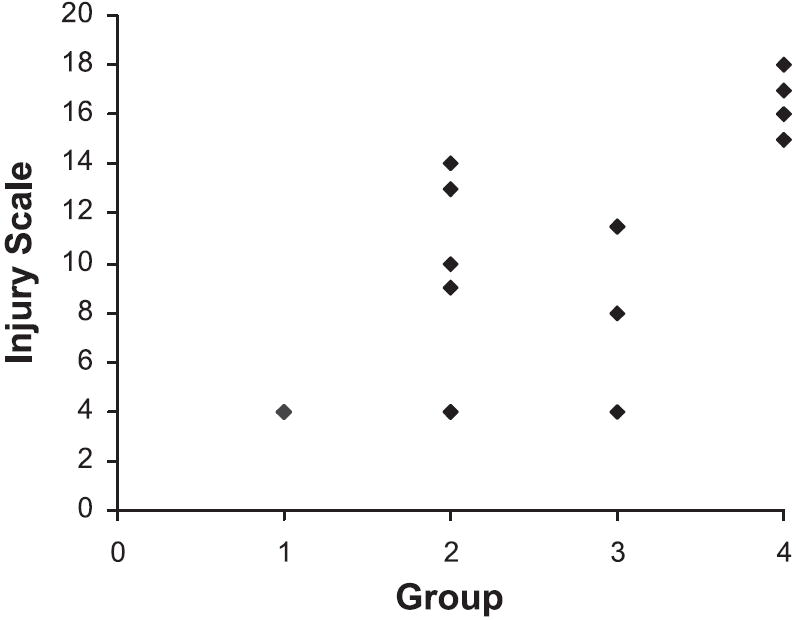
Ranks for overall injury shown for WF sham (group 1), WF PAN (group 2), SD sham (group 3), and SD PAN (group 4). SD PAN show significance vs. all groups (P < 0.05). Overall injury in the WF PAN was increased vs. WF sham (P < 0.01). Each symbol represents an individual rat.
Both the WF and SD given PAN showed a similar transient, marked decline in total NO production (determined from 24-h urinary NOx excretion, UNOXV) at week 1 (Fig. 4). As renal injury developed, SD-PAN showed a persistent decline in total NO production with UNOXV that was significantly lower than all other groups by week 6 and thereafter. In WF given PAN, UNOXV rebounded to baseline values after week 1 (and despite 3 maintenance doses of PAN) so that at week 15 WF-PAN had the same total NO production as in the baseline state and as the 15-wk WF sham rats. In the baseline state, before PAN, WF had significantly more total NO production compared with SD and this difference was maintained at 15 wk. Despite the marked increase in plasma NOx in the SD-PAN (Table 2), when the loss of renal function is corrected by factoring plasma NOx (PNOx) by PCr, a significant reduction in the PNOx/Pcr ratio was seen in SD-PAN, which together with the decreased UNOxV strongly suggests reduced overall NO production (Table 2). In WF, there was no change in plasma NOx (PNOx) or PNOx/Pcr at 15 wk after PAN administration.
Fig. 4.
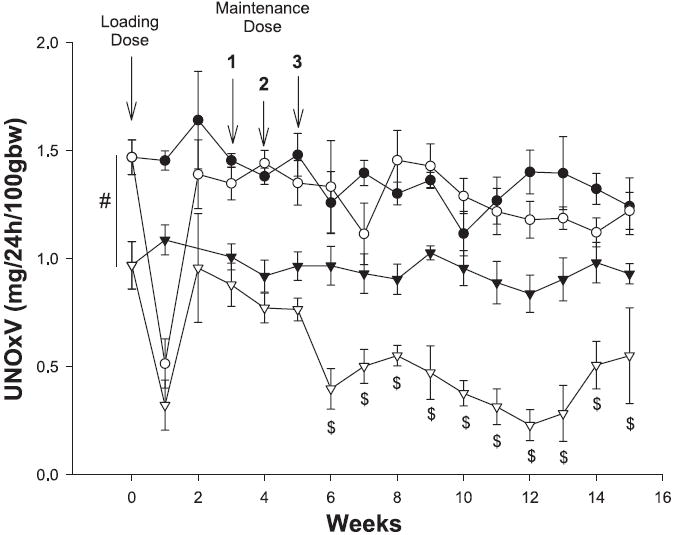
Twenty-four-hour excretion of NO2 + NO3 (UNOXV) of WF (circles) and SD (triangles) during the 15-wk PAN protocol. Open symbols are PAN and filled symbols are sham data. #P < 0.001 for WF vs. SD. $P < 0.05 for SD PAN vs. all other groups.
As shown in Fig. 5, sham WF have elevated nNOS protein abundance compared with control SD. PAN caused a significant decrease in cortical nNOS abundance in the WF and a similar trend (of ~70%) in the SD but because of the higher baseline values, WF-PAN had similar levels to SD sham rats. Medullary nNOS was greatly reduced in the SD-PAN but unchanged in the WF-PAN (Fig. 5). Cortical eNOS showed no change due to treatment or strain, whereas medullary eNOS was reduced in the SD-PAN but unchanged in the WF-PAN (Fig. 6).
Fig. 5.
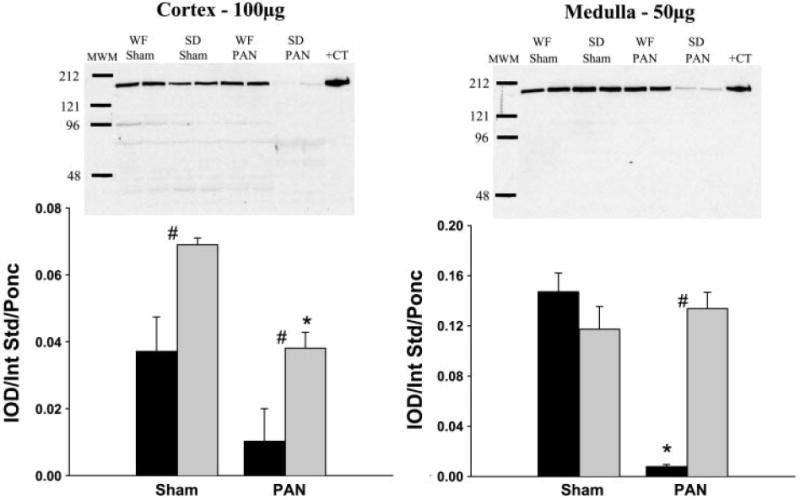
Relative abundance of renal neuronal nitric oxide synthase (nNOS) in the cortex and medulla of WF (gray bars) and SD (black bars) 15 wk following initial PAN administration or sham surgery. Representative gels are shown at the top (left: cortex; right: medulla) with average densitometric values [integrated optical density (IOD)/internal standard (Int Std)/Ponceau red (Ponc)] shown at the bottom. MWM, molecular weight marker; +CT, positive control. #P < 0.05 of WF vs. SD. *P < 0.001 of Sham vs. PAN.
Fig. 6.
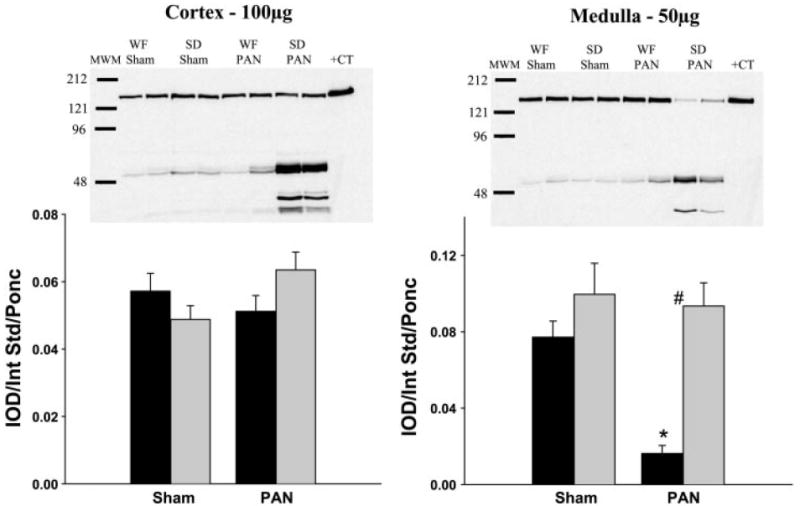
Relative abundance of renal endothelial NOS (eNOS) in the cortex and medulla of WF (gray bars) and SD (black bars) 15 wk following initial PAN administration or sham surgery. Representative gels are shown at the top (left: cortex; right: medulla) with average densitometric values (IOD/Int Std/Ponc) shown at the bottom. #P < 0.001 of WF vs. SD. *P < 0.001 of Sham vs. PAN.
Although abundance of nNOS in the cortex was higher in the sham WF, in vitro NOS activity of the soluble fraction of the cortex (location of the nNOS) was greater in the SD sham rats (Fig. 7) as also reported by us previously (11). After PAN treatment, NOS activity was maintained in the WF (despite a decline in abundance) but significantly reduced in the SD (as predicted by the fall in abundance). Both medullary eNOS and nNOS abundance were reduced in the SD, and parallel changes were seen in the soluble and membrane fraction NOS activity (Fig. 7). Only a mild decrease was observed in the soluble fraction of the medulla in the WF-PAN, although abundance of the constitutive NOS isoforms was maintained. Of note, NOS activity was higher in the SD vs. WF sham in all fractions measured but reversed with PAN as SD-PAN declined to levels significantly below those in WF-PAN.
Fig. 7.
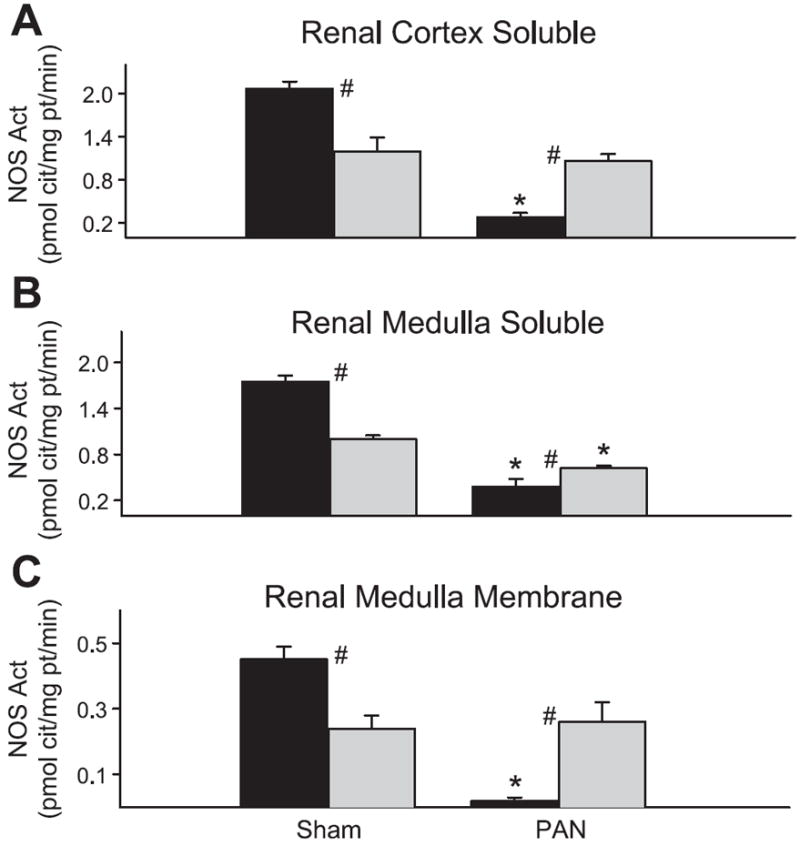
NOS activity (measured as the inhibitable conversion of arginine to citrulline) in the soluble fraction of cortical homogenates (A), soluble fraction of medullary homogenates (B), and membrane fraction of medullary homogenates (C) from WF (gray bars) and SD (black bars) rats. #P < 0.05 of WF vs. SD. *P < 0.001 of Sham vs. PAN.
We also used real-time PCR to measure the relative abundance of the various NOS isoforms at the gene level. Primers are given in Table 1. Representative real-time PCR amplification and melting curves for the nNOS and housekeeping gene cyclophilin are given in Fig. 8. Preliminary data showed cyclophilin gene expression to be truly invariant throughout the biological treatments examined and across rat strains. As shown in Fig. 9, WF rats showed no difference in any NOS gene expression with PAN treatment. In contrast, the SD showed a significant (P < 0.05) increase in NOS mRNA expression with PAN treatment: eNOS (2.46), nNOS (2.72), and iNOS (4.44).
Fig. 8.
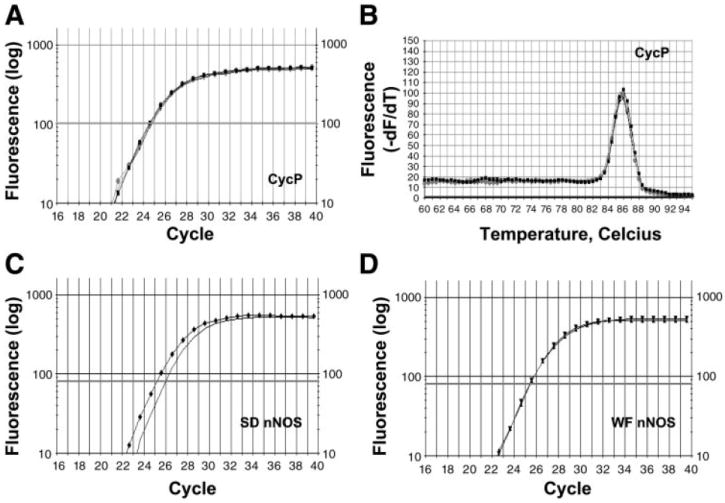
Real-time PCR amplification. A: CycP was used as a reference (i.e., housekeeping gene) and remained constant throughout the various treatments (Fig. 9A). A single amplification curve is shown for SD PAN (circles). Curves for the other 3 conditions were identical and these have been omitted for clarity. Because the amplification efficiencies of the targets [nNOS, eNOS, and inducible NOS (iNOS)] and reference (CycP) were nearly equivalent (A, C, D), the comparative method (ΔΔCt method) was used to compare differences in threshold cycle (CT) values. B: melting curve analysis was performed on all samples for all primers. A single peak at the expected Tm for CycP is shown in SD PAN (circles), indicating that one specific PCR product was formed and the absence of primer-dimer formation. Curves for the other 3 conditions were identical and these have been omitted for clarity. There was no primer-dimer formation or nonspecific products detected for nNOS, eNOS, or iNOS primers in SD Sham, SD PAN, WF Sham, or WF PAN. C and D: amplification plots show increases in fluorescence. SD PAN (triangles; C) contains a higher amount of nNOS template than SD Sham (line; C). There was little difference in the amount of nNOS template in WF PAN (triangles; D) and WF Sham (squares; D), hence the lines are superimposed.
Fig. 9.
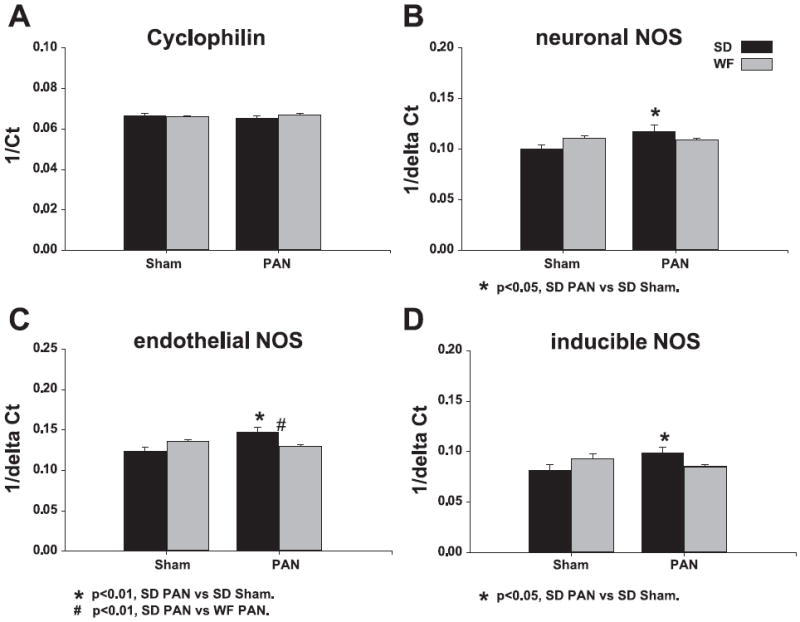
Relative quantification of NOS transcripts was performed using the ΔΔCt method. The inverse Ct or inverse ΔCt was used to represent corresponding increases in NOS transcript levels with treatment. A: there was no difference in CycP transcript expression and was used as a reference. B–D: there was a significant increase in NOS transcript expression in SD given PAN.
DISCUSSION
As shown previously (2, 8, 13) and in this study, SD rats given PAN exhibited an initial severe proteinuria and subsequently developed CRD with FSGS. The novel findings of this study were that WF rats were resistant to PAN-induced CRD with maintained renal function and minimal renal injury. Of note, this resistance was associated with higher levels of total and renal NO production in the protected WF compared with the vulnerable SD.
Many different versions of the PAN model have been employed. A single intravenous dose of 50 mg/kg PAN caused a severe initial proteinuria resulting in a nephrotic syndrome, followed by a slowly developing CRD over many months (2, 8). Other workers have given multiple intraperitoneal injections to accelerate the development of the CRD (13, 17). We adapted the model to give an initial intravenous bolus and three intravenous maintenance doses that resulted in severe CRD in the SD by 15 wk. The exact biochemical events that cause PAN nephropathy are not known, although the early effects are primarily on the podocytes and likely involve oxidative damage (13). In the chronic phase of the disease, glomerular hypertension has been reported (2) but because FSGS develops in the absence of high glomerular blood pressure in a different PAN model (14), this is unlikely to be a primary cause. Of note, the course of PAN-induced CRD is different from the commonly used 5/6 renal mass reduction models, characterized by glomerular hypertension and hyperfiltration of remaining nephrons (13). Nevertheless, there are also similarities between the two models, with both early and late inflammatory cell infiltration, increased extracellular matrix (ECM) synthesis, and decreased ECM degradation as well as protection vs. progression of CRD with both angiotensin inhibition and low protein feeding (13). Another common finding is the decrease in both total NO production and in renal NO-generating capacity in rats with renal mass reduction (1, 3, 11, 31, 39) and the PAN CRD model, as shown in the present study.
Recent observations have supported the suggestion that NO deficiency is both a cause and consequence of CRD (4). Chronic, experimentally induced NOS inhibition causes renal injury, proteinuria, and glomerular hypertension (45). Clinical studies in CRD and ESRD patients show reduced total NO production (32-34), whereas animal models of CRD exhibit decreased renal NOS abundance and activity as well as reduced total NO production (1, 3, 11, 31, 39, 40). Furthermore, stimulation of endogenous NO synthesis with l-arginine supplementation is beneficial in several animal models of CRD while chronic NOS inhibition can enhance progression (3, 15, 22). Together, this evidence suggests a central role for NO deficiency in the progression of CRD.
Our previous studies in animal models of CRD showed quite variable responses in the renal eNOS with no change in chronic glomerulonephritis (40), a decrease in age-dependent injury (10), an increase in the obese diabetic Zucker rat (9), and an increase, decrease, and no change have been shown in the remnant kidney depending on the duration and model (1, 11, 16, 21, 36, 39). These differences between models suggest a disease-specific response of eNOS rather than a generalized change due to CRD. In the present study, eNOS levels were unchanged in PAN CRD with the exception of a reduction in eNOS abundance in the medulla of SD-PAN, which correlated with reduced NOS activity in the membrane fraction (primary location of eNOS) of the SD-PAN medulla.
Unlike eNOS, renal nNOS abundance and activity change consistently in several models of CRD. Downregulation of renal nNOS in CRD was first shown by Roczniak et al. (31) in the remnant kidney (polectomy) model. Reduced renal nNOS abundance and NOS activity have since been reported by us in rats at 4–11 wk post-5/6 A/I, accelerated 5/6 A/I (2–3 wk post-5/6 A/I + high-sodium and -protein intake), age-dependent injury, chronic glomerulonephritis (10, 11, 36, 40), and also in the diabetic obese Zucker rat (9). In the 5/6 A/I model of CRD studied at various levels of severity determined by time after A/I (2–11 wk), the level of nNOS protein in both the cortex and medulla correlated with the severity of glomerulosclerosis (36). In the PAN model, nNOS abundance and NOS activity in the soluble fraction were markedly reduced in both the cortex and medulla of the susceptible SD. Although it is difficult to dissociate cause and effect, it is possible that an initial renal nNOS deficiency contributes to further progression of CRD. Medullary NO derived from nNOS is involved in the regulation of sodium balance and inner medullary nNOS inhibition causes a salt-dependent hypertension (26). Furthermore, PAN nephrosis is associated with sodium retention, and the loss of inner medullary NO may contribute (28). However, because systemic hypertension was not present in our model of PAN-induced CRD, the significance of decreased medullary nNOS in SD-PAN is unclear. Cortical nNOS, mainly expressed in macula densa, acts as a brake on tubuloglomerular feedback (TGF) (42). However, although acute nNOS inhibition exacerbates TGF-induced renal vasoconstriction, nNOS knockout mice and rats given chronic nNOS inhibition show normal TGF responsiveness (29, 30, 38). Thus, although it is unclear how decreased renal nNOS influences the progression of PAN-induced CRD, our recent observations in the C57BL6 mouse, showing that selective nNOS inhibition greatly potentiates progression of CRD (27), support a causal relationship.
One major finding in the present study is the impressive resistance of the WF to the chronic phase of PAN-induced renal injury, despite an active acute response. Previous studies showed that the WF is resistant to renal mass reduction (11, 12) and that enhanced/preserved NO production (compared with the SD) conferred protection (11). As also seen in our previous study in which we compared the response of SD and WF to 5/6 A/I, here we observed that in the baseline state WF had elevated total NO production (from UNOXV) vs. SD. After the insult (either 5/6 A/I or PAN), the strain difference in UNOXV was maintained and in both models the injured SDs exhibited reduced total NO production compared with all other groups. Total NO production also fell acutely with PAN in both strains, and while it is unclear what caused this acute fall in UNOXV, this is unlikely to be related to the development of CRD because WF do not progress. Walker et al. (41) also report a decrease in UNOXV at 7 days postintravenous injection in SD.
Strain differences, leading to variable chronic responses after acute kidney injury, have been reviewed by Fogo (13). She points out the marked variation in susceptibility to renal ablation-induced CRD in mice that may segregate with renin gene status (13). Indeed, progression of CRD in vulnerable rat strains, after both renal ablation and PAN, is markedly attenuated by chronic angiotensin inhibition (3, 13, 46). Of relevance to the present study, the piebald viral glaxo (PVG)-inbred rat strain is also resistant to PAN-induced chronic renal damage (19) as well as to aging and uninephrectomy-induced renal damage (18). The renin-angiotensin-aldosterone system (RAAS) in the WF is altered with documented resistance to mineralocorticoid-induced hypertension (37); however, there is no information on the RAAS in PVG rats. One known similarity between these two resistant stains is the high glomerular number relative to SD and Wistars (11, 18), supporting the hypothesis that nephron number is a critical determinant of rate of progression of CRD (5). The greater BP between the strains could certainly be a risk factor predisposing to greater injury in the SD; however, in our terminal study, there was no elevation in BP with PAN CRD in either strain, and thus the higher baseline BP is not the cause of the greatly accelerated injury in the SD-PAN. The hypertrophic response of the kidney following PAN was much greater in the SD than the WF, which could also contribute to the greater injury in the SD. However, the exaggerated renal hypertrophic response might also be a consequence of the marked loss in function in the SD, so causality is hard to determine. We also suggest that the preserved renal NO-generating capacity seen in the WF may play a critical role in reducing progression of CRD, as discussed above (there is no information on the PVG rat).
The regulation of renal nNOS activity in the SD-PAN was quite straightforward with parallel declines in nNOS protein abundance and NOS activity in the soluble fraction of both the cortex and medulla. This was exactly the same pattern seen in the SD after 5/6 A/I (11). The changes in the WF were more complex because although nNOS abundance was greater in control WF vs. SD kidney cortex, the SD sham had significantly higher NOS activity compared with the WF. Furthermore, whereas absolute nNOS abundance fell in the cortex of WF-PAN, the NOS activity was maintained, relative to shams. Again, this was the pattern that we saw in the WF after 5/6 A/I (11). The tissue NOS activity is measured in vitro with an excess of substrate and cofactor present and should therefore reflect abundance and inherent enzyme activity. As reviewed recently, many proteins interact with the nNOS and regulate activity, including heat shock protein 90, caveolin, the protein inhibitor of nNOS, and a number of proteins that interact through the PDZ domain. These may regulate activity by control of phosphorylation, dimerization, etc., and nNOS activity is also influenced by nitrosylation, oxidant status, substrate availability, etc. (23, 43). Therefore, it would be naive to expect NOS activity and abundance to always change in parallel. In the case of the WF, it appears that for a given abundance of renal nNOS, the protein possesses a marked “reserve” capacity for increased activity that is not seen in the SD.
We do not know what signals renal nNOS abundance to decline in states of compromised renal function, although the effect is clearly posttranscriptional in view of the tendency for upregulation of nNOS mRNA in SD rats given PAN. In fact, all three NOS mRNAs were upregulated in the SD-PAN, suggesting a secondary feedback response to low ambient NO (6, 7). This possibility is strengthened by the finding that there was no change in any NOS mRNAs in the WF kidneys, where overall NO generation was likely maintained due to the maintained NOS activity. Because renal nNOS protein abundance declines in multiple models of renal disease (9-11, 31, 36, 40) and given our finding that nNOS decreases with increasing renal dysfunction (36), the signal(s) may be related to renal parenchymal damage.
In conclusion, the WF rat shows resistance to PAN-induced CRD in association with maintained total and renal NO production compared with the progressing SD. As seen in several other models of CRD, the renal nNOS was primarily affected. The study of different strains with differing susceptibilities to CRD may be informative in determining the precise role of the renal NO system in the progression of CRD.
References
- 1.Aiello S, Noris M, Todeschini M, Zappella S, Foglieni C, Benigni A, Corna D, Zoja C, Cavallotti D, Remuzzi G. Renal and systemic nitric oxide synthesis in rats with renal mass reduction. Kidney Int. 1997;52:171–181. doi: 10.1038/ki.1997.317. [DOI] [PubMed] [Google Scholar]
- 2.Anderson S, Diamond JR, Karnovsky MJ, Brenner BM. Mechanisms underlying transition from acute glomerular injury to late glomer-ular sclerosis in a rat model of nephrotic syndrome. J Clin Invest. 1988;82:1757–1768. doi: 10.1172/JCI113789. [DOI] [PMC free article] [PubMed] [Google Scholar]
- 3.Ashab I, Peer G, Blum M, Wollman Y, Chernihovsky T, Hassner A, Schwartz D, Cabili S, Silverberg D, Iaina A. Oral administration of l-arginine and captopril in rats prevents chronic renal failure by nitric oxide production. Kidney Int. 1995;47:1515–1521. doi: 10.1038/ki.1995.214. [DOI] [PubMed] [Google Scholar]
- 4.Baylis C. Nitric oxide deficiency: both consequence and cause of chronic renal disease (CRD) Hypertension and Nephrology. 2001;5:193–201. [Google Scholar]
- 5.Brenner BM, Mackenzie HS. Nephron mass as a risk factor for progression of renal disease. Kidney Int Suppl. 1997;63:S124–S127. [PubMed] [Google Scholar]
- 6.Colasanti M, Persichini T, Meneqazzi M, Mariotto S, Giordano E, Caldarera CM, Soqos V, Lauro GM, Suzuki H. Induction of nitric oxide synthase mRNA expression. Suppression by exogenous nitric oxide. J Biol Chem. 1995;270:26731–26733. doi: 10.1074/jbc.270.45.26731. [DOI] [PubMed] [Google Scholar]
- 7.De Alba J, Cardenas A, Moro MA, Leza JC, Lorenzo P, Bosca L, Lizasoain I. Downregulation of neuronal nitric oxide synthase by nitric oxide after oxygen-glucose deprivation in rat forebrain slices. J Neurochem. 1999;72:248–254. doi: 10.1046/j.1471-4159.1999.0720248.x. [DOI] [PubMed] [Google Scholar]
- 8.Diamond JR, Karnovsky MJ. Focal and segmental glomerulosclerosis following a single intravenous dose of puromycin aminonucleoside. Am J Pathol. 1986;122:481–487. [PMC free article] [PubMed] [Google Scholar]
- 9.Erdely A, Freshour G, Maddox D, Baylis C. Decreased renal nitric oxide synthase (NOS) with advanced type 2 diabetic nephropathy (DN) FASEB Late breaking (LB) 2002:107. Abstract. [Google Scholar]
- 10.Erdely A, Greenfeld Z, Wagner L, Baylis C. Sexual dimorphism in the aging kidney: effects on injury and nitric oxide system. Kidney Int. 2003;63:1021–1026. doi: 10.1046/j.1523-1755.2003.00830.x. [DOI] [PMC free article] [PubMed] [Google Scholar]
- 11.Erdely A, Wagner L, Muller V, Szabo A, Baylis C. Protection of Wistar-Furth rat from chronic renal disease is associated with maintained renal nitric oxide synthase. J Am Soc Nephrol. 2003;14:2526–2533. doi: 10.1097/01.asn.0000086476.48686.7d. [DOI] [PMC free article] [PubMed] [Google Scholar]
- 12.Fitzgibbon WR, Greene EL, Grewal JS, Hutchison FN, Self SE, Latten SY, Ullian ME. Resistance to remnant nephropathy in the Wistar-Furth rat. J Am Soc Nephrol. 1999;10:814–821. doi: 10.1681/ASN.V104814. [DOI] [PubMed] [Google Scholar]
- 13.Fogo A. Animal models of FSGS: lessons for pathogenesis and treatment. Semin Nephrol. 2003;23:161–171. doi: 10.1053/snep.2003.50015. [DOI] [PubMed] [Google Scholar]
- 14.Fogo A, Yoshida Y, Glick AD, Homma T, Ichikawa I. Serial micropuncture analysis of glomerular function in two rat models of glomerular sclerosis. J Clin Invest. 1988;82:322–330. doi: 10.1172/JCI113590. [DOI] [PMC free article] [PubMed] [Google Scholar]
- 15.Fujihara CK, De Nucci G, Zatz R. Chronic nitric oxide synthase inhibition aggravates glomerular injury in rats with subtotal nephrectomy. J Am Soc Nephrol. 1995;5:1498–1507. doi: 10.1681/ASN.V571498. [DOI] [PubMed] [Google Scholar]
- 16.Fujihara CK, Mattar AL, Vieira JM, Jr, Malheiros DM, Noronha Id Ide L, Goncalves AR, De Nucci G, Zatz R. Evidence for the existence of two distinct functions for the inducible NO synthase in the rat kidney: effect of aminoguanidine in rats with 5/6 ablation. J Am Soc Nephrol. 2002;13:2278–2287. doi: 10.1097/01.asn.0000027354.12330.f4. [DOI] [PubMed] [Google Scholar]
- 17.Glasser RJ, Velosa JA, Michael AF. Experimental model of sclerosis. I. Relationship to protein excretion in aminonucleoside nephrosis. Lab Invest. 1977;36:519–526. [PubMed] [Google Scholar]
- 18.Grond J, Beukers JY, Schilthuis MS, Weening JJ, Elema JD. Analysis of renal structural and functional features in two rat strains with a different susceptibility to glomerular sclerosis. Lab Invest. 1986;54:77–83. [PubMed] [Google Scholar]
- 19.Grond J, Muller EW, van Goor H, Weening JJ, Elema JD. Differences in puromycin aminonucleoside nephrosis in two rat strains. Kidney Int. 1988;33:524–529. doi: 10.1038/ki.1988.29. [DOI] [PubMed] [Google Scholar]
- 20.Hostetter TH, Olson JL, Rennke HG, Venkatachalam MA, Brenner BM. Hyperfiltration in remnant nephrons: a potentially adverse response to renal ablation. Am J Physiol Renal Fluid Electrolyte Physiol. 1981;241:F85–F93. doi: 10.1152/ajprenal.1981.241.1.F85. [DOI] [PubMed] [Google Scholar]
- 21.Kang DH, Nakagawa T, Feng L, Johnson RJ. Nitric oxide modulates vascular disease in the remnant kidney model. Am J Pathol. 2002;161:239–248. doi: 10.1016/S0002-9440(10)64175-2. [DOI] [PMC free article] [PubMed] [Google Scholar]
- 22.Katoh T, Takahashi K, Klahr S, Reyes AA, Badr KF. Dietary supplementation with l-arginine ameliorates glomerular hypertension in rats with subtotal nephrectomy. J Am Soc Nephrol. 1994;4:1690–1694. doi: 10.1681/ASN.V491690. [DOI] [PubMed] [Google Scholar]
- 23.Kone BC, Kuncewicz T, Zhang W, Yu ZY. Protein interactions with nitric oxide synthases: controlling the right time, the right place, and the right amount of nitric oxide. Am J Physiol Renal Physiol. 2003;285:F178–F190. doi: 10.1152/ajprenal.00048.2003. [DOI] [PubMed] [Google Scholar]
- 24.Lau KS, Grange RW, Chang WJ, Kamm KE, Sarelius I, Stull JT. Skeletal muscle contractions stimulate cGMP formation and attenuate vascular smooth muscle myosin phosphorylation via nitric oxide. FEBS Lett. 1998;431:71–74. doi: 10.1016/s0014-5793(98)00728-5. [DOI] [PubMed] [Google Scholar]
- 25.Livak KJ, Schmittgen TD. Analysis of relative gene expression data using real-time quantitative PCR and the 2−ΔΔCt method. Methods. 2001;25:402–408. doi: 10.1006/meth.2001.1262. [DOI] [PubMed] [Google Scholar]
- 26.Mattson DL, Bellehumeur TG. Neural nitric oxide synthase in the renal medulla and blood pressure regulation. Hypertension. 1996;28:297–303. doi: 10.1161/01.hyp.28.2.297. [DOI] [PubMed] [Google Scholar]
- 27.Muller V, Engels K, Baylis C. Chronic inhibition of nitric oxide synthase (NOS) renders the C57BL6 mouse susceptible to the development of chronic renal disease. J Am Soc Nephrol. 2003;14:625A. Abstract. [Google Scholar]
- 28.Ni Z, Vaziri ND. Downregulation of nitric oxide synthase in nephrotic syndrome: role of proteinuria. Biochim Biophys Acta. 2003;1638:129–137. doi: 10.1016/s0925-4439(03)00061-9. [DOI] [PubMed] [Google Scholar]
- 29.Ollerstam A, Pittner J, Persson AE, Thorup C. Increased blood pressure in rats after long-term inhibition of the neuronal isoform of nitric oxide synthase. J Clin Invest. 1997;99:2212–2218. doi: 10.1172/JCI119394. [DOI] [PMC free article] [PubMed] [Google Scholar]
- 30.Ren YL, Garvin JL, Ito S, Carretero OA. Role of neuronal nitric oxide synthase in the macula densa. Kidney Int. 2001;60:1676–1683. doi: 10.1046/j.1523-1755.2001.00987.x. [DOI] [PubMed] [Google Scholar]
- 31.Roczniak A, Fryer JN, Levine DZ, Burns KD. Downregulation of neuronal nitric oxide synthase in the rat remnant kidney. J Am Soc Nephrol. 1999;10:704–713. doi: 10.1681/ASN.V104704. [DOI] [PubMed] [Google Scholar]
- 32.Schmidt R, Domico J, Samsell L, Yokota S, Tracy T, Sorkin M, Engels K, Baylis C. Indices of activity of the nitric oxide system in patients on hemodialysis. Am J Kidney Dis. 1999;34:228–234. doi: 10.1053/AJKD03400228. [DOI] [PMC free article] [PubMed] [Google Scholar]
- 33.Schmidt RJ, Baylis C. Total nitric oxide production is low in patients with chronic renal disease. Kidney Int. 2000;58:1261–1266. doi: 10.1046/j.1523-1755.2000.00281.x. [DOI] [PMC free article] [PubMed] [Google Scholar]
- 34.Schmidt RJ, Yokota S, Tracy TS, Sorkin MI, Baylis C. Nitric oxide production is low in end-stage renal disease patients on peritoneal dialysis. Am J Physiol Renal Physiol. 1999;276:F794–F797. doi: 10.1152/ajprenal.1999.276.5.F794. [DOI] [PMC free article] [PubMed] [Google Scholar]
- 35.Suto T, Losonczy G, Qiu C, Hill C, Samsell L, Ruby J, Charon N, Venuto R, Baylis C. Acute changes in urinary excretion of nitrate + nitrite (UNOXV) do not predict renal vascular NO production. Kidney Int. 1995;48:1272–1277. doi: 10.1038/ki.1995.411. [DOI] [PubMed] [Google Scholar]
- 36.Szabo AJ, Wagner L, Erdely A, Lau K, Baylis C. Renal neuronal nitric oxide synthase protein expression as a marker of renal injury. Kidney Int. 2003;64:1765–1771. doi: 10.1046/j.1523-1755.2003.00260.x. [DOI] [PubMed] [Google Scholar]
- 37.Ullian ME, Islam MM, Robinson CJ, Fitzgibbon WR, Tobin ET, Paul RV. Resistance to mineralocorticoids in Wistar-Furth rats. Am J Physiol Heart Circ Physiol. 1997;272:H1454–H1461. doi: 10.1152/ajpheart.1997.272.3.H1454. [DOI] [PubMed] [Google Scholar]
- 38.Vallon V, Traynor T, Barajas L, Huang YG, Briggs JP, Schnermann J. Feedback control of glomerular vascular tone in neuronal nitric oxide synthase knockout mice. J Am Soc Nephrol. 2001;12:1599–1606. doi: 10.1681/ASN.V1281599. [DOI] [PubMed] [Google Scholar]
- 39.Vaziri ND, Ni Z, Wang XQ, Oveisi F, Zhou XJ. Downregulation of nitric oxide synthase in chronic renal insufficiency: role of excess PTH. Am J Physiol Renal Physiol. 1998;274:F642–F649. doi: 10.1152/ajprenal.1998.274.4.F642. [DOI] [PubMed] [Google Scholar]
- 40.Wagner L, Riggleman A, Erdely A, Couser W, Baylis C. Reduced nitric oxide synthase activity in rats with chronic renal disease due to glomerulonephritis. Kidney Int. 2002;62:532–536. doi: 10.1046/j.1523-1755.2002.00465.x. [DOI] [PMC free article] [PubMed] [Google Scholar]
- 41.Walker LM, Shah SV, Mayeux PR. Lack of a role for inducible nitric oxide synthase in an experimental model of nephrotic syndrome. Biochem Pharmacol. 2000;60:137–143. doi: 10.1016/s0006-2952(00)00308-7. [DOI] [PubMed] [Google Scholar]
- 42.Welch WJ, Wilcox CS, Thomson SC. Nitric oxide and tubuloglo-merular feedback. Semin Nephrol. 1999;19:251–262. [PubMed] [Google Scholar]
- 43.Xia Y, Dawson VL, Dawson TD, Solomon SH, Zweier JL. Nitric oxide synthase generates superoxide and nitric oxide in arginine-depleted cells leading to peroxynitrite mediated. Proc Natl Acad Sci USA. 1996;93:6770–6774. doi: 10.1073/pnas.93.13.6770. [DOI] [PMC free article] [PubMed] [Google Scholar]
- 44.Xiao S, Erdely A, Wagner L, Baylis C. Uremic levels of BUN do not cause nitric oxide deficiency in rats with normal renal function. Am J Physiol Renal Physiol. 2001;280:F996–F1000. doi: 10.1152/ajprenal.2001.280.6.F996. [DOI] [PubMed] [Google Scholar]
- 45.Zatz R, Baylis C. Chronic nitric oxide inhibition model six years on. Hypertension. 1998;32:958–964. doi: 10.1161/01.hyp.32.6.958. [DOI] [PMC free article] [PubMed] [Google Scholar]
- 46.Zheng Y, Shirato I, Maeda A, Kobayashi N, Liao J, Shou I, Fukui M, Tomino Y. Temocapril, a long-acting non-SH group angio-tensin converting enzyme inhibitor, modulates glomerular injury in chronic puromycin aminonucleoside nephrosis. J Nephrol. 2002;15:36–41. [PubMed] [Google Scholar]