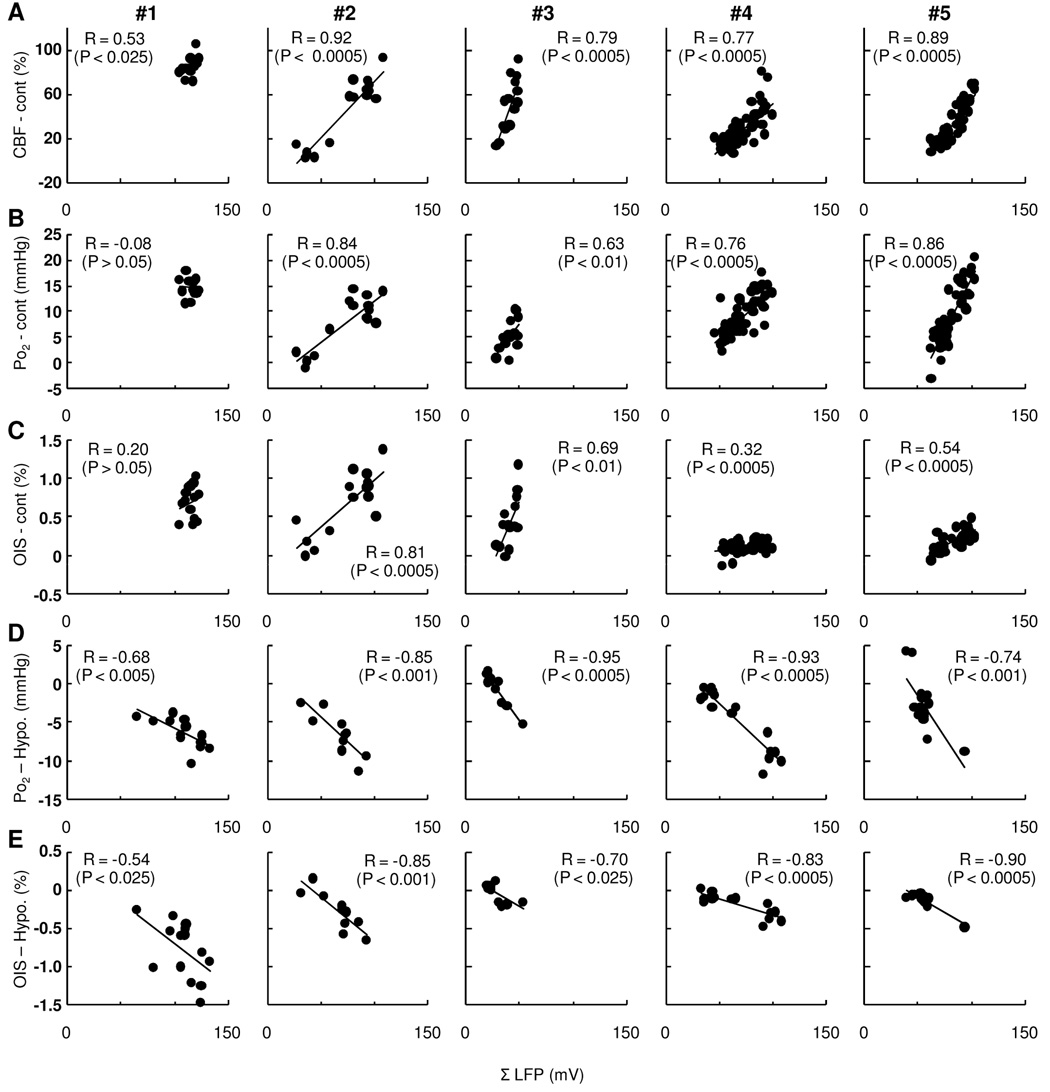
Figure 5. Trial-by-trial basis correlations to ΣLFP in individual subjects (#1 – #5).
Activity-induced CBF (A), Po2 (B), and OIS (C) compared with ΣLFP simultaneously measured in control experiments (A–C). A strong linear correlation between CBF and ΣLFP was observed in all subjects (R = 0.53 to 0.92). In contrast, a lower correlation was found between Po2 and ΣLFP (R = −0.08 to 0.86) as well as between OIS and ΣLFP (R = 0.20 to 0.81). In the hypotension experiments (D–E), a strong linear correlation was consistently observed between Po2 (D) and ΣLFP (R = −0.68 to −0.95) as well as OIS (E) and ΣLFP (R = −0.54 to −0.90).

