Abstract
Dimethylarginine dimethylaminohydrolase (DDAH) metabolizes asymmetric dimethylarginine to generate l-citrulline and is present in large quantities in the kidney. We present a new study that optimizes the Prescott–Jones colorimetric assay to measure DDAH-dependent l-citrulline generation in kidney homogenates. We found that the removal of urea with urease is necessary since urea also produces a positive reaction. Deproteinization with sulfosalicylic acid was found to be optimal and that protease inhibitors were not necessary. All assays were conducted in phosphate buffer, since other common additives can create false positive and false negative reactions. Arginase or nitric oxide synthase isoenzymes were not found to influence l-citrulline production. Our optimized l-citrulline production assay to measure DDAH activity correlated closely with the direct measure of the rate of asymmetric dimethylarginine consumption. Using this assay, we found that both superoxide and nitric oxide inhibit renal cortical DDAH activity in vitro.
Keywords: asymmetric dimethylarginine, l-citrulline, dimethylarginine dimethylaminohydrolase, nitric oxide, urea
Dimethylarginine dimethylaminohydrolase (DDAH) metabolizes the methylarginines asymmetric dimethylarginine (ADMA) and NW-monomethyl-l-arginine, to generate l-citrulline, and is highly expressed in the kidney.1 ADMA is elevated in many systemic diseases, including renal failure, possibly due to impaired renal DDAH activity.
DDAH activity can be measured by rate of substrate (e.g. ADMA) consumption, but these assays are time consuming and costly.2,3 A colorimetric method that detects l-citrulline production can also be used providing that (1) other pathways that generate or remove l-citrulline are inactivated and (2) interfering compounds have been removed.
Here, we have optimized the Prescott–Jones method4 using diacetyl monoxime derivatization of the ureido group in l-citrulline to form color5,4 that has been adapted to a 96-well format.6 Particular attention was paid to nonspecific color generation by urea.7 Furthermore, we compared this modified l-citrulline assay to the direct high-pressure liquid chromatography method measuring rate of ADMA consumption.
Results
Optimization of l-citrulline assay
The enzyme is saturated at between 100 μm and 1 mm substrate (ADMA) and we therefore use 1 mm ADMA in all studies. We compared four different homogenization buffers, and found sodium phosphate buffer, pH = 6.5, was without effect on color formation (Table 1). Without deproteinization, both bovine serum albumin and the kidney homogenate caused turbidity. Sulfosalicylic acid (4%) gave the lowest blank absorbance and was used for deproteinization. With deproteinization, there was no background color with bovine serum albumin although the kidney homogenate still had high color, suggesting the presence of interfering factors.
Table 1. Effect of buffers and additives on the l-citrulline assay in the presence of 25 μm l-citrulline.
| l-citrulline μm | Color as % of control | |
|---|---|---|
| Homogenization buffera | ||
| HB1 | 17.0±0.8 | 68 |
| HB2 | <Minimal | <1 |
| HB3 | 24.9±0.6 | 100 |
| HB4 | >100b | 464 |
| Buffer base | ||
| 1% Triton | 13.0±0.9 | 52 |
| 1 m HEPES | 27.5±0.4 | 110 |
| 0.3 m sucrose | >100 | 500 |
| 0.9% normal saline | 24.6±0.6 | 98 |
| 0.1 m sodium phosphate | 24.9±0.6 | 100 |
| 100 mm urea | >100 | 1419 |
| Additives | ||
| 0.1 m DTT | >100 | 384 |
| 1% 2-mercaptoethanol | <Minimal | <1 |
| 0.5% Tween | 22.2±1.0 | 89 |
| 1% SDS | 22.3±3.7 | 89 |
| 0.5 m EDTA | 25.6±3.0 | 102 |
| 0.2 m EGTA | 33.6±0.6 | 134 |
| 1 mm ADMA | 22.2±0.8 | 89 |
| Protease inhibitorsc | 23.2±0.3 | 95 |
| 4% sulfosalicylic acid | 28.2±1.0 | 113 |
| Protein | ||
| 1 mg/ml BSA | 33.6±2.8b | 134 |
| 2 mg/ml BSA | 43.3±7.8b | 173 |
| 1 mg/ml kidney homogenate | 76.3±12.1b | 305 |
| 2 mg/ml kidney homogenate | >100b | 415 |
| Protein with deproteinization | ||
| 1 mg/ml BSA | 26.1±0.8 | 107 |
| 2 mg/ml BSA | 25.7±0.8 | 103 |
| 1 mg/ml kidney homogenate | 63.4±1.1 | 253 |
| 2 mg/ml kidney homogenate | 82.6±1.2 | 330 |
ADMA, asymmetric dimethylarginine; BSA, bovine serum albumin; EDTA, ethylene-diaminetetraacetic acid; EGTA, ethylene glycol-bis(â-aminoethyl ether)-N,N,N′,N′,-tetraacetic acid; HEPES, hydroxyethylpiperazine-N′-2-ethanesulfonic; SDS, sodium dodecyl sulfate; DTT, dl-dithiothreitol.
The values reflect effect of an additive on the color generated by a 25 μm l-citrulline standard (taken as 100%).
HB1, pH=6.8 contained 20 mm Tris, 1% Triton X-100, 5 mm EDTA, 10 mm EGTA, 2 mm DTT, 1 mm sodium orthovanadate, 0.1 mg/ml phenylmethylsulfonyl fluoride, 10 μg/ml leupeptin, and aprotinin; HB2 contained 0.1 m sodium phosphate, pH=6.5 containing 2 mm 2-mercaptoethanol;10 HB3 contained 0.1 m sodium phosphate, pH=6.5;12 and HB4 was RIPA buffer (Santa Cruz, CA, USA), containing 20 mm Tris, pH=7.6, 137 mm sodium chloride, 0.2% Nonidet P-40, 0.1% sodium deoxycholate, 0.02% SDS, 0.0008% sodium azide, and protease inhibitors.
The supernatant was opalescent.
Protease inhibitors: 0.1 mg/ml phenylmethylsulfonyl fluoride, 10 μg/ml leupeptin, and aprotinin.
Effect of urea on l-citrulline assay
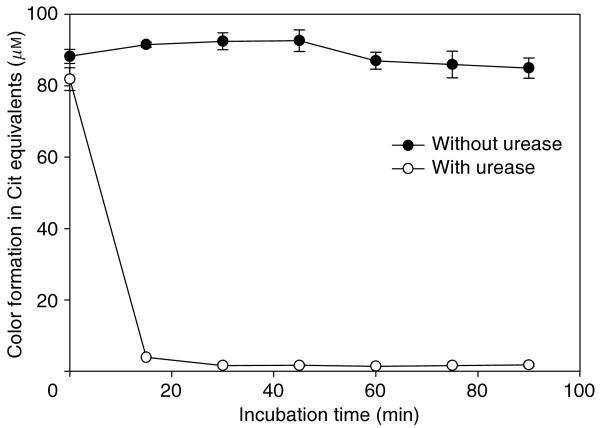
As shown in Figure 1, the high background color seen in the deproteinized kidney homogenate was reduced by >95% at t = 15 min after incubation with urease. Addition of 1, 5, 10, 50, and 100 mm urea gave color equivalent to ∼21, 49, 106, 195, and 221 μm l-citrulline, respectively, but gave no background color at t = 0 when preincubated with urease for 15 min.
Figure 1. Time course of the urea effect on color formation without substrate (ADMA) in the absence (solid circle) and presence of urease (open circle).
Each time point determined in triplicate.
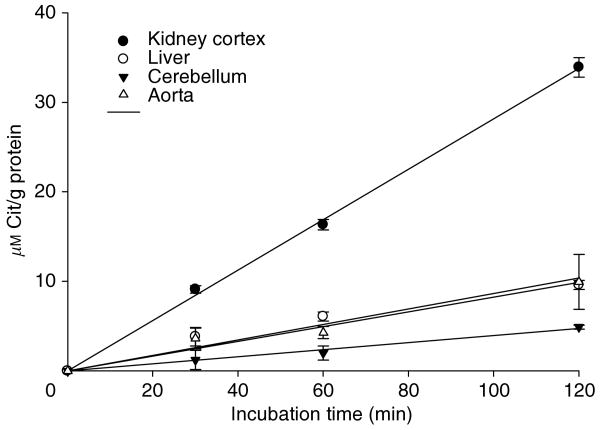
After preincubation with urease, citrulline production in kidney and other tissue homogenates incubated with 1 mm ADMA was linear from 0 to 120 min (Figure 2). We used a 45-min incubation in subsequent studies.
Figure 2. Time course of DDAH activity in different rat tissues: kidney cortex (solid circle), liver (open circle), cerebellum (inverted solid triangle), and aorta (open triangle).
Each time point determined in triplicate.
Comparison of DDAH activity measured by l-citrulline accumulation with ADMA consumption
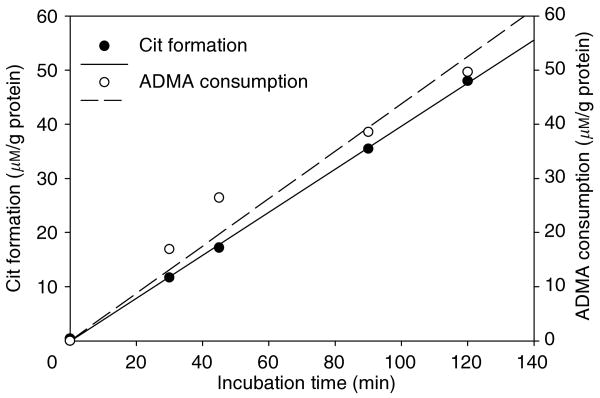
In kidney cortex, the rate of production of l-citrulline = 0.3976 μm/g protein/min and the corresponding rate of consumption of ADMA = 0.4378 μm/g protein/min are similar (Figure 3), suggesting that this assay gives a faithful measurement of DDAH activity. Other tests (Figure S2) confirmed that there was no citrulline to arginine conversion and no citrulline generation by activity of arginase or nitric oxide synthase.
Figure 3. Correlation of l-citrulline formation as a measure of DDAH activity (solid circle, solid line) with the rate of ADMA consumption (open circle, dashed line).
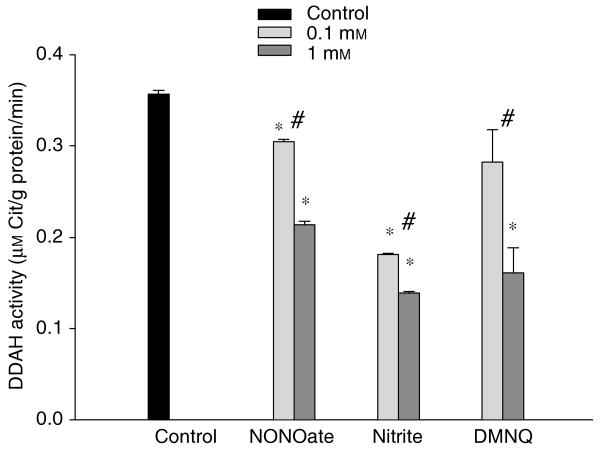
The renal cortex and medulla DDAH activity was 0.39±0.01 (n = 15) and 0.30±0.01 (n = 3) μm/g protein/min, respectively. Inter- and intra-assay coefficient of variation are 5.61±0.28% (n = 12) and 4.82±0.19% (n = 9). The NO donors and superoxide donor inhibited DDAH activity (Figure 4).
Figure 4. The effect of NO and superoxide on the l-citrulline assay to detect renal DDAH activity.
DEA NONOate and nitrite were used as NO donors; and 2,3-dimethoxy-1,4-naphthoquinone was used as superoxide donor. All measurements were in triplicate. *P<0.05 vs control; #P<0.05 0.1 mm vs 1 mm.
Discussion
We have used the Prescott–Jones method to measure kidney DDAH activity from rate of l–citrulline production and found that urea markedly raises background and must be removed; deproteinization is essential and the choice of deproteinization method influences background color; the modified method correlates well with rate of ADMA consumption; and both superoxide and NO, known to inhibit DDAH activity, produce declines in rate of l-citrulline formation in kidney homogenates.
Knipp and Vasak6 adapted the Prescott–Jones assay to a 96-well plate method for measurement of activity of the purified DDAH enzyme. However, in complex tissues, there may be agents that reduce or increase color development and alter l-citrulline metabolism. Of particular note, the development of color is not specific for l-citrulline but also occurs with urea,7 and there is a urea concentration gradient in kidney (∼4 mm in cortex and ∼20 mm in inner medulla).8 Even in renal cortex, urea accounts for more than 90% of baseline absorbance, and therefore obscures DDAH-induced changes in color due to citrulline formation. In the presence of urease, the effect of urea (up to 100 mm) can be completely removed from kidney cortex and medulla. Kulhanek et al.9 reported that urease treatment was not required for citrulline assay in liver and brain. Our results, however, demonstrate that where urea concentration is measurable, urease should be used. Although the urea effect can be prevented by initial ion-exchange chromatography,10 this is more costly and time consuming compared to urease.
Another difficulty is that the diacetyl monoxime reagent can detect protein-bound l-citrulline as well as free l-citrulline. Although no separate protein-removing step was required in the purified enzyme system,6 in tissues, protein precipitation is mandatory. We found that 4% sulfosalicylic acid gave lowest background.
Buffer/additives also influence color development, for example, 2-mercaptoethanol (in HB2) reduces color formation,5 which might explain our observation of a higher renal DDAH activity than a previous study using HB2.10 Without urease treatment, the high background color due to urea obscures DDAH-dependent l-citrulline formation until ∼ t = 45 min (Figure S1), which might also explain the longer incubation time used previously.11–13
In addition to DDAH, ornithine carbamoyltransferase and nitric oxide synthase generate l-citrulline. In this assay, activity of both enzymes can be ignored since ornithine carbamoyltransferase is not detectable in kidney and 1 mm ADMA used as substrate is a potent nitric oxide synthase inhibitor. On the other hand, l-citrulline can be converted to l-arginine by argininosuccinate synthase and lyase. However, in tissue homogenate, citrulline consumption by argininosuccinate synthase and lyase requires added aspartate15 and ATP, and we found no citrulline consumption under the conditions of our assay (Supplementary Material). Furthermore, arginases, which might indirectly increase l-citrulline consumption by increasing rate of l-arginine utilization,16 are not active since arginase inhibition did not affect l-citrulline formation and there was no l-arginine consumption.
Both oxidative and nitrosative stress have been reported to inhibit DDAH activity,17,18 and in this study we show that both superoxide and NO donors have an acute inhibitory action on renal cortex DDAH activity, measured from l-citrulline production.
In conclusion, this colorimetric assay of l-citrulline accumulation is a simple and inexpensive method optimized for detection of renal tissue DDAH activity in vitro, which agrees well with the more costly and time-consuming method of measuring ADMA consumption. This can also be adapted for other tissues, even with low activity such as cerebellum, but should be optimized before use.
Materials and Methods
Preparation of tissue and reagents
Male Sprague–Dawley rats from Harlan (Indianapolis, IN, USA) were used. Tissues were collected after perfusion with cold phosphate-buffered saline and stored at –80°C. Protein concentration was determined by Bradford assay. Tissue homogenate was adjusted to the concentration of 20 mg/ml.
Assay procedures
Several pilot studies were conducted to optimize the assay including evaluation of homogenization buffer, deproteinization reagents, and other pathways of citrulline metabolism (Supplementary Material & Table S1). Recommended assay procedures are summarized in Table 2. A time-course study was conducted with preincubation of urease with homogenates of rat kidney cortex, liver, cerebellum, and aorta, then incubation with 1 mm ADMA from 0 to 120 min. We also investigated the impact of NO and superoxide (diethylamine NONOate, sodium nitrate, and 2,3-dimethoxy-1,4-naphthoquinone) on DDAH activity.
Table 2. Recommend assay procedures/conditions for the measurement of renal cortical DDAH activity.
|
ADMA, asymmetric dimethylarginine; DDAH, dimethylarginine dimethylaminohydrolase.
Comparison of l-citrulline assay and ADMA degradation by High-pressure liquid chromatography
We compared the rate of l-citrulline production by DDAH with the rate of ADMA degradation at t = 0, 30, 45, 90, and 120 min. In this study, 400 μl of 1 mm ADMA was mixed with the 100 μl of kidney homogenate (20 mg/ml), and 100 μl of the mixture was collected for high-pressure liquid chromatography analysis of ADMA at the various times, as shown above. ADMA (and l-arginine) levels were measured in tissue homogenate using reverse-phase high-pressure liquid chromatography with the Waters AccQ-Fluor fluorescent reagent kit as published previously.19
Statistical analysis
Data are presented as mean±s.e.m. The effects of arginase inhibitor, NO, and superoxide were compared by unpaired t-test. The correlation between l-citrulline formation and ADMA consumption was analyzed by Pearson's correlation coefficient.
Supplementary Material
Supplementary Methods and Results. Optimization of homogenization buffers.
Table S1. Effect of deproteinization reagents on absorbance of blank.
Figure S1. Time course of color formation in citrulline equivalents in the presence of the DDAH substrate (ADMA), and in the absence (solid circle) and presence of urease (open circle).
Figure S2. The effect of arginase on the l -citrulline assay to detect renal DDAH activity.
Acknowledgments
These studies were supported by NIH Grant R01DK056843 and a BRP from Florida Department of Health. We thank Dr Sidney M Morris, Jr for discussion. The technical assistance of Harold Snellen is gratefully acknowledged.
References
- 1.Leiper JM, Santa Maria J, Chubb A, et al. Identification of two human dimethylarginine dimethylaminohydrolases with distinct tissue distributions and homology with microbial arginine diminishes. Biochem J. 1999;343:209–214. [PMC free article] [PubMed] [Google Scholar]
- 2.MacAllister RJ, Parry H, Kimoto M, et al. Regulation of nitric oxide synthesis by dimethylarginine dimethylaminohydrolase. Br J Pharmacol. 1996;119:1533–1540. doi: 10.1111/j.1476-5381.1996.tb16069.x. [DOI] [PMC free article] [PubMed] [Google Scholar]
- 3.Ito A, Tsao PS, Adimoolam S, et al. Novel mechanism for endothelial dysfunction: dysregulation of dimethylarginine dimethylaminohydrolase. Circulation. 1999;99:3092–3095. doi: 10.1161/01.cir.99.24.3092. [DOI] [PubMed] [Google Scholar]
- 4.Prescott LM, Jones ME. Modified methods for the determination of carbamyl aspartate. Anal Biochem. 1969;32:408–419. doi: 10.1016/s0003-2697(69)80008-4. [DOI] [PubMed] [Google Scholar]
- 5.Boyde TR, Rahmatullah M. Optimization of conditions for the colorimetric determination of l-citrulline, using diacetyl monoxime. Anal Biochem. 1980;107:424–431. doi: 10.1016/0003-2697(80)90404-2. [DOI] [PubMed] [Google Scholar]
- 6.Knipp M, Vasak M. A colorimetric 96-well microtiter plate assay for the determination of enzymatically formed l-citrulline. Anal Biochem. 2000;286:257–264. doi: 10.1006/abio.2000.4805. [DOI] [PubMed] [Google Scholar]
- 7.Gornall AG, Hunter A. A colorimetric method for the determination of l-citrulline. Biochem J. 1941;35:650–658. doi: 10.1042/bj0350650. [DOI] [PMC free article] [PubMed] [Google Scholar]
- 8.Safirstein R, Miller P, Kahn T. Cortical and papillary absorptive defects in gentamicin nephrotoxicity. Kidney Int. 1983;24:526–533. doi: 10.1038/ki.1983.189. [DOI] [PubMed] [Google Scholar]
- 9.Kulhanek V, Maderova V, Sindelarova K, Vojtiskova V. Modified determination of ornithine-carbamyl-transferase activity in biological material. Clin Chim Acta. 1963;8:579–585. doi: 10.1016/0009-8981(63)90108-6. [DOI] [PubMed] [Google Scholar]
- 10.Ogawa T, Kimoto M, Sasaoka K. Purification and properties of a new enzyme NG NG-dimethylarginine dimethylaminohydrolase, from rat kidney. J Biol Chem. 1989;264:10205–10209. [PubMed] [Google Scholar]
- 11.Stuhlinger MC, Tsao PS, Her JH, et al. Homocysteine impairs the nitric oxide synthase pathway: role of asymmetric dimethylarginine. Circulation. 2001;104:2569–2575. doi: 10.1161/hc4601.098514. [DOI] [PubMed] [Google Scholar]
- 12.Yin QF, Xiong Y. Pravastatin restores DDAH activity and endothelium-dependent relaxation of rat aorta after exposure to glycated protein. J Cardiovasc Pharmacol. 2005;45:525–532. doi: 10.1097/01.fjc.0000159642.44523.7f. [DOI] [PubMed] [Google Scholar]
- 13.Chen Y, Li Y, Zhang P, et al. Dimethylarginine dimethylaminohydrolase and endothelial dysfunction in failing hearts. Am J Physiol Heart Circ Physiol. 2005;289:H2212–H2219. doi: 10.1152/ajpheart.00224.2005. [DOI] [PubMed] [Google Scholar]
- 14.Edmonds MS, Lowry KR, Baker DH. Urea cycle metabolism: effects of supplemental ornithine or l-citrulline on performance, tissue amino acid concentrations and enzymatic activity in young pigs fed arginine-deficient diets. J Anim Sci. 1987;65:706–716. doi: 10.2527/jas1987.653706x. [DOI] [PubMed] [Google Scholar]
- 15.Ratner S, Petrack B. Biosynthesis of urea. IV. Further studies on condensation in arginine synthesis from citrulline. J Biol Chem. 1953;200:161–174. [PubMed] [Google Scholar]
- 16.Curis E, Nicolis I, Moinard C, et al. Almost all about l-citrulline in mammals. Amino Acids. 2005;29:177–205. doi: 10.1007/s00726-005-0235-4. [DOI] [PubMed] [Google Scholar]
- 17.Knipp M. How to control NO production in cells: N(omega), N(omega)-dimethyl-l-arginine dimethylaminohydrolase as a novel drug target. Chembiochem. 2006;7:879–889. doi: 10.1002/cbic.200500527. [DOI] [PubMed] [Google Scholar]
- 18.Leiper J, Murray-Rust J, McDonald N, Vallance P. S-nitrosylation of dimethylarginine dimethylaminohydrolase regulates enzyme activity: further interactions between nitric oxide synthase and dimethylarginine dimethylaminohydrolase. Proc Natl Acad Sci USA. 2002;99:13527–13532. doi: 10.1073/pnas.212269799. [DOI] [PMC free article] [PubMed] [Google Scholar]
- 19.Tain YL, Freshour G, Dikalova A, et al. Vitamin E reduces glomerulosclerosis, restores renal neuronal NOS, and suppresses oxidative stress in the 5/6 nephrectomized rat. Am J Physiol Renal Physiol. 2007;292:F1404–F1410. doi: 10.1152/ajprenal.00260.2006. [DOI] [PubMed] [Google Scholar]
Associated Data
This section collects any data citations, data availability statements, or supplementary materials included in this article.
Supplementary Materials
Supplementary Methods and Results. Optimization of homogenization buffers.
Table S1. Effect of deproteinization reagents on absorbance of blank.
Figure S1. Time course of color formation in citrulline equivalents in the presence of the DDAH substrate (ADMA), and in the absence (solid circle) and presence of urease (open circle).
Figure S2. The effect of arginase on the l -citrulline assay to detect renal DDAH activity.


