Abstract
The first step in microRNA (miRNA) biogenesis occurs in the nucleus and is mediated by the Microprocessor complex containing the RNase III-like enzyme Drosha and its cofactor DGCR8. Here we show that the 5′→3′ exonuclease Xrn2 associates with independently transcribed miRNAs and, in combination with Drosha processing, attenuates transcription in downstream regions. We suggest that, after Drosha cleavage, a torpedo-like mechanism acts on nascent long precursor miRNAs, whereby Xrn2 exonuclease degrades the RNA polymerase II-associated transcripts inducing its release from the template. While involved in primary transcript termination, this attenuation effect does not restrict clustered miRNA expression, which, in the majority of cases, is separated by short spacers. We also show that transcripts originating from a miRNA promoter are retained on the chromatin template and are more efficiently processed than those produced from mRNA or snRNA Pol II-dependent promoters. These data imply that coupling between transcription and processing promotes efficient expression of independently transcribed miRNAs.
It is well documented that efficient and regulated mRNA biogenesis is ensured by coupling processing to transcription within the framework of an “mRNA factory” comprising the elongating RNA polymerase II (Pol II) and the associated processing factors. This machinery relies on a complex network of protein interactions leading to the release from chromatin of properly modified and “marked” mRNAs (19, 24, 27). Notably, this complex apparatus also provides a quality control mechanism that prevents “incorrect” molecules from progressing along the maturation pathway (1). It has been previously shown in yeast (Saccharomyces cerevisiae) that snoRNA biogenesis also relies on a specific “factory” in which transcription and termination events are intimately coupled to processing and release of correctly assembled snoRNP particles (2, 22). In eukaryotes, Pol II is also responsible for the transcription of a different class of transcripts, the microRNAs (miRNAs). The tiny single-stranded miRNA molecules are transcribed as long precursors, pri-miRNAs. More than half of the human miRNA genes are carried within introns of both coding and noncoding genes, while others are transcribed as independent monocistronic or polycistronic units (16). The Microprocessor complex, containing the RNase III-like enzyme Drosha and its cofactor DGCR8, converts the nascent pri-miRNAs into small 60- to 90-nucleotide-long hairpins. For intron-encoded miRNAs, cotranscriptional Drosha cleavage was shown to occur before splicing without affecting the release of spliced mRNA (16, 23). Moreover, the exosome and Xrn2 exonuclease activities were shown to mediate intronic clearance, while the exonic regions, protected from degradation by tethering to the elongating Pol II complex, could undergo efficient splicing (9, 23). Here we show that the 5′→3′ Xrn2 exonuclease also associates with chromatin of intergenic miRNA genes. In this situation, the action of the Xrn2 exonuclease following Drosha cleavage induces transcriptional termination. Moreover, we analyzed the ubiquitous miR-23a-1 promoter (18) and found that it efficiently drives the processing of a downstream miRNA by the enhanced recruitment of Drosha.
MATERIALS AND METHODS
Plasmid construction.
All constructs were generated in pCDNA3.1+ (Invitrogen) without the T7 promoter. Derived plasmids were generated by replacing the cytomegalovirus (CMV) promoter with miR-23a-1, PGK, and U1 promoters amplified from genomic DNA (pr23a-F and pr23a-R, prPGK-F and prPGK-R, and prU1-F and prU1-R oligonucleotide pairs, respectively). The BGH pA site was deleted by inverse PCR. miR, PGK, U1, and CMV constructs were generated by inserting the miR-223-containing region (amplified with the 223WTF and 223-200R oligonucleotide pair) in all derived plasmids. Constructs t-WT0.2, t-WT0.5, and t-WT1.5 were obtained by fusing miR-223 (oligonucleotide pair 223WT-F and 223+200-R or 223+500-R or 223+1500-R) to miR-196a-1 (oligonucleotide pair 196-F and 196-R). In t-WT2.0, a region downstream of miR-223 coding sequence (oligonucleotide pair 223+2200-F and 223+2200-R) was inserted upstream of miR-196a-1. t-mut and t-X were obtained by inverse PCR (oligonucleotide pair pr23a-R and 223SHORT-F and oligonucleotide pair 223Δ-F and 223Δ-R). The miR-507∼ miR-506 cluster was cloned in pcDNA-miR-23P (oligonucleotide pair 507∼506-F and 507∼506-R), and 507-X constructs were generated by inverse PCR (oligonucleotide pair pr23a-R and 507Δ-F). 507-WT/X constructs and t-3.0 constructs were extended by inserting a common stuffer region (oligonucleotide pair stuffer-F and stuffer-R). Oligonucleotide sequences are listed in Table S1 in the supplemental material.
Cell culture, RNA extraction, and analysis.
HeLa cells were grown and transfected as previously described (23). RNAs were isolated with TRIzol reagent (Invitrogen). Poly(A) species were oligo(dT) reverse transcribed and subjected to PCR coamplification (oligonucleotide pairs pri-223-F and pri-223-R and neo-F and neo-R). Northern blot analysis was performed with the αmiR-223, αmiR-196 (5′-CCAACAACATGAAACTACCTA-3′), and αU6 32P-labeled probes. Densitometric analysis was performed using Typhoon Imager (GE Healthcare) and Optiquant software.
miRNA quantification was performed by TaqMan miRNA detection (Applied Biosystems). RNU6B was used as a calibrator. The relative quantity of each miRNA was calculated using SDS System software version 1.4 (Applied Biosystems).
In Xrn2 and nuclear fractionation experiments, reverse transcription (RT) was performed in the presence of random examers. cDNA was amplified by quantitative real-time RT-PCR (qRT-PCR). Absolute quantification of each specific fragment was performed using Power SYBR green (Applied Biosystems). The oligonucleotide pairs were C-F and C-R, 5′-let7 and 3′-let7, neo-F and neo-R, 3′-ACT-F and 3′-ACT-R, actEX3-F and actEX3-R, p23-tr-F or CMV-tr-F and miR223WT-R, and GFP-F and GFP-R (green fluorescent protein) (see Table S1 in the supplemental material). All reactions were performed in triplicate.
ChIP assay.
Chromatin immunoprecipitation (ChIP) and qRT-PCR analyses on endogenous loci were carried out as previously described (11). Drosha (Abcam), Pol II (N-20; Santa Cruz) or Xrn2 antibodies (14) were utilized. PCR amplifications were performed with oligonucleotide pairs miR-23a1-F and miR-23a1-R, let-7a1-F and let7a1-R, 3′-ACT-F and 3′-ACT-R, actEX3-F and actEX3-R, and tRNAglu-F and tRNAglu-R. ChIP analysis of transfected plasmids was carried out as described in reference 23: “a” regions in tandem constructs were amplified with miR23a1prom-F and miR-223WT-R or miR-223 mut-R, while “b” regions were amplified with miR-196-F and α-pCDNA-R. Chromatin from miR, PGK, U1, and CMV constructs was amplified with the oligonucleotides miR23a1prom-F, prPGK-F, U1-tr-F, and CMV-tr-F in combination with miR-223WT-R. The occupancy of the immunoprecipitated factor was estimated by normalizing for amplification efficiency and subtraction of background (5). Raw data for Drosha and Pol II ChIP are listed in Fig. S3A in the supplemental material. Oligonucleotide sequences are listed in Table S1 in the supplemental material.
Fractionation of chromatin-associated and nucleoplasmic transcripts.
Nuclear fractionation and RNA extraction from the cytoplasmic, nucleoplasmic, and chromatin fractions (see Fig. S4 in the supplemental material) were performed as previously described (9).
Xrn2 RNAi and Western blot analysis.
Xrn2 knockdown and protein detection have been described previously (32). GAPDH (glyceraldehyde-3-phosphate dehydrogenase) antibody (Santa Cruz) was used at a 1:5,000 dilution.
Bioinformatic analysis.
Human pre-miRNAs were categorized according to their genomic locations using a modified version of miRGen algorithm (20) and relative distance. A list of the hairpins whose relative distance was less than 10 kb was clustered in subcategories according to the distance.
RESULTS
The majority of clustered miRNA have short spacers.
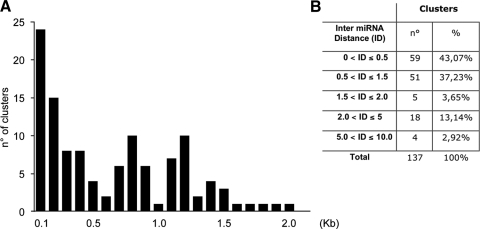
Previous bioinformatics analysis classified as clustered those miRNAs spaced less than 50 kb apart, with 89% of these clusters spaced less than 5 kb apart (20). Using the miRbase database (13), we filtered the data for intergenic clusters and analyzed their distance distribution up to 10 kb apart (distances between Drosha cleavage sites). We found that the different units follow specific distributions in which ∼43% of the miRNAs are <0.5 kb apart, ∼37% are between 0.5 and 1.5 kb apart, and ∼3.6% are between 1.2 and 2.0 kb apart (Fig. 1). In a minority of cases, miRNAs are spaced >2.0 kb apart. However, since no expression studies have been performed, it cannot be assumed that these widely spaced miRNAs represent polycistronic units.
FIG. 1.
Genomic clusters display distance constraints. (A) Histogram showing the number of miRNA clusters (y axis) falling in each spacing category, spanning from 0.1 to 2.0 kb (x axis); (B) table showing the number of clusters in each distance subcategory (inter-miRNA distance [ID]).
These findings indicate a preferential distribution of clustered miRNAs to closely spaced units, suggesting the existence of a selection constraint that restricts the distance between miRNAs of the same transcriptional unit.
Drosha cleavage affects downstream transcription.
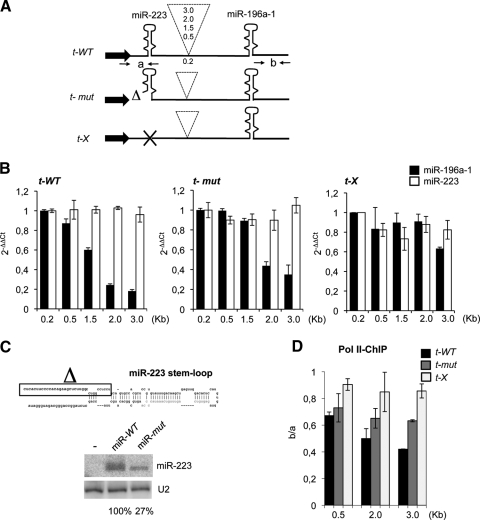
To examine whether the expression of clustered miRNAs is affected by the spacer length, we generated minigene constructs containing dicistronic transcriptional units using two miRNAs, miR-223 and miR-196a-1, that are not expressed in HeLa cells (10, 34). These were separated by increasing distances with their transcription driven by the constitutive miR-23a∼27a∼24-2 gene promoter (18) (Fig. 2A). After transfection into HeLa cells, miR-223 and miR-196a-1 abundance was measured by qRT-PCR using miRNA-specific TaqMan probes (Fig. 2B). While the distance did not affect miR-223 levels, a progressive reduction of miR-196a-1 accumulation was observed in the constructs with longer spacers, with a residual 20% accumulation when the distance was increased to 3.0 kb (Fig. 2B; t-WT constructs). Since it has been shown that Drosha processing occurs during pri-miRNA transcription (23), we tested whether efficient cotranscriptional processing of miR-223 affected the decrease in miR-196a-1 accumulation. Notably, miR-196a-1 levels were less affected when the upstream pri-miR-223 contained a mutation in the Drosha cleavage site (t-mut constructs) which reduced miR-223 levels to 27% (Fig. 2C). Finally, abrogation of upstream cleavage, by deletion of the entire pre-miR-223 sequence (t-X constructs), maintained high levels of miR-196a-1 in all constructs (Fig. 2B). While for t-WT and t-mut, the expression of miR-196a-1 was compared with that of the cotranscribed miR-223, for t-X constructs, this was normalized to the levels of a cotransfected miR-223-expressing plasmid. These data indicate that the accumulation of the downstream miRNA inversely correlates with the distance and integrity of the upstream miRNA Drosha cleavage site.
FIG. 2.
Drosha cleavage induces transcriptional attenuation. (A) Schematic representation of dicistronic constructs containing pre-miR-223 and pre-miR-196a-1 under the control of the miR-23a promoter (black arrow) Spacer lengths are indicated in the dashed insert. t-WT contains wild-type pri-miR-223, t-mut has a suboptimal Drosha cleavage site, and t-X lacks the miR-223 hairpin. (B) Histograms show the level of miR196a-1 and miR-223 accumulation measured by qRT-PCR analysis on total RNA. For t-X constructs, miR196a-1 values were compared with the levels of miR-223 expressed from a cotransfected plasmid. 2−ΔΔCt, threshold cycle. (C) The upper panel shows human pre-miR-223 and 5′→3′ flanking sequences. The boxed sequence has been deleted in the t-mut constructs. For the lower panel, Northern blot analysis was performed with 10 μg of total RNA from HeLa cells untreated (lane −) or transfected with miR-WT or miR-mut plasmids. U2 snRNA was used as the loading control. Quantitation of the signals is shown below each lane. (D) Pol II ChIP of t-WT, t-mut, and t-X constructs containing 0.5-, 2.0-, and 3.0-kb spacer sequences. The y axis shows ChIP values as ratios of “b” versus “a” regions. Oligonucleotide pairs (“a” and “b”) are positioned as indicated by arrows in panel A. Error bars show standard errors of the mean based on three independent experiments.
Primer extension and 3′ rapid amplification of cDNA ends analyses indicated the occurrence of correct processing at the Drosha cleavage site and the absence of cryptic polyadenylation in the spacer region utilized (see Fig. S1A and B in the supplemental material).
ChIP analysis with Pol II antibodies was performed on t-WT, t-mut, and t-X constructs containing 0.5-, 2.0-, and 3.0-kb spacers. Figure 2D shows that when the upstream hairpin is a canonical substrate for Drosha, Pol II density on the miR-196a-1 region decreases with the distance. A smaller reduction of Pol II loading was observed when the upstream miRNA was a subcanonical Drosha substrate, whereas, no significant changes were observed with the t-X constructs. Therefore, these data indicate that efficient Drosha cleavage is able to induce transcriptional attenuation.
We then predicted that the distance between miRNAs in endogenous clusters might have been selected during evolution to ensure that each miRNA is in the suitable genomic context for proper expression. We therefore asked whether we could alter the expression of naturally clustered miRNAs by changing their relative distance.
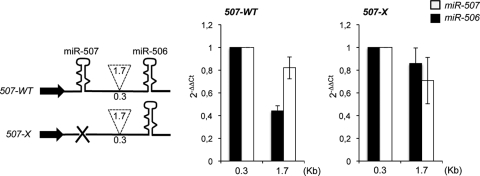
The 0.3-kb spacer region of the miR-507∼miR-506 cluster was increased to 1.7 kb. In agreement with previous data, the accumulation of the downstream miRNA was reduced by increasing the distance (Fig. 3; 507-WT). Moreover, this effect was almost abolished when the upstream miRNA was deleted (Fig. 3, 507-X).
FIG. 3.
Distance effect on natural clusters. (Left panel) Schematic representation of miR-507∼miR-506 cluster constructs. Spacer lengths are indicated in the dashed insert. (Middle and right panels) Histograms showing the level of miR-506 and miR-507 accumulation measured by qRT-PCR. For 507-X constructs, miR-506 values were compared with the levels of miR-507 expressed from a cotransfected plasmid. 2−ΔΔCt, threshold cycle. Error bars show standard errors of the mean based on three independent experiments.
Taken together, these results suggest that spacers longer than 1.5 kb are detrimental for the synthesis of 3′-located miRNAs, if canonical Drosha sites are present in the upstream miRNAs.
Xrn2 is involved in Drosha-mediated transcriptional attenuation.
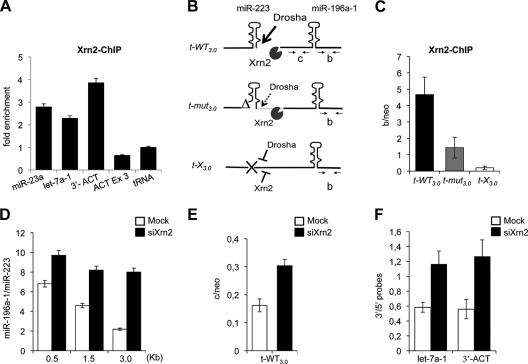
By analogy with the torpedo model (6, 31), a possible candidate for the decrease in Pol II density on downstream regions as a consequence of Drosha cleavage is the 5′→3′ exonuclease Xrn2 (32). ChIP analysis, shown in Fig. 4A, indicated that Xrn2 exonuclease is present at the sites of endogenous miR-23a-1 and let-7a-1 loci. In this experiment, the termination region of the β-actin gene (3′-ACT) was utilized as a positive control (14), while the β-actin exon 3 (ACT Ex3) and a tRNA gene provided background values.
FIG. 4.
Xrn2 is associated with miRNA chromatin. (A) Xrn2 ChIP on endogenous miR-23a-1 and let-7a-1 loci. The downstream region of the β-actin gene poly(A) site (3′-ACT) was used as the positive control. β-actin (ACT Ex3) and tRNA coding regions act as negative controls. The histogram shows enrichments over the tRNA. (B) Schematic representation of Drosha and Xrn2 action together with the oligonucleotides utilized. The drawing corresponds to nascent pri-miRNAs transcribed from the different tandem constructs. (C) Xrn2 ChIP on chromatin from t-WT3.0-, t-mut3.0-, and t-X3.0-transfected cells. The histogram shows the ratio between Xrn2 immunoprecipitation values in “b” regions (B) and the neomycin gene (“neo”) carried by each plasmid. (D) The histogram shows miR-196a-1 accumulation from mock- or Xrn2-depleted cells (white and black bars, respectively), transfected with three different tandem constructs. The relative ratios between miR-196a-1 and miR-223 obtained from Northern blot signal quantification (y axis) for the different t-WT constructs utilized (x axis) are indicated. Gels are provided in Fig. S2B in the supplemental material. (E) RNA analysis of 3′-cutoff transcripts from the t-WT3.0 construct expressed in mock- and Xrn2-depleted cells. qRT-PCR for the “c” region (B) and neomycin gene was performed with the C-F and C-R and neo-F and neo-R oligonucleotide pairs. (F) let-7a-1∼let-7f and β-actin transcript analysis in mock- and Xrn2-depleted cells. The histogram shows the levels of the 3′-cutoff products identified by qRT-PCR normalized against specific 5′ regions (3′/5′ probes). Positions of the oligonucleotide pairs are shown in Fig. S2C in the supplemental material. Error bars show standard errors of the mean based on three independent experiments.
To test whether Xrn2 recruitment depends on the availability of entry sites generated by Drosha cleavage, ChIP analysis with Xrn2 antibodies was performed on the t-WT3.0-, t-mut3.0-, and t-X3.0-transfected cells (Fig. 4B). The amount of Xrn2 was measured across the miR-196a-1 coding region (“b”) and compared to signal obtained on the neomycin (“neo”) gene present on the same plasmid. Xrn2 recruitment was detectable on the miR-196a-1 region following efficient miR-223 Drosha cleavage (Fig. 4C; t-WT); whereas, Xrn2 binding to the downstream miRNA was reduced to 30% when processing of the upstream miRNA was inefficient (t-mut). Furthermore, Xrn2 interaction was completely undetectable on the t-X chromatin, where no upstream cleavage occurs.
HeLa cells transfected with t-WT were subjected to Xrn2-specific small interfering RNA treatment (see Fig. S2A in the supplemental material). The effect of Xrn2 knockdown on the relative levels of mature miR-223 and miR-196a-1 in differently-spaced tandem constructs was determined (Fig. 4D and see Fig. S2B in the supplemental material). A recovery of the downstream miRNA was observed in all cases: in particular, the 3.0-kb construct, which displayed the strongest attenuation effect (Fig. 2B), showed a fourfold increase in miR-196a-1 accumulation (Fig. 4D) and almost a twofold increase in stabilization of 3′-cutoff molecules (Fig. 4E). A similar stabilizing effect was observed for the endogenous let-7a-1∼let-7f-1 intermediate cleavage product and for the 3′-ACT-positive control (Fig. 4F). These data are indicative of a direct Xrn2 involvement in miRNA biogenesis; in particular in the degradation of 3′-cutoff products generated following Drosha cleavage.
A miRNA promoter favors efficient cotranscriptional Drosha recruitment.
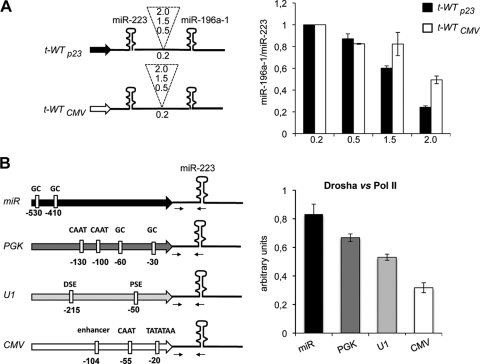
Since miRNA genes are known to be transcribed by Pol II, we tested whether a transcriptional attenuation effect could also occur in the presence of a strong and canonical Pol II promoter. Therefore, the miRNA promoter of the t-WT constructs was replaced by the constitutive CMV promoter (Fig. 5A, left panel). The histogram in Fig. 5A (right panel) shows a reduced attenuation effect when transcription was driven from the CMV promoter. Due to the effect of the Microprocessor complex on transcriptional attenuation, we tested whether various Pol II-dependent promoters could differentially contribute to Drosha recruitment to the downstream hairpin. The p23, PGK, U1 snRNA, and CMV promoters were cloned upstream to pri-miR-223, and Drosha loading was tested in vivo by ChIP analysis.
FIG. 5.
Effects of miRNA, mRNA, and snRNA Pol II promoters on Drosha recruitment. (A) The left panel shows a schematic representation of the t-WTp23 (black arrow) and t-WTCMV (white arrow) dicistronic constructs. Spacer lengths are indicated in the dashed insert. The right panel is a histogram showing the ratio of miR196a-1 to miR-223 accumulation levels measured by qRT-PCR. (B) The left panel shows a schematic representation of the miR, PGK, U1, and CMV constructs. Regulatory sequence elements of each promoter are boxed in white. The right panel show a histogram of Drosha versus Pol II ChIP on PGK, U1, and CMV constructs after cotransfection with the miR construct in HeLa cells. The amplified regions are indicated by the arrows in the scheme. Raw data for Drosha and Pol II ChIP are listed in Fig. S3A in the supplemental material. Error bars show standard errors of the mean based on three independent experiments.
Figure 5B shows that among the promoters, the miRNA promoter displays the most efficient Drosha recruitment. The other promoters have reduced activity which reaches the lowest level in the case of the CMV promoter. Notably, compared to the CMV promoter, the miRNA promoter displayed also a more efficient Xrn2 recruitment (see Fig. S3B in the supplemental material).
Moreover, when a poly(A) signal was inserted downstream to the pre-miR-223 coding sequence in miR-WT and CMV-WT constructs, miRNA transcripts arising from the miR promoter were retained to the chromatin and efficiently processed, while those originating from the CMV promoter were rapidly released from the chromatin mainly as polyadenylated species (see Fig. S4 in the supplemental material).
DISCUSSION
The realization that mRNA transcription by RNA Pol II and processing of nascent precursors are closely connected events (3, 27) has led to a consensus view that the general “RNA factory” model can be extended to other Pol II genes (2, 22). Coupling between transcription and processing has also been demonstrated for intron-encoded miRNAs. Thus, the Microprocessor complex was shown to be recruited to the sites of host pre-mRNA transcription and to cleave pri-miRNA transcripts during ongoing transcription (16, 23).
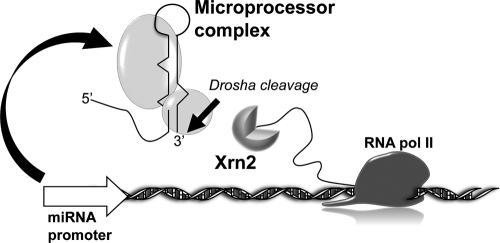
Here we show that for intergenic miRNAs, the cotranscriptional processing is coupled with termination. As a consequence of Drosha cleavage, Pol II release occurs in downstream regions. Searching for the mechanism of this attenuation, we establish the involvement of the 5′→3′ Xrn2 exonuclease. Thus, we show that Xrn2 is recruited to sites of miRNA transcription and that its depletion promotes transcriptional readthrough. These data suggest that, similarly to the torpedo model proposed for mRNAs (4, 31, 32, 33), after Drosha cleavage of the pri-miRNA transcript, exposure of an unprotected 5′ end offers a substrate for Xrn2 recruitment. The exonuclease acts to degrade the 3′-cutoff product resulting in Pol II template destabilization and transcription termination.
We also show that the position at which termination occurs depends on the efficiency of Drosha cleavage, since mutations in the Microprocessor cleavage site, or its deletion, allow Pol II to extend over greater distances. According to these findings, we predict that the distance between tandem miRNAs may have been appropriately selected in order to prevent a polarity effect on the production of the downstream miRNA. Short distances ensure that even if upstream Drosha cleavage occurs efficiently, the Xrn2 exonuclease will not catch the polymerase before transcription has proceeded into the downstream miRNA sequence. Alternatively, for longer distances between adjacent miRNAs, Pol II processivity, Drosha recruitment and cleavage, and Xrn2 trimming should be appropriately balanced to ensure the synthesis of all the members of the cluster. Our bioinformatics analysis reveals that 80% of endogenous clusters have spacer sequences shorter than 1.5 kb. Notably, in our artificial dicistronic constructs, the attenuation effect becomes relevant above 1.5 kb. Therefore, it can be suggested that longer spacing provides a way for nonstoichiometric production of clustered miRNAs or for imposing posttranscriptional control through Drosha activators or repressors.
In conclusion, transcriptional attenuation, as a consequence of Drosha cleavage, may only be involved in primary transcript termination without affecting the expression of the majority of clustered miRNAs.
This study also reveals that an miRNA promoter, in contrast to mRNA or snRNA Pol II promoters, favors the recruitment of Drosha on nascent transcripts. Possibly, the miRNA promoter acts either by favoring the recruitment of factors that in turn mediate Drosha loading or by retaining the transcript at chromatin sites where Drosha is localized. Several reports have previously demonstrated the existence of specific factors (some of which are Drosha interactors) that can modulate processing of pri-miRNAs (8, 12, 15, 28). This allows speculation that regulation mediated by auxiliary factors may operate early during transcription and affect Drosha recruitment or its affinity for the substrate. Alternatively, a miRNA promoter may drive less processive transcription providing more time for Drosha-pri-miRNA interaction to occur. Promoter structure and recruitment of transcription factors or coactivators may also affect polymerase processivity by conferring different elongation properties to the enzyme (17).
Moreover, in agreement with previous observations, our data suggest that poly(A) signals interfere with miRNA maturation, very likely by mislocalizing the pri-miRNA from the sites of Microprocessor action (7, 25, 26). Even though the utilization of poly(A) sites is detrimental for efficient miRNA biogenesis, their occurrence downstream of many miRNA transcriptional units (29) could act in a quality control mechanism. In contrast to mRNA coding genes, where poly(A) sites direct efficient export to the cytoplasm, for miRNA transcriptional units they may represent a way of preventing transcriptional readthrough to downstream sequences when correct processing has not occurred. This is resonant with snoRNA transcription where incorrect 3′-end processing leads to readthrough, unless poly(A) sites are present in the downstream regions (21, 30).
By analogy with previous findings, linking Pol II transcription with tightly coupled processing of nascent pre-mRNAs (3, 19), we suggest that transcription, processing, and termination of pri-miRNAs are also closely connected events (Fig. 6).
FIG. 6.
The “miRNA factory” model. Coupling between transcription and RNA processing of independently transcribed miRNAs is shown.
Supplementary Material
Acknowledgments
We thank Massimo Arceci for technical assistance.
This work was partly supported by EU projects SIROCCO and RIGHT (LSHG-CT-2006-037900 and LSHB-CT-2004-005276), AIRC, PRIN, and BEMM to I.B. and by the ESF project NuRNASu to I.B. and N.J.P. C.D. is supported by a Microsoft Research fellowship. N.J.P.'s laboratory is supported by a Wellcome Trust Programme Grant.
Footnotes
Published ahead of print on 10 August 2009.
Supplemental material for this article may be found at http://mcb.asm.org/.
REFERENCES
- 1.Aguilera, A. 2005. Cotranscriptional mRNP assembly: from the DNA to the nuclear pore. Curr. Opin. Cell Biol. 17:242-250. [DOI] [PubMed] [Google Scholar]
- 2.Ballarino, M., M. Morlando, F. Pagano, A. Fatica, and I. Bozzoni. 2005. The cotranscriptional assembly of snoRNPs controls the biosynthesis of H/ACA snoRNAs in Saccharomyces cerevisiae. Mol. Cell. Biol. 25:5396-5403. [DOI] [PMC free article] [PubMed] [Google Scholar]
- 3.Bentley, D. 2002. The mRNA assembly line: transcription and processing machines in the same factory. Curr. Opin. Cell Biol. 14:336-342. [DOI] [PubMed] [Google Scholar]
- 4.Buratowski, S. 2005. Connections between mRNA 3′ end processing and transcription termination. Curr. Opin. Cell Biol. 17:257-261. [DOI] [PubMed] [Google Scholar]
- 5.Chakrabarti, S. K., J. C. James, and R. G. Mirmira. 2002. Quantitative assessment of gene targeting in vitro and in vivo by the pancreatic transcription factor, Pdx1. Importance of chromatin structure in directing promoter binding. J. Biol. Chem. 277:13286-13293. [DOI] [PubMed] [Google Scholar]
- 6.Connelly, S., and J. L. Manley. 1988. A functional mRNA polyadenylation signal is required for transcription termination by RNA polymerase II. Genes Dev. 2:440-452. [DOI] [PubMed] [Google Scholar]
- 7.Custodio, N., M. Carmo-Fonseca, F. Geraghty, H. S. Pereira, F. Grosveld, and M. Antoniou. 1999. Inefficient processing impairs release of RNA from the site of transcription. EMBO J. 18:2855-2866. [DOI] [PMC free article] [PubMed] [Google Scholar]
- 8.Davis, B. N., A. C. Hilyard, G. Lagna, and A. Hata. 2008. SMAD proteins control DROSHA-mediated microRNA maturation. Nature 454:56-61. [DOI] [PMC free article] [PubMed] [Google Scholar]
- 9.Dye, M. J., N. Gromak, and N. J. Proudfoot. 2006. Exon tethering in transcription by RNA polymerase II. Mol. Cell 21:849-859. [DOI] [PubMed] [Google Scholar]
- 10.Fazi, F., A. Rosa, A. Fatica, V. Gelmetti, M. L. De Marchis, C. Nervi, and I. Bozzoni. 2005. A minicircuitry comprised of microRNA-223 and transcription factors NFI-A and C/EBPalpha regulates human granulopoiesis. Cell 123:819-831. [DOI] [PubMed] [Google Scholar]
- 11.Forsberg, E. C., K. M. Downs, H. M. Christensen, H. Im, P. A. Nuzzi, and E. H. Bresnick. 2000. Developmentally dynamic histone acetylation pattern of a tissue-specific chromatin domain. Proc. Natl. Acad. Sci. USA 97:14494-14499. [DOI] [PMC free article] [PubMed] [Google Scholar]
- 12.Gregory, R. I., K. P. Yan, G. Amuthan, T. Chendrimada, B. Doratotaj, N. Cooch, and R. Shiekhattar. 2004. The Microprocessor complex mediates the genesis of microRNAs. Nature 432:235-240. [DOI] [PubMed] [Google Scholar]
- 13.Griffiths-Jones, S., H. K. Saini, S. van Dongen, and A. J. Enright. 2008. miRBase: tools for microRNA genomics. Nucleic Acids Res. 36:D154-D158. [DOI] [PMC free article] [PubMed] [Google Scholar]
- 14.Gromak, N., S. West, and N. J. Proudfoot. 2006. Pause sites promote transcriptional termination of mammalian RNA polymerase II. Mol. Cell. Biol. 26:3986-3996. [DOI] [PMC free article] [PubMed] [Google Scholar]
- 15.Guil, S., and J. F. Cáceres. 2007. The multifunctional RNA-binding protein hnRNP A1 is required for processing of miR-18a. Nat. Struct. Mol. Biol. 4:591-596. [DOI] [PubMed] [Google Scholar]
- 16.Kim, Y. K., and V. N. Kim. 2007. Processing of intronic microRNAs. EMBO J. 26:775-783. [DOI] [PMC free article] [PubMed] [Google Scholar]
- 17.Kornblihtt, A. R. 2005. Promoter usage and alternative splicing. Curr. Opin. Cell Biol. 17:262-268. [DOI] [PubMed] [Google Scholar]
- 18.Lee, Y., M. Kim, J. Han, K. H. Yeom, S. Lee, S. H. Baek, and V. N. Kim. 2004. MicroRNA genes are transcribed by RNA polymerase II. EMBO J. 23:4051-4060. [DOI] [PMC free article] [PubMed] [Google Scholar]
- 19.Maniatis, T., and R. Reed. 2002. An extensive network of coupling among gene expression machines. Nature 416:499-506. [DOI] [PubMed] [Google Scholar]
- 20.Megraw, M., P. Sethupathy, B. Corda, and A. G. Hatzigeorgiou. 2007. miRGen: a database for the study of animal microRNA genomic organization and function. Nucleic Acids Res. 35:149-155. [DOI] [PMC free article] [PubMed] [Google Scholar]
- 21.Morlando, M., P. Greco, B. Dichtl, A. Fatica, W. Keller, and I. Bozzoni. 2002. Functional analysis of yeast snoRNA and snRNA 3′-end formation mediated by uncoupling of cleavage and polyadenylation. Mol. Cell. Biol. 22:1379-1389. [DOI] [PMC free article] [PubMed] [Google Scholar]
- 22.Morlando, M., M. Ballarino, P. Greco, E. Caffarelli, B. Dichtl, and I. Bozzoni. 2004. Coupling between snoRNP assembly and the transcriptional/3′ processing apparatus controls box C/D snoRNA biosynthesis in yeast. EMBO J. 23:2392-2401. [DOI] [PMC free article] [PubMed] [Google Scholar]
- 23.Morlando, M., M. Ballarino, N. Gromak, F. Pagano, I. Bozzoni, and N. J. Proudfoot. 2008. Primary micro-RNA transcripts are processed co-transcriptionally. Nat. Struct. Mol. Biol. 15:902-909. [DOI] [PMC free article] [PubMed] [Google Scholar]
- 24.Orphanides, G., and D. Reinberg. 2002. A unified theory of gene expression. Cell 108:439-451. [DOI] [PubMed] [Google Scholar]
- 25.Pawlicki, J. M., and J. A. Steitz. 2008. Primary microRNA transcript retention at sites of transcription leads to enhanced microRNA production. J. Cell Biol. 182:61-76. [DOI] [PMC free article] [PubMed] [Google Scholar]
- 26.Pawlicki, J. M., and J. A. Steitz. 2009. Subnuclear compartmentalization of transiently expressed polyadenylated pri-microRNAs: processing at transcription sites or accumulation in SC35 foci. Cell Cycle 8:345-356. [DOI] [PMC free article] [PubMed] [Google Scholar]
- 27.Proudfoot, N. J., A. Furger, and M. J. Dye. 2002. Integrating mRNA processing with transcription. Cell 108:501-512. [DOI] [PubMed] [Google Scholar]
- 28.Roush, S., and F. J. Slack. 2008. The let-7 family of microRNAs. Trends Cell Biol. 18:505-516. [DOI] [PubMed] [Google Scholar]
- 29.Saini, H. K., S. Griffiths-Jones, and A. J. Enright. 2007. Genomic analysis of human microRNA transcripts. Proc. Natl. Acad. Sci. USA 104:17719-17724. [DOI] [PMC free article] [PubMed] [Google Scholar]
- 30.Steinmetz, E. J., S. B. H. Ng, J. P. Cloute, and D. A. Brow. 2006. cis- and trans-acting determinants of transcription termination by yeast RNA polymerase II. Mol. Cell. Biol. 26:2688-2696. [DOI] [PMC free article] [PubMed] [Google Scholar]
- 31.Tollervey, D. 2004. Molecular biology: termination by torpedo. Nature 432:456-457. [DOI] [PubMed] [Google Scholar]
- 32.West, S., N. Gromak, and N. J. Proudfoot. 2004. Human 5′→3′ exonuclease Xrn2 promotes transcription termination at co-transcriptional cleavage sites. Nature 432:522-525. [DOI] [PubMed] [Google Scholar]
- 33.West, S., N. J. Proudfoot, and M. J. Dye. 2008. Molecular dissection of mammalian RNA polymerase II transcriptional termination. Mol. Cell 29:600-610. [DOI] [PMC free article] [PubMed] [Google Scholar]
- 34.Yekta, S., I. H. Shih, and D. P. Bartel. 2004. MicroRNA-directed cleavage of HOXB8 mRNA. Science 304:594-596. [DOI] [PubMed] [Google Scholar]
Associated Data
This section collects any data citations, data availability statements, or supplementary materials included in this article.


