Abstract
We describe a non-contact profile correction technique for quantitative, wide-field optical measurement of tissue absorption (µa) and reduced scattering (µs’) coefficients, based on geometric correction of the sample’s Lambertian (diffuse) reflectance intensity. Since the projection of structured light onto an object is the basis for both phase-shifting profilometry and modulated imaging, we were able to develop a single instrument capable of performing both techniques. In so doing, the surface of the 3-dimensional object could be acquired and used to extract the object’s optical properties. The optical properties of flat polydimethylsiloxane (silicone) phantoms with homogenous tissue-like optical properties were extracted, with and without profilometry correction, after vertical translation and tilting of the phantoms at various angles. Objects having a complex shape, including a hemispheric silicone phantom and human fingers, were acquired and similarly processed, with vascular constriction of a finger being readily detectable through changes in its optical properties. Using profilometry correction, the accuracy of extracted absorption and reduced scattering coefficients improved from 2- to 10-fold for surfaces having height variations as much as 3 cm and tilt angles as high as 40°. These data lay the foundation for employing structured light for quantitative imaging during surgery.
Keywords: Spatially-modulated light, patterned illumination, modulated imaging, profilometry, optical properties, Lambertian reflectance, in vivo imaging
INTRODUCTION
Over the past decade, significant progress has been made in the development of non-contact wide-field technologies for quantitative, sub-surface functional imaging. For example, fluorescence imaging can now provide surgeons with real-time guidance during surgical procedures (1–5), and has successfully been translated to human trials for breast-cancer sentinel lymph-node mapping [(6), Troyan et al., manuscript in review]. Frequency-domain photon migration (FDPM) and fluorescence lifetime imaging (FLIM) have been applied to large fields-of-view (FOV; typically greater than 5 cm) (7–9) for normal versus tumor cell delineation through natural chromophore contrast (10,11), or for improved exogenous and endogenous fluorescence signal detection through lifetime contrast (12–14). Recently, spatially-modulated light (a.k.a., patterned illumination, structured illumination, modulated imaging; henceforth referred to as MI) has been shown to provide depth-resolved maps of optical properties (15) and biochemical components, such as oxyhemoglobin and deoxyhemoglobin, in turbid media (16,17).
Translating such technologies into clinically relevant tools, though, is a significant challenge, particularly when quantitation is required. Most of these technologies require multiple images to be acquired with a varying parameter (e.g., time or spatial intensity, wavelength), and images must be registered to the same position in space over the period of data acquisition. Consequently, problems arise when dealing with samples that have different surface-profiles, or varying surface-profiles over time (i.e., motion). Image acquisition gating and synchronization using physiological signals (such as an electrocardiogram) can be employed to overcome image motion over time in the context of in vivo optical imaging (18). However, image gating does not correct for surface height variations when they are independent of time. This is the case, for example, with calibrated intensity measurements when the calibration and the sample have different surface profiles. Previous studies have utilized sample surface profile information to correct for color rendering (19), to optimize venous imaging (20), or to simulate the diffuse reflectance of biological tissues (21), but none so far use this information for quantitative optical imaging.
In this study, we demonstrate that phase profilometry can be incorporated into an MI imaging system in such a way that quantitative, wide-field optical imaging of tissue absorption (µa) and reduced scattering (µs’) coefficient is possible. By generating an accurate surface map of an object, phase profilometry permits the correction of surface reflectance intensity variations that occur as a consequence of sample geometrical parameters, such as height and surface contour (i.e., variation in angle with respect to collection plane). This, in turn, improves the extraction of optical properties from random-shaped objects over large FOVs.
MATERIALS AND METHODS
Instrumentation
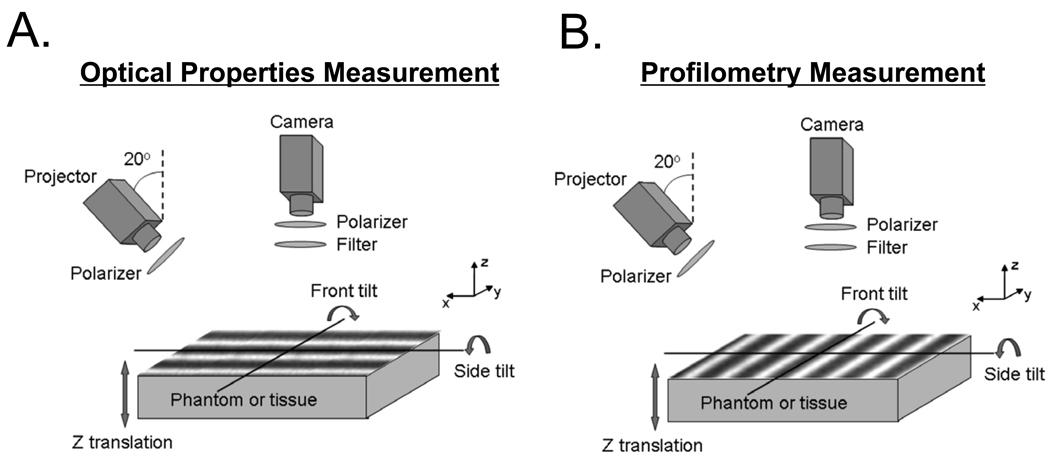
We used the MI instrument platform first developed by Cuccia et al. (15–17,22,23), as shown in Figure 1A. The system consists of an intensity-stabilized 250 W quartz-tungsten-halogen (QTH) lamp (Newport, Irvine, CA) focused on a spatial light modulator (DMD Discovery 1100, Vialux, Chemnitz, Sachsen, Germany), which is then projected through an objective lens (Thorlabs, Newton, NJ) whose magnification and focal length ensure complete illumination of the target by spatially modulated light. A Nuance multi-spectral imaging system (CRI Inc., Woburn, MA), composed of a liquid crystal tunable filter (λ = 650–1100 nm, Δλ = 10 nm) and a 12-bit CCD camera, was used to acquire reflected images. Projection and collection are cross-polarized to reduce the contribution of specularly reflected light, and to isolate diffuse reflectance (24). We placed the samples on a custom-made, z-translation, × and y-rotation stage that allows positioning at a range of heights from 0 to 5 cm and tilt angles from −40° to +40°. MI data acquisition was performed using code written in LabVIEW (National Instruments, Austin, TX), and image processing was performed using code written in MATLAB (MathWorks, Natick, MA).
Figure 1. Instrumentation Schematics.
Intensity sine waves (grayscale stripes) are projected at a 20°angle onto a sample using a spatial light modulator, and collected with a 12-bit CCD camera. Collection is cross-polarized with respect to projection, and wavelengths are filtered using the tunable filter on the camera. Orientation of the sine waves is shown for optical properties measurement (A) and profilometry measurement (B).
Tissue-Like Phantoms
Tissue-simulating phantoms with known optical properties were used to assess the qualitative and quantitative performance of the imaging technique. These phantoms, 96 mm × 96 mm × 10 mm, are made of polydimethylsiloxane (PDMS) and incorporate homogeneously distributed India ink as an absorber, and TiO2 as a scattering agent (25). Spectral absorption and reduced scattering coefficients of the calibration phantom were verified using a two-distance, multi-frequency, frequency-domain photon migration (FDPM) measurement, which is a self-calibrating measurement (26).
Phase Profilometry
Phase profilometry is a well known measurement technique that is used for surface profile characterization (27–29). As shown in Figure 1B, a spatially-modulated intensity sine wave is projected onto the sample while the camera acquires at a fixed angle with respect to the projection axis. Maximum sensitivity to surface variations is obtained when the fringes of the intensity sine wave are orthogonal to the plane formed by the camera and projector optical axes. In Figure 1B, the optical axes of the camera and projector are lying within the x–z plane while the fringes are aligned along the y vector. The observed fringe phase will then be dependent upon the geometry of the optical system and the sample surface height. Consequently, the sample height can be extracted from measurement of the fringes’ phase and either knowledge of the optical system geometry or calibration of the phase-height relationship. We chose to extract the fringes’ phase using a profilometry method that consists of projecting an intensity sine wave with three different phase shifts (29). The fringe phase at each pixel is extracted from the three sine waves and unwrapped. Another alternative would be to perform a discrete Fourier transform (DFT) using a single intensity sine wave (28), but in our case, the trade-off between phase resolution and spatial resolution renders the DFT approach inadequate. As the optical system geometry may vary in time, we chose to perform a multiple-height calibration scheme that allows the extraction of a linear relationship between the inverse of sample height variation and the inverse of phase variation (30). This technique consists of vertically translating a horizontal flat surface, and acquiring, for known heights, the phase at each pixel location.
It is important to note that the choice of spatial frequency used when performing phase profilometry is a tradeoff between sensitivity to large changes of height, which is highest at low spatial frequencies, and height resolution, which is highest at high spatial frequencies. When measuring relatively smooth surfaces that do not present sudden height changes, such as flat or hemispheric surfaces, we performed phase unwrapping, i.e., phase was no longer constrained to 0° to 180°. This permitted use of relatively high frequencies (higher than 0.1 mm−1) to minimize phase noise, while maintaining sensitivity to large height changes. Of course, this approach assumes that the phase does not vary by more than 180° from one pixel to another, which is the case for smooth surfaces.
Modulated Imaging (MI)
The spatial dependence of light reflectance from turbid media has been characterized extensively (31). Two general approaches can be used to quantify turbid media optical properties using continuous, i.e., time-independent, light sources. The first “real domain” method measures the spatial point-spread function of a point source incident on the sample and is generally well-suited for local, millimeter-scale interrogation using contact fiber probes (24,32). This approach can be extended to non-contact geometries and large areas by raster scanning the point illumination source across the region of interest. In the “spatial-frequency domain,” the reflectance modulation transfer function of the sample is evaluated in a wide-field imaging geometry (33). Modulated Imaging (MI), developed by Cuccia et al. (15–17,22,23), is a spatial-frequency domain technique that relies on the analysis of reflectance from a spatially-modulated sinusoidal light source. Because the analysis is performed within the spatial frequency domain, fast acquisition of large FOVs (typically 5 cm or greater) is possible. Modulated imaging is a calibration-dependent, model-based method that allows the extraction of absorption and reduced scattering coefficients (µa and µs’; i.e., optical properties) from a turbid medium at any wavelength.
The theory and methods of MI are described extensively by Cuccia et al. (16,17). To place the present study in context, we provide the following brief overview of the method and its fundamental principles. The AC component, IAC, of an intensity sine wave of spatial frequency fx and phase α, measured at a single wavelength and at the location (x,y) on the sample has the following form:
| [Eq. 1] |
The modulation amplitude, MAC, can be extracted by varying the phase α of the intensity sine wave, taking, in our case, three values: α1 = 0, α2 = 2π/3 and α3 = 4π/3. At each location (x,y):
| [Eq. 2] |
Finally the modulation amplitude, MAC, can be related to the source intensity, I0, the modulation transfer function of the optical system, MTFsys, and the diffuse reflectance of the sample, Rd, at each location (x,y):
| [Eq. 3] |
As shown by Cuccia et al. (16,17), the instrument-dependent contributions to the measured modulation amplitude (MAC), namely the frequency response (MTFsys) of the collection optics and the incident intensity (I0) at each location (x,y), need to be separated from the contribution of the light-tissue interaction, i.e., the diffuse reflectance of the sample (Rd).
During a typical measurement, the modulation amplitude (MAC,ref) of a calibration phantom with known optical properties is measured at multiple illumination spatial frequencies (fx), and the calibration phantom diffuse reflectance (Rd,ref) is predicted from the known optical properties using a forward light propagation model [which is analytical when using the diffusion approximation to the transport equation (17,34) or statistical when using Monte-Carlo computations (35)]. Next, the MAC of the unknown sample is measured and its diffuse reflectance extracted using the reference values (MAC,ref and Rd,ref) from the calibration phantom, at each location (x,y):
| [Eq. 4] |
As shown in Equation 4, instrument-dependent contributions (product of I0 and MTFsys) can be removed from the frequency-domain tissue data with a simple division. Finally as the sample diffuse reflectances, Rd(fx), are directly dependent upon the sample optical properties (µa, µs’), diffuse reflectances acquired at two or more spatial frequencies are used to fit for optical properties by solving the inverse problem using a light propagation model at each location (x,y) [described in detail in (16,17)].
Cuccia et al. (16,17) showed that by properly choosing the spatial frequencies, optical properties can be extracted using a quick, 2-dimensional lookup table generated from either “white” Monte-Carlo simulations or the diffusion approximation, and calibrated using a phantom with well-known optical properties. The premise of that technique is that DC, continuous wave illumination, is sensitive to both absorption and scattering whereas a certain range of higher spatial frequencies (typically greater than 0.1 mm−1 in the case of tissues) is primarily sensitive to scattering. This permits separation of the optical properties, i.e., absorption and reduced scattering, of an object. In the work presented here, we used the diffusion approximation to the transport equation as our forward light propagation model and optical properties were extracted using the rapid 2-dimensional lookup table generated from the diffusion approximation to the transport equation. During our experiments, the desired high spatial frequency for optical properties measurement using the 2-dimensional lookup table was in the range of 0.1 mm−1 to 0.2 mm−1. Because accurate knowledge of this spatial frequency is necessary for the light propagation model, a post-acquisition calibration of the exact high frequency value is measured using a ruler.
As shown in Figure 1A, when measuring optical properties of phantoms, we purposely chose to project fringes that were not sensitive to the sample surface variations. This was simply achieved by orienting the fringes parallel to the plane formed by the camera-projector optical axes (see Phase Profilometry section). Typically, MI is performed by first acquiring data from a single reference calibration phantom with well-known optical properties at a single specific height. Problems arise when the reference and the sample are not at the same height, which occurs commonly during in vivo measurements. In this case, the sample and the reference do not share the same incident light intensities (I0 in equation 3), and direct comparison of modulation amplitudes is no longer appropriate for accurate diffuse reflectance extraction and subsequent optical properties determination. The previous MI measurement protocol, without profile intensity correction, requires that the sample and reference heights be as close as possible to minimize errors.
Additionally, we developed a new, multiple spatial frequency processing algorithm for MI. The commonly employed algorithm assumes that there is only one single spatial frequency of interaction between the light and the sample. Due to surface profile variations, though, this intensity sine wave gets projected onto locally angled surfaces and multiple frequencies of interaction are present. We overcame this problem by measuring the calibration phantom at multiple single frequencies, extracting the sample optical properties for all those frequencies, and interpolating the sample optical properties according to the measured local spatial frequency (obtained using the surface profile data).
Profile-Based Correction Method
Because light intensity locally re-emitted from a diffusive surface can be described using a Lambertian model varying in cos(θ)/r2, where r is the distance from the sample to the camera and θ the angle between the normal of the surface and the collection optical axis, we developed a surface profile correction method that consists of these two correction components. The first part addresses the intensity variation associated with surface height changes while the second part addresses the intensity variation due to surface angle. These corrections were applied to MI data. In order to validate this approach, we first assessed its performance in correcting height-dependent intensity variations only. This was made possible by vertically translating a horizontal flat tissue-simulating phantom perpendicular to the collection optical axis. In doing so, there were no angle-dependent contributions to the sample intensity variation. With the knowledge that the height-dependent intensity variations were corrected, we then tilted a flat tissue-simulating phantom, from −40° to +40° in both axes of rotation and studied the combination of both height-dependent and angle-dependent corrections, since when the sample is angled, contributions from height and angle cannot be studied independently.
Height-dependent intensity correction
There are two possible approaches to correct for the effect of height variations in measured intensity: 1) model-based correction or 2) calibration-based correction. Although the measured sample intensity followed the inverse square law model, which is valid for Lambertian reflectance, we chose to implement a more convenient approach, based on calibration, which can be easily adapted to different system geometries. The phase profilometry calibration method uses flat phantoms acquired at various heights. For each calibrated height we performed a profilometry measurement and an optical property measurement (as described above). The profilometry measurement yielded phase variation versus height variation for each pixel in the image while the optical property measurement provided the intensity variation versus height variation for each pixel in the image. We decided to calibrate the reference amplitude modulation, MAC,ref, directly proportional to the reference intensity. The formula used for computing MAC is shown in Equation 2. We subsequently extracted a matrix describing the modulation amplitude of the reference phantom versus height for each pixel in the image, a quantity that is directly proportional to the reference intensity versus height. At each location (x,y), the modulation amplitude of the reference phantom, MAC,ref, can be described as a function the profilometry phase of the reference phantom, Phaseref, acquired at n discrete heights:
| [Eq. 5] |
After performing this calibration, the sample surface profile is acquired and the profile-corrected reference modulation amplitude is obtained by interpolating the sample profilometry phase, pixel by pixel, using equation 5. For each location (x,y):
| [Eq. 6] |
Finally the diffuse reflectance of the sample is extracted using the height-corrected reference modulation amplitude in equation 4:
| [Eq. 7] |
To assess this correction performance, we acquired data from two tissue-like phantoms with homogeneous optical properties. One phantom was used for calibration purposes, and the other was treated as an unknown sample. In both cases, data were acquired every 1 cm from 0 to 3 cm, while keeping the phantoms horizontal. The spatial frequency used for profilometry was 0.1 mm−1 and frequencies used for optical property measurements were DC (0 mm−1) and 0.2 mm−1. The FOV was 3 cm × 4 cm. Data were acquired at 650 nm, processed with and without height correction, and compared to expected theoretical values.
Angle-dependent intensity correction
There are also two possible approaches for correcting reference intensity dependence with surface angle: 1) model-based correction or 2) calibration-based correction. Since calibrations acquired on flat horizontal phantoms (i.e., with no surface angle variations) integrate flawlessly into the method workflow, we chose to employ a model-based Lambertian reflectance approach. From the profile acquired using phase profilometry, we extracted the surface normal vectors and computed the cosine of the angle θ between these vectors and the optical axis of the camera. The cosine gave a correction factor that we applied to the height-corrected reference modulation amplitude to obtain the fully profile-corrected reference modulation amplitude for each pixel location (x,y):
| [Eq. 8] |
We implemented both a collimated collection approach and a divergent collection approach. The collimated collection approach assumes that the optical axis of collection is independent of the position on the sample, and the divergent collection approach assumes it is dependent. We noticed very little difference (less than 1%) in the correction factors when implementing the two approaches due to the low angle of divergence of our system (1.8°). We thus chose the less computationally-intensive, collimated collection approach.
To assess the performance of this method of correction, we acquired data from two, flat tissue-like phantoms with homogeneous optical properties. One phantom was used for calibration purposes, measured horizontally every cm, from 0 to 3 cm. The other phantom was treated as an unknown sample and measured at various angles from −40° to +40° in both axes of rotation (side and front tilts, see Figure 1). The spatial frequency used for profilometry was 0.1 mm−1 and spatial frequencies used for optical properties were DC (0 mm−1) and 0.2 mm−1. FOV was 3 cm × 4 cm. Data were acquired at 650 nm, and the sample surface smoothed using a Wiener filter (10 × 10 pixel window size) to reduce the influence of surface angle errors originating from noise in the profilometry data. Data were processed with and without height and angle corrections, and compared to expected theoretical values.
In Vitro Hemispheric Phantom Measurements
In addition to flat phantoms, we acquired data from a complex-shaped phantom that consisted of a flat homogenous phantom having on its surface a 2 cm radius hemisphere of the same optical properties. One flat phantom with known optical properties was measured at five different heights, from 0 cm to 4 cm, every cm, for calibration purposes. The sample phantom data was measured at a height of 1 cm. Both sets of phantom data were processed for phase profilometry and optical properties as described above. The spatial frequency used for profilometry was 0.17 mm−1 and spatial frequencies used for optical property determination were DC (0 mm−1) and 0.12 mm−1. FOV was 4 cm × 5 cm. Data were acquired at 670 nm, and processed for height and optical property reconstructions, with and without profilometry correction (for height and angle). The first phantom served as the calibration reference for both height and optical properties.
In Vivo Measurements
We acquired data from a human right hand, with the index finger having a rubber band-induced constriction of blood flow. One flat phantom with known optical properties was measured at 6 different heights, from 0 cm to 5 cm, every cm, for calibration purposes. The spatial frequency used for profilometry was 0.08 mm−1 and spatial frequencies used for optical properties were DC (0 mm−1) and 0.13 mm−1. FOV was 7 cm × 9 cm. Data were acquired at 670 nm, and the sample surface smoothed using a Wiener filter (10 × 10 pixel window size) to reduce the influence of surface angle errors originating from noise in the profilometry data. Data were processed for height and optical property extractions, with and without profilometry correction (for height and angle), and using the flat phantom as the calibration reference. Finally, optical property maps were smoothed using a Gaussian filter having a full width at half maximum (FWHM) of 4 pixels.
RESULTS
Phase Profilometry
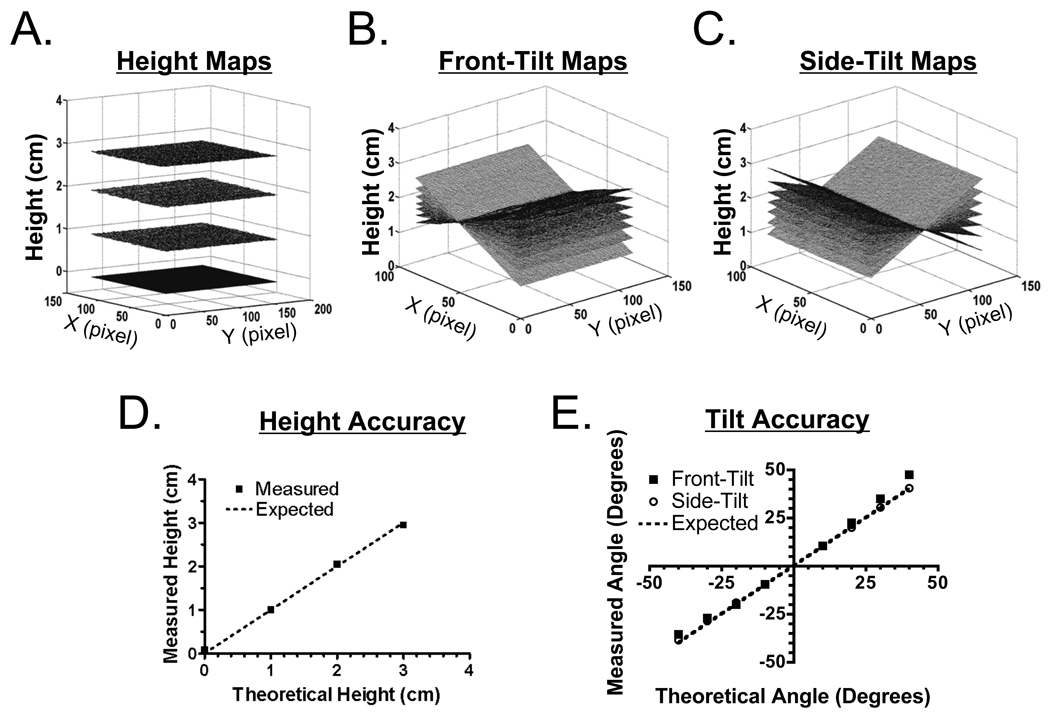
A flat phantom with homogenous, tissue-like optical properties was translated vertically (Figure 2A), front-tilted (Figure 2B) and side-tilted (Figure 2C), and its surface reconstructed. Over 3 cm of vertical translation, measured height was always reconstructed within 1 mm or less of its theoretical height (Figure 2D). Over ±20° of side-tilt or front-tilt, the surface of the phantom was reconstructed within 0.7° or less of its theoretical angle (Figure 2E). However, for front-tilt angles from ±20° to ±40°, there was proportionally increasing deviation due to systematic errors associated with phase extraction (Figure 2E). For front-tilts, the phase of the sine wave is the result of a phase addition process along the x vector, causing errors to accumulate during phase extraction. This does not occur during side-tilts, where phase is constant along the x vector.
Figure 2. Profilometry Measurements.
A. Surface maps of flat phantoms translated vertically.
B. Surface maps of flat phantoms rotated along the y axis, i.e., front-tilt.
C. Surface maps of flat phantoms rotated along the × axis, i.e., side-tilt.
D. Measured surface heights (squares) as a function of the expected theoretical surface heights (dashed line).
E. Measured surface angles for front-tilt (squares) and side-tilt (circles) as a function of the expected theoretical angles (dashed line).
Optical Property Measurements of Flat Tissue-like Phantoms
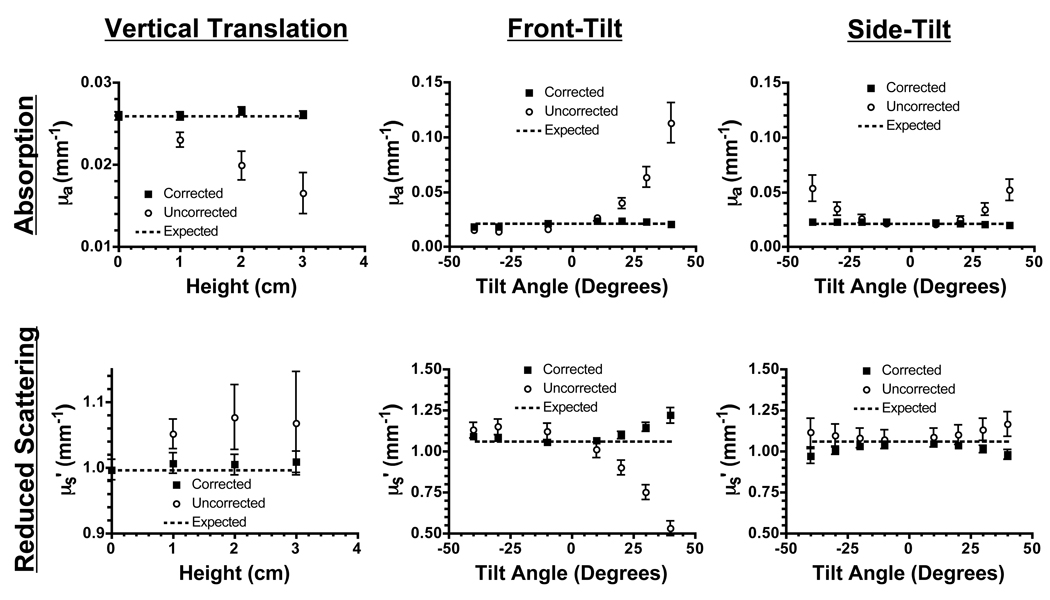
Extraction of absorption and reduced scattering coefficients was impacted significantly by profilometry correction on a flat phantom with homogenous, tissue-like optical properties (Figure 3). As described in Materials and Methods, results from uncorrected data were processed using a calibration phantom measured at a single 0 cm reference height and 0° in both axes of rotation. Results from corrected data have been processed using a calibration phantom measured at various heights and 0° in both axes of rotation.
Figure 3. Optical Property Measurements of Vertically Translated Tissue-Like Phantoms.
Recovered absorption coefficients (top; mean ± standard deviation) and reduced scattering coefficients (bottom; mean ± standard deviation) at 650 nm of vertically translated phantoms (left), front-tilted phantoms (center), side-tilted phantoms (right) having homogeneous optical properties. Profilometry-corrected data (squares) and uncorrected data (circles) are shown along with the expected theoretical values (dashed lines).
For vertical translation (Figure 3, left), the correction algorithm uses only height dependent intensity correction. Profilometry-based correction reduced absorption coefficient error from 10% per cm to less than 1% over the entire range from 0 to 3 cm. Similarly, reduced scattering coefficient error was reduced from ≈10% to less than 1% at every surface height. For both absorption and reduced scattering coefficients, the standard deviation of all pixels in an image was reduced from ≥ 7% to ≤ 3% of the mean pixel value.
For tilted phantoms (Figure 3, middle and right), the correction algorithm uses a combination of height- and angle-dependent intensity correction. For angles within ±40°, the correction reduced absorption coefficient error from 86% to 7% of the expected pixel value, and reduced scattering coefficient error from 10% to 4% of the expected pixel value. For absorption coefficients, the standard deviation of all pixels in an image was reduced from 13% to 6% of the mean pixel value, while for reduced scattering coefficients, standard deviation was reduced from 6% to 2% of the mean pixel value. It should be noted that the camera optical axis was not normal to the 0° horizontal phantom surface, but was angularly displaced (−20° front, 0° side). Consequently measured values found their local extrema at this angle (see for example Figure 3, Front-Tilt). We also note a tendency for over-correction of tilted phantoms on the reduced-scattering maps (see Discussion).
Optical Property Measurements of Hemispheric Tissue-like Phantoms
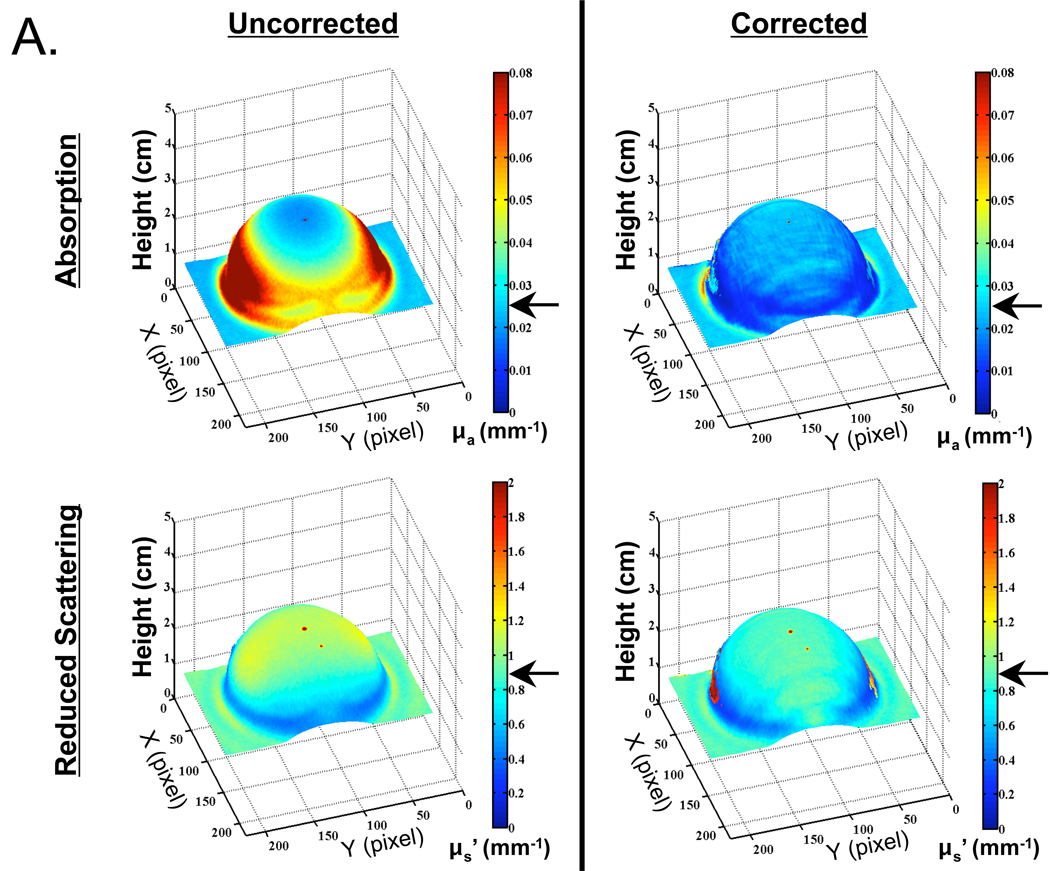
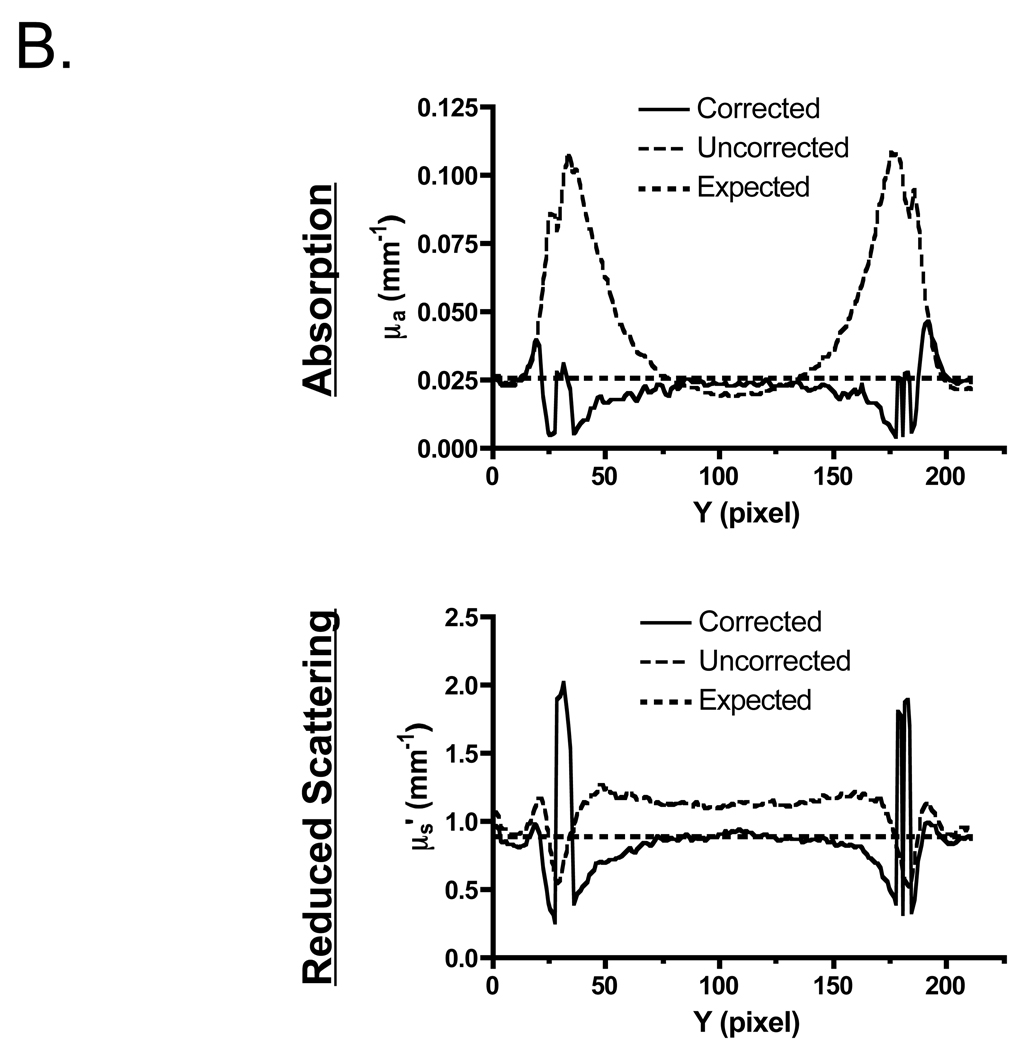
Although appearing to work well with flat surfaces, we next explored the use of profilometry-based correction on complex surfaces. Shown in Figure 4 is a hemispheric phantom having homogeneous, tissue-like optical properties. Figure 4A shows optical properties maps (absorption and reduced scattered coefficients at 670 nm) plotted on the sample surface, with and without correction. Figure 4B shows cross-sectional plots from Figure 4A made through the center of the hemisphere. Profilometry-corrected data (solid curve) and uncorrected data (thin dashed curve) are shown along with the expected theoretical values (thick dashed curves). In the absence of profilometry-based correction, reconstruction of absorption and reduced scattering coefficients results in large errors (28% of the pixels on average are within 10% of their expected values). These errors are most significant at points presenting a high surface angle, with deviations greater than 100% at angles larger than 40° for absorption coefficients. However, when corrected for surface height and angle, the accuracy of optical property measurements is improved both qualitatively (Figure 4A) and quantitatively [50% of the pixels on average are within 10% of their expected values (Figure 4B)].
Figure 4. Optical Property Measurements of a Hemispheric, Tissue-Like Phantom having Homogeneous Optical Properties.
A. Recovered absorption coefficients (top) and reduced scattering coefficients (bottom) at 670 nm either without (left), or with (right), profilometry-based correction for height and angle. Arrows indicate the expected theoretical value.
B. Cross-sectional plots from (A), through the center of the hemisphere, of recovered absorption coefficients (top) and reduced scattering coefficients (bottom) at 670 nm. Profilometry-corrected data (solid curve) and uncorrected data (thin dashed curve) are shown along with the expected theoretical values (thick dashed curves).
When reconstructing only those pixels that fall within the range of the calibration phantom (0 cm to 3 cm in vertical translation and ±40° in front-tilt and side-tilt), deviation of the recovered absorption coefficient from the expected value was reduced from 65% to 9% with profilometry-based correction. Deviation of the recovered reduced-scattering coefficient from the expected value was actually slightly degraded after correction, increasing from 1.5% to 3% over the entire hemispheric surface. There was also a trend towards over-correction with increasing surface angle (Figure 4B). The standard deviation of measurements at any given pixel was reduced from 51% to 25% of the mean pixel value for absorption coefficient, and from 20% to 7% of the mean pixel value for reduced scattering coefficient, with the incorporation of surface height maps.
When the entire hemispheric surface is analyzed, without restricting reconstruction to ±40° (Figure 4B), absorption maps are still improved by a similar factor but corrected reduced scattering results are slightly degraded, increasing to 8.4% average deviation from expected and showing no improvement in standard deviation over the uncorrected case. This is thought to be due to very steep angles at the junction of the sphere and the flat phantom, resulting in both insensitivity to optical properties and inappropriate Lambertian reflectance correction (see Discussion).
Note is made of a tiny dark spot at the top center of the hemisphere, seen in both the absorption and reduced scattering coefficient maps (Figure 4A), which is caused by excessive specular reflection. A second tiny dark spot in the reduced scattering coefficient maps is due to a small speck of non-dissolved TiO2, visible to the naked eye, which arose during the phantom-making process. Note is also made of an area at the back of the hemisphere where the profile cannot be reconstructed due the low intensity of the illumination. This phenomenon is typical when performing phase profilometry using single-angled illumination (36). We also note a tendency for over-correction of both scattering and absorption maps, increasing with surface angle (see Discussion).
In Vivo Optical Property Measurements
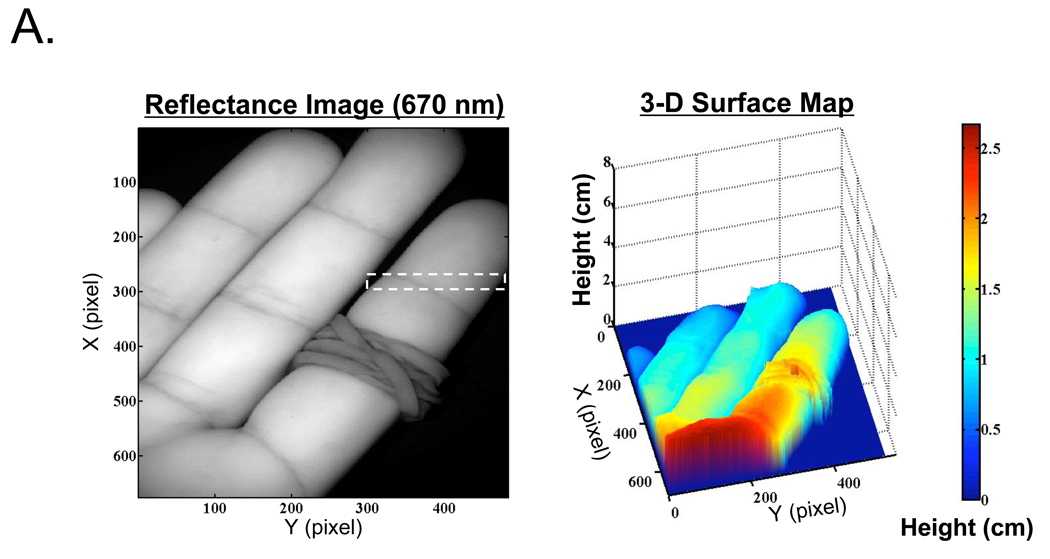
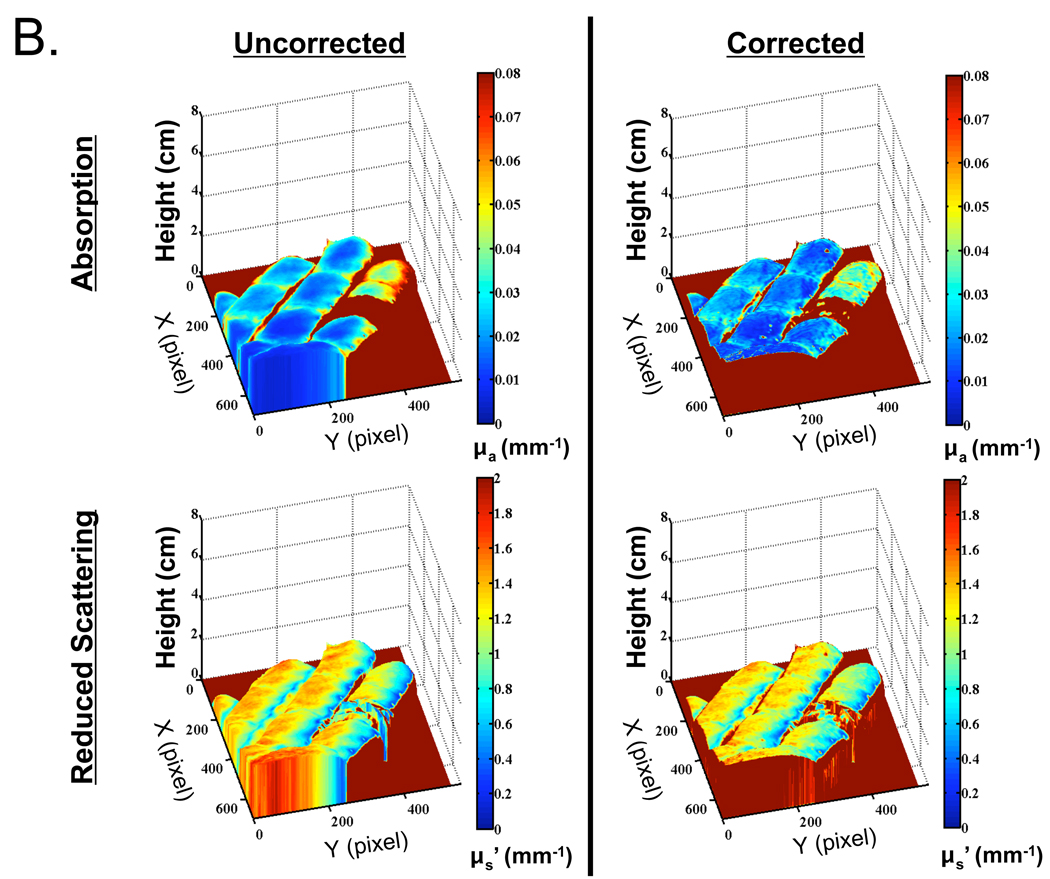
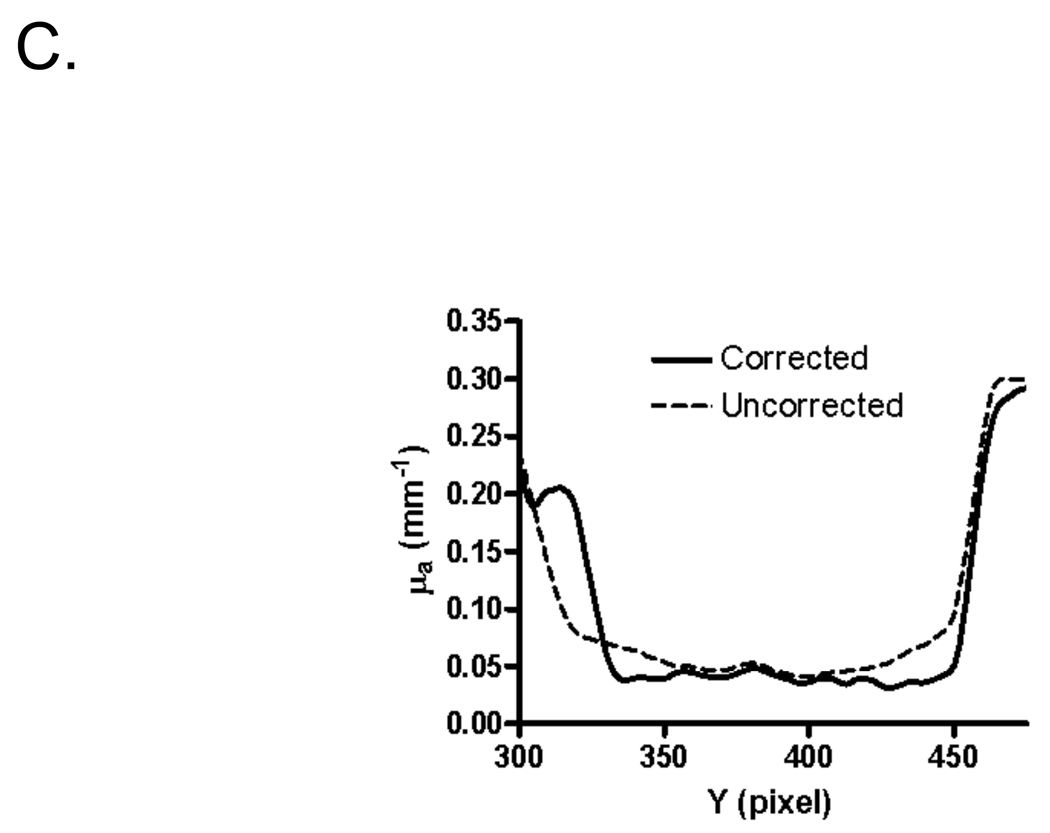
The optical properties of an even more complex object, a human hand with the index finger constricted with a rubber band, were reconstructed with and without phase profilometry-based correction. A reflectance image of the hand and its surface map is shown in Figure 5A. Recovered absorption and reduced scattering coefficients, with and without surface map correction, are shown in Figure 5B. Consistent with in vitro results, the standard deviation of measurements made on the constricted finger section was reduced from 44% to 30% of the mean pixel value for absorption coefficient, and from 29% to 23% of the mean pixel value for reduced scattering coefficient. Artifacts due to movement of the hand during data acquisition were visible, especially in scattering maps (see Discussion). Additionally, noise originating from phase profilometry acquired at low spatial frequency is clearly visible and degrades the results obtained from angle-dependent correction (see Discussion). Most important, profilometry-based correction greatly improved the uniformity of in vivo optical property measurements, as shown in the cross-sectional plot, along the y-axis of the constricted finger, of the absorption data (Figure 5C).
Figure 5. In Vivo Imaging of a Human Hand.
A. Reflectance image of a right hand having an index finger constriction (rubber band), taken at 670 nm (left), and the 3-D plot of the hand obtained using phase profilometry (right). Dashed box indicates the region-of-interest for cross-sectional quantitative analysis.
B. Recovered absorption coefficients (top) and reduced scattering coefficients (bottom) at 670 nm either without (left), or with (right), profilometry-based correction for height and angle. Note increased absorption at 670 nm on the constricted finger due to an increase in deoxyhemoglobin and total hemoglobin.
C. Cross-section along the Y-axis through the constricted finger (X = average of pixels 275 to 300; see dashed box in Figure 5A) of the hand shown in Figure 5B. Corrected (solid curve) and uncorrected (dashed curve) absorption coefficients are plotted.
DISCUSSION
In this study, we present a technique for improving the reconstruction of optical properties from objects having complex surface geometries. By exploiting patterned illumination for both phase profilometry and optical properties measurements, we were able to achieve large FOV imaging, fast data acquisition, and rapid reconstruction, all with the same instrument. The results are applicable to image-guided surgery, where there is currently no quantitative optical imaging technique used routinely. One application of particular interest is the monitoring of tissue oxygenation status. One could envision extracting optical properties at several wavelengths in order to quantify oxyhemoglobin and deoxyhemoglobin concentration using a modified Beer’s law. This particular application would provide surgeons with the ability to interrogate tissue oxygenation in near real-time.
As briefly stated in the Introduction, co-registration of the acquired images is key in adapting quantitative techniques to relevant in vivo situations. The two major contributors to co-registration problems are time-related and space-related. Time-related contributions can be further sub-divided into voluntary motions, cyclic involuntary motions due to normal physiological activity (such as heartbeat and respiration), and non-cyclic involuntary motions (due to fatigue, for example). Image acquisition gating, as described previously, can help overcome cyclic involuntary motions (18). Large voluntary and involuntary motions can be overcome using motion sensors for preventing acquisition during motion. The present study addresses space-related co-registration, independent of time, and can be coupled with image acquisition gating in the future for overcoming both time- and space-related co-registration problems.
In all cases, though, both the number of required images and camera integration time need to be minimized in order to reduce the influence of time-related motions. Our current system, not optimized for fast data acquisition, caused small artifacts due to hand motion. These movements are particularly pronounced in the reduced scattering coefficient maps (Figure 5B), due precisely to the increased AC sensitivity to motion compared to the DC, continuous wave measurements. One of the major potential advantages of the profilometry-based technique we describe is the speed of data acquisition. After initial calibration, only three additional images (i.e., three phases at a single spatial frequency) are required, which depending on fluence rate, camera sensitivity, and camera frame rate, would add only hundreds of milliseconds to data acquisition. Using a multiple cameras imaging system [(37), Troyan et al., manuscript in review], it should be possible to perform profilometry and optical properties measurements simultaneously, at two different wavelengths, which in turn would improve co-registration even further. Although technically challenging, one might also consider profile-sensitive orientation of the patterned illumination during optical properties measurements, which might reduce acquisition time by half.
However, our technique is not without limitations and room for improvement. We limited calibration and reconstruction to surface height variations of 0 to 3 cm, and tilt angles from ±40°. Indeed, at more extreme angles, the spatial frequency of the projected fringes would decrease dramatically, thus preventing separation of absorption and reduced scattering coefficients during image reconstruction. This is due to the fact that good separation of the DC and AC measurements is necessary, and the AC frequency is typically higher than 0.1 mm−1 for recovery of optical properties. We also noted a tendency for over-correction in reduced scattering and/or absorption coefficients. The origin of this tendency is not yet clear and is presently attributed to many factors. For the angle-dependent correction method, we used a simple cosine to express its Lambertian nature. Other type of dependencies have been reported in the literature (38), and errors are generated if the model used is not accurate. The spatial frequency broadening due to the projection of a sine wave on an angled surface, while accounted for in our processing by interpolating optical properties as a function of the local spatial frequency, could be more accurately corrected if included directly in the model.
Furthermore, the major source of error in the correction technique we have developed lies in the quality of the phase profilometry data. Small errors in reconstructing surface heights from phase profilometry lead to large angle variations around the true angle value. This was particularly significant in the implementation of the Lambertian reflectance correction. The magnitude of this effect increases dramatically with the magnitude of the true angle value due to the cosine nature of Lambertian reflectance. This results in increased standard deviation in both absorption and reduced scattering coefficients, as seen with the in vivo hand data (Figures 5B and 5C). Several possible solutions to this problem exist. First, phase profilometry acquisition could be improved by including additional higher spatial frequencies, which would increase sensitivity to small height changes and reduce random variations of measured surface heights. Second, one could employ a commercially available profilometry analysis package (e.g., from Breuckmann, 3D Digital Corporation, Steinbichler, InSpeck) to acquire the object surface, although these packages tend to be expensive and difficult to integrate into custom instrumentation. Finally, one could perform either time or spatial filtering to reduce noise in the data, although filtering can result in longer acquisition times and/or reduced image quality.
CONCLUSION
We have designed and validated a new technique for correcting surface height and surface angle variations for wide-field intensity-based optical imaging. Our approach is based upon surface profile acquisition, calibration of the light source intensity with height, and a Lambertian reflectance model-based correction. We have applied this method to spatial frequency-domain optical imaging based on structured illumination, and evaluated performance at various sample heights and angles. By implementing the correction, optical property calculations of phantoms are dramatically improved in both accuracy and standard deviation. Finally, we successfully applied this technique to complex-shaped turbid media such as a hemispheric phantom with homogeneous optical properties and a human hand. These studies provide a practical framework for non-contact quantitative imaging of optical and physiological properties in humans and small animals, where spatially varying surface topographies are commonly encountered.
ACKNOWLEDGMENTS
We thank Valerie Croft, Midge Garisson, Lori Moffitt, and Eugenia Trabucchi for administrative assistance and Barbara L. Clough for editing. We thank the following individuals for their contributions to this project: from Boston University, MA, Irving Bigio and Jerome Mertz; from Politecnico di Milano, Italy, Andrea Bassi; and from the Beckman Laser Institute, University of California at Irvine, CA, Jae Kim, Fred Ayers and Jessie Weber. This study was funded by National Institutes of Health/NCI grant #R21-CA-129758. Additional support has been provided by National Institutes of Health/NCRR under grant P41-RR01192 (Laser Microbeam and Medical Program: LAMMP), U.S. Air Force Office of Scientific Research, Medical Free-Electron Laser Program (F49620-00-2-0371 and FA9550-04-1-0101), and the Beckman Foundation.
REFERENCES
- 1.Sevick-Muraca EM, Houston JP, Gurfinkel M. Fluorescence-enhanced, near infrared diagnostic imaging with contrast agents. Curr Opin Chem Biol. 2002;6:642–650. doi: 10.1016/s1367-5931(02)00356-3. [DOI] [PubMed] [Google Scholar]
- 2.Lenkinski RE, Ahmed M, Zaheer A, Frangioni JV, Goldberg SN. Near-infrared fluorescence imaging of microcalcification in an animal model of breast cancer. Acad Radiol. 2003;10:1159–1164. doi: 10.1016/s1076-6332(03)00253-8. [DOI] [PubMed] [Google Scholar]
- 3.Tanaka E, Choi HS, Fujii H, Bawendi MG, Frangioni JV. Image-guided oncologic surgery using invisible light: completed pre-clinical development for sentinel lymph node mapping. Ann Surg Oncol. 2006;13:1671–1681. doi: 10.1245/s10434-006-9194-6. [DOI] [PMC free article] [PubMed] [Google Scholar]
- 4.Flaumenhaft R, Tanaka E, Graham GJ, De Grand AM, Laurence RG, Hoshino K, Hajjar RJ, Frangioni JV. Localization and quantification of platelet-rich thrombi in large blood vessels with near-infrared fluorescence imaging. Circulation. 2007;115:84–93. doi: 10.1161/CIRCULATIONAHA.106.643908. [DOI] [PMC free article] [PubMed] [Google Scholar]
- 5.Sharma R, Wang W, Rasmussen JC, Joshi A, Houston JP, Adams KE, Cameron A, Ke S, Kwon S, Mawad ME, Sevick-Muraca EM. Quantitative imaging of lymph function. Am J Physiol Heart Circ Physiol. 2007;292:H3109–H3118. doi: 10.1152/ajpheart.01223.2006. [DOI] [PubMed] [Google Scholar]
- 6.Frangioni JV. Translating in vivo diagnostics into clinical reality. Nat Biotechnol. 2006;24:909–913. doi: 10.1038/nbt0806-909. [DOI] [PubMed] [Google Scholar]
- 7.Lakowicz JR, Berndt KW. Lifetime-selective fluorescence imaging using an rf phase-sensitive camera. Rev. Sci. Instrum. 1991;62:1727–1734. [Google Scholar]
- 8.O'Leary MA, Boas DA, Li XD, Chance B, Yodh AG. Fluorescence lifetime imaging in turbid media. Opt Lett. 1996;21 doi: 10.1364/ol.21.000158. [DOI] [PubMed] [Google Scholar]
- 9.Reynolds JS, Troy TL, Mayer RH, Thompson AB, Waters DJ, Cornell KK, Snyder PW, Sevick-Muraca EM. Imaging of spontaneous canine mammary tumors using fluorescent contrast agents. Photochem Photobiol. 1999;70:87–94. [PubMed] [Google Scholar]
- 10.Fishkin JB, Coquoz O, Anderson ER, Brenner M, Tromberg BJ. Frequency-domain photon migration measurements of normal and malignant tissue optical properties in a human subject. Appl Opt. 1997;36:10–20. doi: 10.1364/ao.36.000010. [DOI] [PubMed] [Google Scholar]
- 11.Cerussi A, Shah N, Hsiang D, Durkin A, Butler J, Tromberg BJ. In vivo absorption, scattering, and physiologic properties of 58 malignant breast tumors determined by broadband diffuse optical spectroscopy. J Biomed Opt. 2006;11:044005. doi: 10.1117/1.2337546. [DOI] [PubMed] [Google Scholar]
- 12.Munro I, McGinty J, Galletly N, Requejo-Isidro J, Lanigan PM, Elson DS, Dunsby C, Neil MA, Lever MJ, Stamp GW, French PM. Toward the clinical application of time-domain fluorescence lifetime imaging. J Biomed Opt. 2005;10:051403. doi: 10.1117/1.2102807. [DOI] [PubMed] [Google Scholar]
- 13.Berezin MY, Lee H, Akers W, Achilefu S. Near infrared dyes as lifetime solvatochromic probes for micropolarity measurements of biological systems. Biophys J. 2007;93:2892–2899. doi: 10.1529/biophysj.107.111609. [DOI] [PMC free article] [PubMed] [Google Scholar]
- 14.Akers WJ, Berezin MY, Lee H, Achilefu S. Predicting in vivo fluorescence lifetime behavior of near-infrared fluorescent contrast agents using in vitro measurements. J Biomed Opt. 2008;13:054042. doi: 10.1117/1.2982535. [DOI] [PMC free article] [PubMed] [Google Scholar]
- 15.Cuccia DJ, Bevilacqua F, Durkin AJ, Tromberg BJ. Modulated imaging: quantitative analysis and tomography of turbid media in the spatial-frequency domain. Opt Lett. 2005;30:1354–1356. doi: 10.1364/ol.30.001354. [DOI] [PubMed] [Google Scholar]
- 16.Cuccia DJ. Ph.D. Thesis. Department of Biomedical Engineering, University of California Irvine; 2006. Modulated Imaging: A Spatial Frequency Domain Imaging Method for Wide-field Spectroscopy and Tomography of Turbid Media. [Google Scholar]
- 17.Cuccia DJ, Bevilacqua F, Durkin AJ, Ayers F, Tromberg BJ. Quantitation and mapping of tissue optical properties using modulated imaging. J Biomed Opt. 2009;14:024012. doi: 10.1117/1.3088140. [DOI] [PMC free article] [PubMed] [Google Scholar]
- 18.Gioux S, Frangioni JV. A low-cost universal cumulative gating circuit for small and large animal clinical imaging. Proc. SPIE. 2008;6848 doi: 10.1901/jaba.2008.6848-6481I. 684807-684801. [DOI] [PMC free article] [PubMed] [Google Scholar]
- 19.Westhauser M, Bischoff G, Borocz Z, Kleinheinz J, von Bally G, Dirksen D. Optimizing color reproduction of a topometric measurement system for medical applications. Med Eng Phys. 2008;30:1065–1070. doi: 10.1016/j.medengphy.2007.12.014. [DOI] [PubMed] [Google Scholar]
- 20.Paquit V, Price JR, Mériaudeau F, Tobin KW, Ferrell TL. Combining near-infrared illuminants to optimize venous imaging. Proc. SPIE. 2007;6509 [Google Scholar]
- 21.Paquit VC, Meriaudeau F, Price JR, Tobin KW. Simulation of skin reflectance images using 3D tissue modeling and multispectral Monte Carlo light propagation; Conf Proc IEEE Eng Med Biol Soc; 2008. pp. 447–450. [DOI] [PubMed] [Google Scholar]
- 22.Bassi A, Cuccia DJ, Durkin AJ, Tromberg BJ. Spatial shift of spatially modulated light projected on turbid media. J Opt Soc Am A Opt Image Sci Vis. 2008;25:2833–2839. doi: 10.1364/josaa.25.002833. [DOI] [PMC free article] [PubMed] [Google Scholar]
- 23.Weber JR, Cuccia DJ, Tromberg BJ. Modulated imaging in layered media; Conf Proc IEEE Eng Med Biol Soc; 2006. pp. 6674–6676. [DOI] [PubMed] [Google Scholar]
- 24.Kienle A, Lothar L, Patterson MS, Raimund H, Steiner R, Wilson B. Spatially resolved absolute diffuse reflectance measurements for noninvasive determination of the optical scattering and absorption coefficients of biological tissues. Appl Opt. 1996;35:2304–2314. doi: 10.1364/AO.35.002304. [DOI] [PubMed] [Google Scholar]
- 25.Ayers F, Grant A, Kuo D, Cuccia DJ, Durkin AJ. Fabrication and characterization of silicone-based tissue phantoms with tunable optical properties in the visible and near infrared domain; Proc. SPIE; 2008. p. 6870E. [Google Scholar]
- 26.Bevilacqua F, Berger AJ, Cerussi AE, Jakubowski D, Tromberg BJ. Broadband absorption spectroscopy in turbid media by combined frequency-domain and steady-state methods. Appl Opt. 2000;39:6498–6507. doi: 10.1364/ao.39.006498. [DOI] [PubMed] [Google Scholar]
- 27.Indebetouw G. Profile measurement using projection of running fringes. Appl Opt. 1978;17:2930–2933. doi: 10.1364/AO.17.002930. [DOI] [PubMed] [Google Scholar]
- 28.Takeda M, Mutoh K. Fourier transform profilometry for the automatic measurement of 3-D object shapes. Appl Opt. 1983;22:3977. doi: 10.1364/ao.22.003977. [DOI] [PubMed] [Google Scholar]
- 29.Srinivasan V, Liu HC, Halioua M. Automated phase-measuring profilometry of 3-D diffuse objects. Appl Opt. 1984;23:3105. doi: 10.1364/ao.23.003105. [DOI] [PubMed] [Google Scholar]
- 30.Zhou W, S, Su X, Y A direct mapping algorithm for phase-measuring profilometry. Journal of modern optics. 1994;41:89–94. [Google Scholar]
- 31.Farrell TJ, Patterson MS, Wilson B. A diffusion theory model of spatially resolved, steady-state diffuse reflectance for the noninvasive determination of tissue optical properties in vivo. Med Phys. 1992;19:879–888. doi: 10.1118/1.596777. [DOI] [PubMed] [Google Scholar]
- 32.Pilz M, Honold S, Kienle A. Determination of the optical properties of turbid media by measurements of the spatially resolved reflectance considering the point-spread function of the camera system. J Biomed Opt. 2008;13:054047. doi: 10.1117/1.2983675. [DOI] [PubMed] [Google Scholar]
- 33.Dognitz N, Wagnieres G. Determination of tissue optical properties by steady-state spatial frequency-domain reflectometry. Lasers Med Sci. 1998;13:55–65. [Google Scholar]
- 34.Svaasand LO, Spott T, Fishkin JB, Pham T, Tromberg BJ, Berns MW. Reflectance measurements of layered media with diffuse photon-density waves: a potential tool for evaluating deep burns and subcutaneous lesions. Phys Med Biol. 1999;44:801–813. doi: 10.1088/0031-9155/44/3/020. [DOI] [PubMed] [Google Scholar]
- 35.Kienle A, Patterson MS. Determination of the optical properties of turbid media from a single Monte Carlo simulation. Phys Med Biol. 1996;41:2221–2227. doi: 10.1088/0031-9155/41/10/026. [DOI] [PubMed] [Google Scholar]
- 36.Skydan OA, Lalor MJ, Burton DR. Technique for phase measurement and surface reconstruction by use of colored structured light. Appl Opt. 2002;41:6104–6117. doi: 10.1364/ao.41.006104. [DOI] [PubMed] [Google Scholar]
- 37.Gioux S, Kianzad V, Ciocan R, Gupta S, Oketokoun R, Frangioni JV. High power, computer-controlled, LED-based light sources for fluorescence imaging and image-guided surgery. Mol Imaging. 2009 In Press. [PMC free article] [PubMed] [Google Scholar]
- 38.Basri R, Jacobs DW. Lambertian reflectance and linear subspaces. IEEE Transactions Pattern Analysis and Machine Intelligence. 2003;25:218–233. [Google Scholar]


