

Abstract
Neuroinflammation is a common facet of both acute and chronic neurodegenerative conditions, exemplified by stroke and by Alzheimer’s and Parkinson’s disease, and the presence of elevated levels of the proinflammatory cytokine, tumor necrosis factor-α (TNF-α) has been documented in each. Although initial TNF-α generation is associated with a protective compensatory response, its unregulated chronic elevation is generally detrimental and can drive the disease process. In such circumstances, therapeutic strategies that can both gain access to the brain and target the production of TNF-α are predicted to be of clinical benefit. An in vitro mouse macrophage-like cellular screen, utilizing RAW 264.7 cells, was hence developed to identify novel TNF-α lowering agents incorporating lipophilic physicochemical characteristics predicted to allow penetration of the blood-brain barrier. Cultured RAW 264.7 cells exposed to lipopolysaccharide (LPS) induced a rapid, marked and concentration-dependent cellular release of TNF-α into the cell culture media, which was readily detected by Enzyme Linked ImmunoSorbent Assay (ELISA). The effects of four characterized thalidomide-based TNF-α lowering agents were assessed alongside 10 novel uncharacterized compounds synthesized on the same backbone. One of these new analogs possessed activity of sufficient magnitude to warrant further investigation. Activity determined in the cellular model translated to an in vivo rodent model of acute LPS-induced TNF-α elevation. The utility of the TNF-α cellular assay lies in its simplicity and robust nature, providing a tool for initial pharmacological screening to allow for the rapid identification novel TNF-α lowering agents.
Keywords: neuroinflammation, TNF-α, RAW 264.7, thalidomide, lenalidomide, lipopolysaccharide (LPS), neurodegeneration, Alzheimer’s disease
1. Introduction
Debilitating dementia related diseases of the central nervous system (CNS) are becoming progressively prevalent in the aging human population worldwide. Alzheimer’s disease (AD) is the most prevalent of these and, according to recent estimates, afflicts some 27 million people globally. This includes some 5 million Americans, a number that is expected to rise in forthcoming years. A common feature of AD and numerous neurological disorders is the involvement of an unregulated inflammatory status of the brain resident macrophage, the microglial cell (Maccioni et al., 2009; Rogers et al., 2007). A key pro-inflammatory protein synthesized and released by activated microglial cells is tumor necrosis factor-α (TNF-α) (Streit et al., 2005, Rogers & Lahiri, 2004). Not surprisingly, the presence of elevated levels of TNF-α has been documented in many forms of neurodegenerative disease of both chronic (e.g., AD, Parkinson’s disease, and amyotrophic lateral sclerosis) and acute onset (e.g., stroke and head trauma) (Tweedie et al., 2007). Recently in the setting of AD, anti-TNF-α therapy has been reported to provide rapid cognitive improvement in patients using perispinal injection of Enbrel (Etanercept, Tobincik 2007Etanercept, Tobincik 2008). Enbrel and alike anti-TNF-α therapeutics currently on the market (e.g., Remicade Infliximab), are large macromolecules that sequester and clear released TNF-α before it can bind to its receptors; thereby, preventing TNF-α signaling from taking place. Unfortunately, these proteins possess strictly limited blood-brain barrier penetrability, making their utility for neurological disorders less than optimal.
A potentially simpler approach would be to treat patients with small drug-like agents that combine TNF-α lowering activities with the potential to cross biological membranes, such as the gastrointestinal tract and blood-brain barrier. Thalidomide (N-α-phthalimidoglutarimide) possesses such properties through its ability to reduce the rate of synthesis of TNF-α protein (Moreira et al., 1993) and, consequent to its lipophilicity, is able to readily enter the brain (Melchert & List, 2007). Unfortunately, the TNF-α lowering activity of thalidomide is not particularly potent, requiring high doses that are both sedative and associated with adverse effects (Pillemer et al., 2004). Nevertheless, thalidomide provides a useful backbone to support the synthesis and development of feasibly more TNF-α potent and better tolerated analogues, as was successfully achieved with the analogue, lenalidomide (Revlimid), for treatment of multiple myeloma (Falco et al., 2008; Ocio et al., 2008). Agents such as these may have a utility in the clinical treatment of several neurodegenerative diseases (Tweedie at al., 2007).
To identify novel TNF-α lowering agents, a robust, rapid and reproducible in vitro macrophage-like, RAW 264.7 cell model was developed that utilizes an endotoxin, lipopolysaccharide (LPS). This component of the outer membrane of Gram-negative bacteria binds the CD14/TLR4/MD2 receptor complex, which promotes the secretion of pro-inflammatory cytokines in many cell types, but especially macrophage/microglial cells (Bosshart & Heinzelmann, 2007) in both in vitro and in vivo models of inflammation. Herein, we used LPS to stimulate RAW 264.7 cells to quantify the ability of thalidomide and analogs to lower the levels of induced TNF-α protein detected in culture media. This was combined with analysis of cell viability to differentiate a selective reduction in TNF-α synthesis from a non-specific decline in protein synthesis consequent to drug-induced toxicity. Well-tolerated agents that lower TNF-α may prove of value in defining the role of CNS microglial-induced TNF-α dependent events in the progressive nature of several CNS diseases.
2. Materials and Methods
2.1 Basic Culture of RAW 264.7 Cells
RAW 264.7 cells purchased from ATCC (Manassas, VA, USA), were grown in DMEM media supplemented with 10% FCS, penicillin 100 U/ml and streptomycin 100 μg/ml, were maintained at 37°C and 5% CO2, and were propagated as described by ATCC guidelines. For initial studies, different known densities of RAW 264.7 cells (50–800 × 103) were grown in 24 well plates and their viability and basal secretion of TNF-α (ELISA, BD Biosciences, San Jose, CA) were quantified over a period of 19 hr, initiated 24 hr after seeding. For all subsequent experiments, RAW 264.7 cells were seeded at a density of 100,000 cells per well in 24 well plates. One to two hours prior to the initiation of any pharmacological study, the seeding media was replaced with fresh media and the cells were allowed to equilibrate at 37°C and 5% CO2.
2.2 LPS-TNF-α Concentration Effect Study
RAW 264.7 cells were challenged with LPS (SIGMA, serotype 055:B5) at 0.1, 0.3, 0.6, 1, 10, 30 and 60 ng/ml. Each concentration was prepared in sterile saline and applied directly to each well in a 24 well plate. At 18 to 19 hr following the addition of LPS, conditioned media was harvested and analyzed for the quantification of secreted TNF-α protein levels or for the measurement of cell toxicity/proliferation. When cell proliferation was assessed, fresh drug and LPS free media was added to the wells and the appropriate assay was performed. In a separate experiment, the effects of a single concentration of LPS were assessed on the time dependence of the activation of RAW 264.7 cells. Culture media was harvested at 0, 15, 30 and 60 min and then hourly up to 5 hr after the addition of LPS to the cell culture media. Increases in the levels of TNF-α protein released into media were used as an index of RAW 264.7 cell activation.
2.3 LPS and TNF-α studies
Thalidomide and analogs were prepared in tissue culture grade dimethylsulphoxide (DMSO, SIGMA). RAW 264.7 cells were pretreated with thalidomide and analogs or vehicle (1:200 dilution) one hour prior to the addition of a single concentration of LPS. As described above, conditioned media was harvested and used for analysis of secreted TNF-α protein, cellular toxicity or proliferation. In the current study, the effects of thalidomide and four characterized thio-thalidomide analogs (Figure 1) were assessed in half-log concentrations ranging from 100 nM to 30 μM. Table 1 indicates the molar ratio and g per ml quantity for thalidomide and analogs used in this study. An additional series of novel thalidomide analogs (Figure 2) were, thereafter, assessed for TNF-α lowering activity at 3, 10 and 30μM concentrations. Thalidomide and analogues were synthesized to a chemical purity of >99.5%, and chemical characterization was undertaken by a combination of 1H NMR, 13C NMR and GC/MS analyses (Bruker AC-300 spectrometer (Zhu et al., 2003)), together with elemental analyses (Atlantic Microlab, Inc., Norcross, GA).
Figure 1.
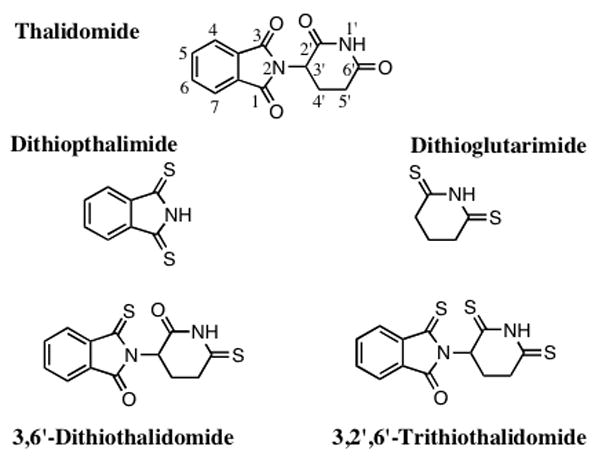
Chemical structures of thalidomide (C log D −0.83) and thiothalidomide analogs. The two hetrocyclic components that comprise thalidomide were isolated and subjected to specific thionation reactions to provide dithiopthalimide and dithioglutarimide (C log D 0.72 and −0.54, respectively). The intact thalidomide pharmacophore was subjected to controlled thionation reactions to generate the agents 3, 6′-dithiothalidomide and 3, 2′, 6′-trithiothalidomide (C log D −0.86 and −0.30, respectively).
Table 1.
Molar ratios and μg of drug per ml for thalidomide and analogs are shown.
| Drug | Molar Ratio | 1 μM μg/ml |
3 μM μg/ml |
10 μM μg/ml |
30 μM μg/ml |
|---|---|---|---|---|---|
| Thalidomide | 0.26 | 0.77 | 2.58 | 7.74 | |
| Dithioglutarimide | 0.15 | 0.44 | 1.45 | 4.35 | |
| Dithiopthalimide | 0.18 | 0.54 | 1.79 | 5.37 | |
| 3,6′-Dithiothal | 0.29 | 0.87 | 2.90 | 8.70 | |
| 3, 2′, 6′-Trithiothal | 0.31 | 0.92 | 3.06 | 9.18 |
Presented are the molar ratio and the μg/ml for thalidomide and analogs described in Figure 5. 3,6′-Dithiothal refers to 3,6′-Dithiothalidomide; 3, 2′, 6′-Trithiothal refers to 3, 2′, 6′-Trithiothalidomide.
Figure 2.
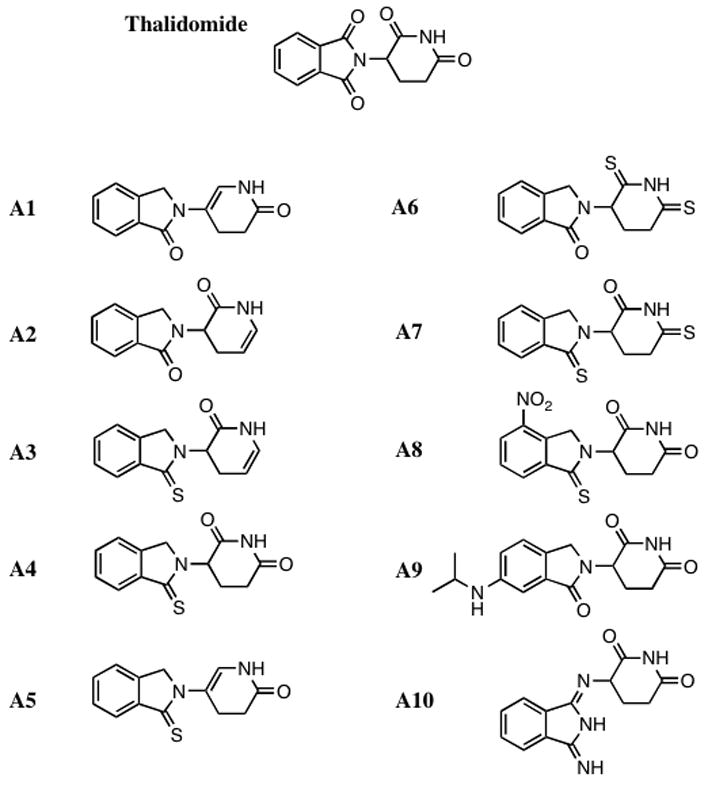
The structure of thalidomide and a series of novel thalidomide analogs are shown. The intact thalidomide pharmacophore underwent a series of medicinal chemistry modifications and the presented analogs were synthesized and characterized for anti-TNF-α activity.
2.4 Cellular Toxicity/Proliferation in Drug Treated RAW 264.7 Cells
Two methods were used to define drug-induced cellular toxicity/proliferation: the lactate dehydrogenase (LDH) assay is a widely accepted measure of cellular toxicity (Lahiri et al., 1998), and the CellTiter 96 AQueous One Solution Cell Proliferation Assay (Promega, Madison, WI) is routinely used as an assay of cell proliferation. Both assays were performed as recommended by the manufacturer. Changes in cellular health status are determined by use of indirect measures related to the formation of a colored tetrazolium dye product that can be measured spectrophotometrically at 490 nm λ An increase in absorbance at 490 nm is indicative of an elevated release of cellular LDH, consequent to loss of cell membrane viability: a positive marker of toxicity (LDH assay), or an increase in cell numbers for the cell proliferation assay. Optical densities (O.D.) were measured after 4 hr incubation at appropriate conditions.
2.5 Acute rodent treatment of LPS-induced TNF-α
Male Fisher 344 rats were anaesthetized (50 mg/kg sodium pentobarbital, 1 ml/kg vol. i.p.) and the right femoral artery was cannulated for blood sample collection (PE 50 catheter, filled with heparinized isotonic saline). Rats were pretreated with vehicle, with thalidomide or an analog at an equimolar concentration of 50 mg per/kg body weight thalidomide (i.p.). LPS (E. coli, 055:B5, SIGMA 1 mg/kg, i.p.) was administered one hour thereafter, and serial blood samples were collected over a subsequent 4 hr period. Cerebrospinal fluid (CSF) was withdrawn from the cisterna magna at the final time point. Plasma was derived immediately after collection (centrifugation: 8,000 G × 5 min), which together with CSF, was analyzed for TNF-α by ELISA.
2.6 Statistical analyses
Data throughout is expressed as means ± standard errors, with the number (n) of studies performed in parentheses. Statistical comparisons with controls and between treatments were undertaken by Dunnett’s T-test, with appropriate Bonferroni corrections for multiple comparisons as required (GraphPad InStat Version 3.05). P values of <0.05 are considered to be of statistical significance and specific values are provided within both the Figures and text.
3. Results
3.1 RAW 264.7 cell density and basal TNF-α
To define optimal growing conditions for RAW 264.7 cells, different cell densities were seeded into 24 well plates and equilibrated for 24 hr. Thereafter, measures of cell viability were quantified over the subsequent 19 hr. All cultures appeared healthy but as illustrated in Figure 3A, those with cell densities of ≥ 400 ×103 were associated with elevated levels of LDH, in comparison to both cell free media and cell densities of ≤200. Secreted basal TNF-α levels related to each cell density are shown in Figure 3B, and correlated positively with cell number (log concentration vs. TNF-α levels: r2= 0.95). Based on these studies, a cell density of 100 × 103 was utilized in subsequent work.
Figure 3.
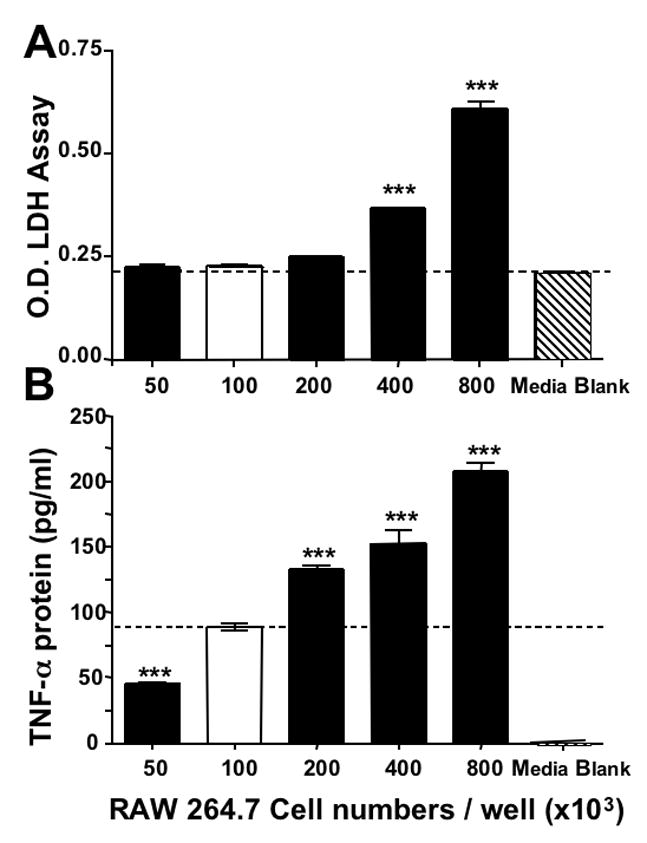
Optimization of RAW 264.7 cells in culture. Panel A depicts the relationship between seeded cell density and viability: increasing cell densities (50 – 800 × 103) were seeded in 24 well plates and equilibrated (24 hr); 19 hr thereafter, cell viability (n=4) was determined by LDH assay and compared to cell free media (***P<0.001). Additionally, cell viabilities of 400 and 800 ×103 densities were significantly different from seeded densities of 50 – 200 ×103 cells (P<0.001, Bonferroni t-test). Panel B shows the relationship between cell density and basal TNF-α generation: the levels of TNF-α associated with cells described in Panel A were quantified 19 hr following their equilibration. *P<0.05 was considered statistically significant (** P<0.01, *** P<0.001, Dunnett’s t-test) compared to a density of 100 × 103 cells, which was chosen for all subsequent studies.
3.2 LPS-TNF-α Concentration Dependence
Exposing RAW 264.7 cells to increasing concentrations of LPS induced a significant concentration-dependent elevation in secreted TNF-α levels in culture media (Figure 4A). A linear relationship was evident between the levels of secreted TNF-α protein and the concentration of LPS between 0.1 and 1 ng/ml administered (r2=0.86), with an approximate ~240-fold increase over baseline control TNF-α protein levels induced by 1 ng/ml LPS. TNF-α protein levels were maximally elevated 260-fold at the highest LPS concentration studied (60 ng/ml). The amount of protein secreted peaked and remained constant from 10 to 60 ng/ml LPS (TNF-α levels were: 10,775±760 pg/ml and 10,500±750 pg/ml, for 10 and 60 ng/ml, respectively; both P<0.0001 vs. control, n=5). In contrast, increasing concentrations of LPS had minor effects on RAW 264.7 cellular health, as determined by LDH assay, with insignificant changes in optical density for the tetrazolium dye product that are indicative of no altered LDH secretion into the culture media (data not shown). Indeed, only at the highest concentrations of LPS used were small non-significant changes in the LDH levels determined.
Figure 4.

LPS induced a rapid significant elevation in released TNF-α protein by RAW 264.7 cells into culture media. Panel A represents the LPS dose/response effect: cells were exposed to LPS for 19 hr and TNF-α levels were analyzed in media samples. All LPS concentrations induced a significant elevation in secreted TNF-α protein. Panel B displays the time-course of TNF-α protein release into culture media following LPS (0.6 ng/ml) challenge. A Dunnett’s t-test was performed and *P<0.05 was considered statistically significant (** P<0.01, *** P<0.001, n=3–7) compared to no LPS in panel A, and zero time in panel B.
The time course for the LPS-induced increase in secreted TNF-α protein levels is presented in Figure 4B following a submaximal LPS challenge (0.6 ng/ml), which was used in subsequent studies. Secreted TNF-α protein levels were not significantly different from control values at 15 min after LPS administration; but were significantly elevated 30 min post exposure and thereafter (TNF-α protein levels were 56±5 and 117±8 pg/ml at 0 and 30 min, respectively, P=0.003, both n=3).
3.3 LPS-induced TNF-α Lowering Studies
Initial studies utilized DMSO to dissolve thalidomide and analogs at a final dilution of 1:100 in culture media. However, this amount of DMSO proved to be slightly toxic to RAW 264.7 cells, causing a small but significant attenuation in the levels of secreted TNF-α protein detected in their media. Specifically, DMSO 1:100 media dilution reduced levels from 8,675±345 pg/ml to 7,265±365 pg/ml (P=0.012, n=10), some 16.25%. On further investigation, this DMSO dilution was determined to induce low but, nevertheless, significant, cellular toxicity: the LDH assay displayed an increase of 192±18% (P=0.0005, n=5), and MTS assay displayed a reduction of 10.2±2% (P=0.003, n=5). Through subsequent experimentation, a 1:200 dilution of DMSO in media proved sufficient to solublize thalidomide and analogs without invoking a detectable cytotoxic response, as monitored by the LDH and cell proliferation assays. Hence, all subsequent pharmacological studies were performed using DMSO at a 1:200 media dilution.
Under these optimized conditions, thalidomide displayed negligible TNF-α lowering activity at the concentrations studied. Specifically, 30 μM thalidomide led to a small, insignificant reduction in TNF-α protein levels (89±6% of control levels), without detectable changes in the LDH cell proliferation assays (data not shown). Pretreatment with a lower thalidomide dose, however, led to an insignificant elevation of TNF-α protein levels: 1μM thalidomide elevated levels to 164±25% of control (P=0.237). On the contrary, several thiothalidomides possessed TNF-α lowering action that proved more potent than equimolar thalidomide (Figure 5). Specifically, dithioglutarimide and 3,’6-dithiothalidomide reduced TNF-α levels at concentrations greater than 3μM. 3, ’2,’6-Trithiothalidomide and 3,’6-dithiopthalimide, likewise, displayed TNF-α inhibition properties at similar concentrations, but these were associated with evidence of cellular stress, as marked by elevations (albeit insignificant) in the LDH assay and reductions in the cell proliferation assay (data not shown). Statistically significant levels of cellular stress were detected at the highest concentrations of these compounds (10 and 30 μM). Of the 10 newly synthesized thalidomide analogues (A1–10), several possessed TNF-α protein lowering properties, which ranged from as little as 8% (analog A4) up to a 38% reduction (A10). Two agents, in particular, displayed classical concentration-dependent effects on TNF-α levels while one possessed potent TNF-α lowering properties with no obvious concentration dependence at those assessed in the present study (compound A10, Figure 6). A summary of TNF-α activity relative to cytotoxic properties of the agents at 30μM is provided in Table 2.
Figure 5.
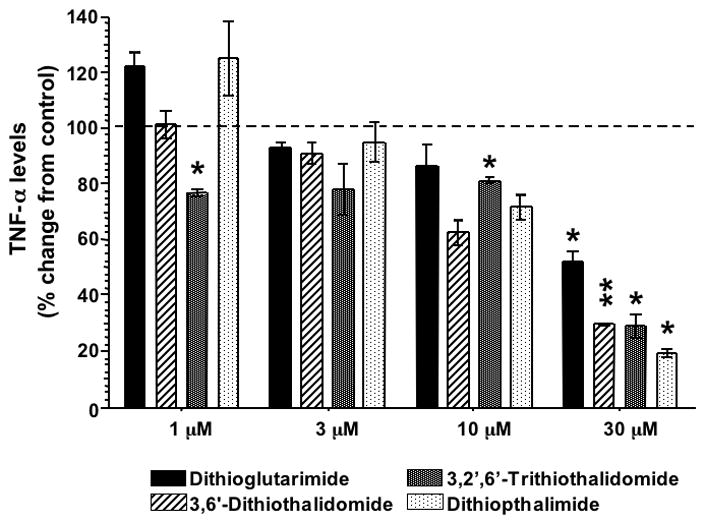
Effects of thiothalidomide analog pretreatment on the generation of LPS-induced TNF-α protein levels in RAW 264.7 cells. Drug concentrations less than 1 μM had no TNF-α effects on LPS treated RAW 264.7 cells (data not shown). Only at concentrations above 10 μM were there marked reductions in the levels of TNF-α protein detected in culture media (n ≤2). A Dunnett’s t-test was performed and *P<0.05 was considered statistically significant (** P<0.01, *** P<0.001).
Figure 6.

The effects of two representative novel thalidomide analogs on the synthesis and release of LPS induced TNF-α protein levels are presented. Analog A4 possessed modest effects upon the synthesis and release of TNF-α protein into the cell culture media. A10 possessed significant TNF-α lowering effects, but failed to display a classical dose-response effect within the concentrations studied. A Dunnett’s t test was performed and *P<0.05 was statistically significant (** P<0.01, *** P<0.001), n = 3.
Table 2.
Inhibition of LPS-induced TNF-α production in RAW 264.7 cells, cell viability and calculated lipophilicity of novel thalidomide analogs.
| TNF-α activity (30 μM) | Cell viability (30 μM) | C log D value* | |||
|---|---|---|---|---|---|
| Analog | control = 100% | control = 100% | |||
| % change | P value | % change | P value | ||
| A1 | 100±2 | 0.88 | 76±15 | 0.25 | 0.15 |
| A2 | 95±2 | 0.10 | 85±12 | 0.34 | 0.28 |
| A3 | 90±5 | 0.06 | 96±2 | 0.20 | 0.70 |
| A4 | 92±1 | 0.025 | 90±6 | 0.25 | 0.13 |
| A5 | 92±2 | 0.06 | 75±19 | 0.32 | 0.57 |
| A6 | 95±2 | 0.11 | 98±1 | 0.12 | −0.10 |
| A7 | 86±3 | 0.03 | 100±2 | 0.58 | −0.15 |
| A8 | 72±4 | 0.025 | 125±2 | 0.003 | 0.03 |
| A9 | 87±2 | 0.02 | 96±1 | 0.02 | 0.43 |
| A10 | 62±5 | 0.015 | 110±6 | 0.24 | −1.98 |
Presented values are mean± S.E.M. of n=3 measurements. A Students t test was used to assess for statistically significant changes; P<0.05 was considered significant.
C log D – calculated log D values were determined at pH 7.0 (CompuDrug, Pallas)
To assess the translational validity of the cellular assay, in vivo studies were undertaken in rats administered LPS to induce elevated systemic levels of TNF-α and assess whether or not these could be lowered by a thalidomide analog determined to possess activity in the cellular screen. Plasma TNF-α rose from an initially imperceptible level to 45,000 pg/ml by 90 min, it reached a plateau at 120 min and declined to 8,000 pg/ml by 4 hr. As illustrated in Figure 7, thalidomide and more potently, dithioglutarimide, lowered plasma TNF-α levels in a time-dependent manner. By contrast, CSF levels of TNF-α were significantly lowered by dithioglutarimide, but not thalidomide (Figure 8).
Figure 7.
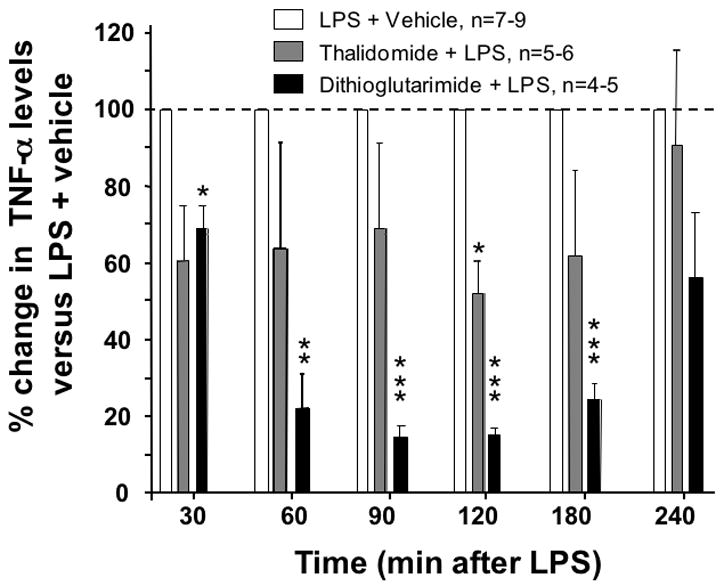
In vivo effects of thalidomide and analog on LPS-induced plasma TNF-α protein levels in rodent. Rats were pretreated with vehicle, with thalidomide (50 mg per/kg body weight) or dithioglutarimide (28 mg per/kg body weight, equimolar to 50 mg per/kg body weight thalidomide, i.p.). LPS (1 mg/kg, i.p.) was administered one hour thereafter, and serial blood samples were collected for analysis of plasma TNF-α. Data are expressed as the % change from LPS-vehicle treated values. A one sample t-test was performed on percentage change from the LPS-vehicle group, *P values ≤ 0.05 are statistically significant (** P<0.01, *** P<0.001)
Figure 8.

In vivo effects of vehicle, thalidomide and analog on LPS-induced changes in CSF TNF-α protein levels in rodents. Whereas dithioglutarimide lowered LPS-elevated CSF levels of TNF-α (P=0.003, one sample t-test), equimolar thalidomide was without significant effect (P>0.05). CSF TNF-α levels were determined at 4 hr from rats described in Figure 7, and compared to ‘pure controls’ – specifically, entirely naive animals that were unchallenged by LPS, thalidomide or analog.
4. Discussion
Herein, we describe an in vitro RAW 264.7 cellular model with the capacity to be used as a pharmacological screen for novel anti-inflammatory agents that lower the generation of TNF-α Stimulation of RAW 264.7 cells with the potent immune cell activator, LPS, induced a marked increase of TNF-α protein release into cell culture media. Prior studies utilizing RAW 264.7 cells consistently demonstrate their ability to synthesize and release a host of markers of inflammation (Nakao et al., 2008; McClain et al., 2002) and, hence, these cells have proven a valuable research tool for researchers studying pathological and physiological inflammation in disease.
In our hands, we employed a RAW 264.7 cell in vitro system to generate a rapid, reproducible model of inflammation to evaluate pharmacological agents predicted to reduce the levels of secreted TNF-α protein in culture media. Under our optimized culturing conditions we demonstrated that the effects of LPS on the RAW 264.7 cells were not associated with cellular toxicity. This is critical feature for any cell-based model when conducting pharmacological research to identify novel drug candidates, which may or may not possess inherent cellular toxicological properties (Jones & Diamond, 2007; Schinazi et al., 1999). In order to maximize the detection of the biological window of action of novel thalidomide analogs, we challenged the RAW 264.7 cells to a sub-maximal dose of LPS where the biological response for TNF-α appeared to be on the linear part of the LPS concentration/response curve. When comparing thiothalidomide analog data obtained from this RAW 264.7 cell model with a prior study the findings were in accord with regard to anti-TNF-α activity and cell toxicity as determined in freshly prepared human peripheral blood mononuclear cells (PBMCs) (Zhu et al., 2003). At low concentrations, thalidomide appeared to elevate TNF-α levels, which is likewise in accord with prior studies (Shannon & Sandoval, 1996). By contrast, all previously characterized thio-thalidomide analogues effectively lowered TNF-α protein levels in cell culture in a concentration-dependent manner. Dithioglutarimide, was chosen as a representative of these to assess translation from cell culture to animals, as it demonstrated moderate TNF-α lowering action in culture without inducing cellular stress. In animals, unlike thalidomide that ineffectively altered TNF-α in RAW 264.7 cells and only moderately (less than 50%) lowered LPS-induced plasma TNF-α levels at 120 min alone, dithioglutarimide substantially lowered LPS-induced plasma (up to 85%) over an extended period and entirely inhibited any rise in CSF TNF-α levels in rat (Figures 7 and 8); thereby suggesting that reductions observed in the cellular assay are of in vivo biological relevance.
The use of RAW 264.7 cells as an in vitro model to study the actions of inflammation on cellular processes or to identify novel anti-inflammatory agents is becoming more widespread as evidenced by the abundance of scientific articles published over the last 5 years. Prior to the establishment of monocyte-macrophage cell-lines (RAW 264.67 cells and others), researchers were forced to use purified PBMCs. The nature of obtaining these raw materials for use in pharmacological experiments has several disadvantages. Namely, this type of study is dependent upon obtaining a regular supply of healthy human blood where the whole blood is typically subjected to a series of manipulations to purify the white blood cells. Also using whole blood from different volunteers with different health statuses (i.e., one volunteer may suffer from allergies and another may not) may well introduce an uncontrollable degree of variability into pharmacological and physiological markers. In contrast to this, a major advantage of using a cell line model, such as RAW 264.7 cells as described in this study, is the highly reproducible nature of the biological response of the cells to immune cell activators, such as LPS. The utility of a reproducible in vitro RAW 264.7 cell model will allow for a greater consistency in studying the role both inflammation or anti-inflammatory agents in disease models and perhaps a more rapid turnover of screened novel anti-inflammatory pharmacological tools or medicines.
Based on the validation of the RAW 264.7 cellular model by our prior cell-based studies with PBMCs and translation to a rodent model, we proceeded to assess the potential anti-TNF-α effects of 10 novel thalidomide based analogs. Of the agents thus far studied, one demonstrated sufficient potency and lack of cellular toxicity to warrant characterization in animal studies. Our ongoing cellular and in vivo studies continue to indicate that TNF-α lowering compounds based on the backbone of thalidomide hold promise as therapeutics for a range of neurodegenerative conditions, as well as for peripheral autoimmune disease. The continued design and synthesis of novel thalidomide-based compounds to optimize their pharmacological actions combined with the described RAW 264.7 LPS model as a primary screen is being undertaken to test this premise.
Acknowledgments
The described research was supported by the Intramural Research Program, National Institute on Aging, NIH. Animal studies were undertaken on an approved protocol in accord with the Animal Care and Use Committee of the Intramural Research Program, NIA, NIH. Dr. David Tweedie is supported by the Medstar Research Institute.
Footnotes
Publisher's Disclaimer: This is a PDF file of an unedited manuscript that has been accepted for publication. As a service to our customers we are providing this early version of the manuscript. The manuscript will undergo copyediting, typesetting, and review of the resulting proof before it is published in its final citable form. Please note that during the production process errors may be discovered which could affect the content, and all legal disclaimers that apply to the journal pertain.
References
- Bosshart H, Heinzelmann M. Targeting bacterial endotoxin: two sides of a coin. Ann N Y Acad Sci. 2007;1096:1–17. doi: 10.1196/annals.1397.064. [DOI] [PubMed] [Google Scholar]
- Falco P, Cavallo F, Larocca A, Liberati AM, Musto P, Boccadoro M, Palumbo A. Lenalidomide and its role in the management of multiple myeloma. Expert Rev Anticancer Ther. 2008;8:865–74. doi: 10.1586/14737140.8.6.865. [DOI] [PubMed] [Google Scholar]
- Jones JO, Diamond MI. Design and implementation of cell-based assays to model human disease. ACS Chem Biol. 2007;2:718–24. doi: 10.1021/cb700177u. [DOI] [PubMed] [Google Scholar]
- Lahiri DK, Farlow MR, Sambamurti K. The Secretion of Amyloid-beta Peptides Is Inhibited in Tacrine-treated Human Neuroblastoma Cells. Mol Brain Res. 1998;62:131–40. doi: 10.1016/s0169-328x(98)00236-8. [DOI] [PubMed] [Google Scholar]
- Maccioni RB, Rojo LE, Fernández JA, Kuljis RO. The role of neuroimmunomodulation in Alzheimer’s disease. Ann N Y Acad Sci. 2009;1153:240–6. doi: 10.1111/j.1749-6632.2008.03972.x. [DOI] [PubMed] [Google Scholar]
- McClain CJ, Hill DB, Song Z, Chawla R, Watson WH, Chen T, Barve S. S-Adenosylmethionine, cytokines, and alcoholic liver disease. Alcohol. 2002;27:185–92. doi: 10.1016/s0741-8329(02)00224-0. [DOI] [PubMed] [Google Scholar]
- Melchert M, List A. The thalidomide saga. Int J Biochem Cell Biol. 2007;39:1489–99. doi: 10.1016/j.biocel.2007.01.022. [DOI] [PubMed] [Google Scholar]
- Moreira AL, Sampaio EP, Zmuidzinas A, Frindt P, Smith KA, Kaplan G. Thalidomide exerts its inhibitory action on tumor necrosis factor alpha by enhancing mRNA degradation. J Exp Med. 1993;177:1675–80. doi: 10.1084/jem.177.6.1675. [DOI] [PMC free article] [PubMed] [Google Scholar]
- Nakao N, Kurokawa T, Nonami T, Tumurkhuu G, Koide N, Yokochi T. Hydrogen peroxide induces the production of tumor necrosis factor-alpha in RAW 264.7 macrophage cells via activation of p38 and stress-activated protein kinase. Innate Immun. 2008;14:190–6. doi: 10.1177/1753425908093932. [DOI] [PubMed] [Google Scholar]
- Ocio EM, Mateos MV, Maiso P, Pandiella A, San-Miguel JF. New drugs in multiple myeloma: mechanisms of action and phase I/II clinical findings. Lancet Oncol. 2008;9:1157–65. doi: 10.1016/S1470-2045(08)70304-8. [DOI] [PubMed] [Google Scholar]
- Pillemer SR, Leakan RA, Sankar V, Manny J, Baum BJ, Smith J, Chaudhry U, Fox PC, Radfar L, Ligier S, Brennan MT. Prominent adverse effects of thalidomide in primary Sjögren’s syndrome. Arthritis Rheum. 2004;51:505–6. doi: 10.1002/art.20416. [DOI] [PubMed] [Google Scholar]
- Rogers JT, Lahiri DK. Metal and inflammatory targets for Alzheimer’s disease. Curr Drug Targets. 2004;5:535–51. doi: 10.2174/1389450043345272. [DOI] [PubMed] [Google Scholar]
- Rogers J, Mastroeni D, Leonard B, Joyce J, Grover A. Neuroinflammation in Alzheimer’s disease and Parkinson’s disease: are microglia pathogenic in either disorder? Int Rev Neurobiol. 2007;82:235–46. doi: 10.1016/S0074-7742(07)82012-5. [DOI] [PubMed] [Google Scholar]
- Shannon EJ, Sandoval F. Thalidomide can be either agonistic or antagonistic to LPS evoked synthesis of TNF-alpha by mononuclear cells. Immunopharmacol Immunotoxicol. 1996;18:59–72. doi: 10.3109/08923979609007110. [DOI] [PubMed] [Google Scholar]
- Schinazi RF, Ilan E, Black PL, Yao X, Dagan S. Cell-based and animal models for hepatitis B and C viruses. Antivir Chem Chemother. 1999;10:99–114. doi: 10.1177/095632029901000301. [DOI] [PubMed] [Google Scholar]
- Streit WJ, Conde JR, Fendrick SE, Flanary BE, Mariani CL. Role of microglia in the central nervous system’s immune response. Neurol Res. 2005;27(7):685–91. doi: 10.1179/016164105X49463a. [DOI] [PubMed] [Google Scholar]
- Tobinick E. Perispinal etanercept for treatment of Alzheimer’s disease. Curr Alzheimer Res. 2007;4:550–2. doi: 10.2174/156720507783018217. [DOI] [PubMed] [Google Scholar]
- Tobinick E. Perispinal etanercept produces rapid improvement in primary progressive aphasia: identification of a novel, rapidly reversible TNF-mediated pathophysiologic mechanism. Medscape J Med. 2008;10:135. [PMC free article] [PubMed] [Google Scholar]
- Tweedie D, Sambamurti K, Greig NH. TNF-alpha inhibition as a treatment strategy for neurodegenerative disorders: new drug candidates and targets. Curr Alzheimer Res. 2007;4:378–85. doi: 10.2174/156720507781788873. [DOI] [PubMed] [Google Scholar]
- Zhu X, Giordano T, Yu QS, Holloway HW, Perry TA, Lahiri DK, Brossi A, Greig NH. Thiothalidomides: novel isosteric analogues of thalidomide with enhanced TNF-alpha inhibitory activity. J Med Chem. 2003;46:5222–9. doi: 10.1021/jm030152f. [DOI] [PubMed] [Google Scholar]