

Abstract
The role of copper during the reoxidation of substrate-reduced amine oxidases by O2 has not yet been definitively established. Both outer-sphere and inner-sphere pathways for the reduction of O2 to H2O2 have been proposed. A key step in the inner-sphere mechanism is the reaction of O2 directly with the Cu(I) center of a [Cu(I) − semiquinone] intermediate. To thoroughly examine this possibility, we have measured the spectral changes associated with single-turnover reoxidation by O2 of substrate-reduced Arthrobacter globiformis amine oxidase (AGAO) under a wide range of conditions. We have previously demonstrated that the internal electron-transfer reaction [Cu(II) − TPQAMQ → Cu(I) − TPQSQ] (where TPQAMQ is the aminoquinol form of reduced TPQ and TPQSQ is the semiquinone form) occurs at a rate that could permit the reaction of O2 with both species to be observed on the stopped-flow time scale (Shepard EM and Dooley DM (2006) JBIC 11:1039-1048). The transient absorption spectra observed for the reaction of O2 with substrate-reduced AGAO provide compelling support for the reaction of the Cu(I) − TPQSQ form. Further, global analysis of the kinetics and the transient absorption spectra are fully consistent with an inner-sphere reaction of the Cu(I)-semiquinone intermediate with O2 and are inconsistent with an outer-sphere mechanism for the reaction of the reduced enzyme with O2.
Keywords: Amine Oxidase, Copper, Electron Transfer, Semiquinone, Oxygen Reduction, Superoxide
Amine oxidases catalyze the oxidative deamination of primary amines to aldehydes, with the concomitant reduction of O2 to H2O2. Copper-containing amine oxidases can be divided into two subclasses depending on the modified tyrosine residue present in the active site: 2,4,5-trihydroxyphenylalanine quinone (TPQ; E.C. 1.4.3.6) or lysine tyrosylquinone (LTQ; E.C. 1.4.3.13). The TPQ cofactor is formed by the post-translational six-electron oxidation of a conserved tyrosine residue, while LTQ is formed by means of the oxidation and crosslinking of a tyrosine and a lysine residue. Formation of both cofactors is a self-processing event requiring only copper and molecular oxygen (1-4).
The TPQ-containing amine oxidases (CuAOs) are widely distributed in nature, having a multitude of physiological roles including, but not limited to, hormone biosynthesis, detoxification, cell growth, signaling, histamine metabolism, lymphocyte adhesion, and adipocyte maturation (5-12). Over the last decade, the determination of multiple CuAO crystal structures has provided insight on the nature of substrate and substrate analog specificity, the biogenesis of the TPQ cofactor, and the enzyme mechanism (13-20). All the structurally characterized CuAOs are homodimers with molecular weights ranging from 140 – 240 kDa, and contain a single active site per monomer composed of a mononuclear Type II copper ion and the TPQ cofactor (21-23).
Amine oxidases utilize a Ping-Pong Bi Bi mechanism divided into two half-reactions:
| (1) |
| (2) |
The oxidation of primary amines to aldehydes is conventionally referred to as the reductive half-reaction (Eq 1; Scheme 1, A → B). The critical step in this half-reaction is abstraction of a proton from the α carbon of the amine substrate carried out by an absolutely conserved aspartate acting as general base. Reoxidation of the organic cofactor is known as the oxidative half-reaction (Eq 2), and is diagrammed in Scheme 1, B → E. Upon release of aldehyde, the reduced enzyme exists as an equilibrium between the two-electron reduced aminoquinol state [Cu(II) − TPQAMQ] (B) and the one-electron reduced semiquinone state [Cu(I) − TPQSQ] (C), with the magnitude of Keq being highly dependent upon temperature and the enzyme source (24). The two-electron oxidation of the reduced enzyme by O2 (producing H2O2) yields the iminoquinone form of TPQ (E, TPQIMQ), which may undergo hydrolysis liberating NH3 and the resting cofactor (A, TPQOX) (15).
Scheme 1.

Proposed CuAO catalytic mechanism illustrating the two proposed pathways for cofactor reoxidation.
Significant questions remain with regard to which species initially reduces O2, and whether or not the reoxidation mechanism differs for CuAOs purified from various sources. The two most plausible reoxidation mechanisms are detailed in Scheme 1. In one proposal, the initial reduction of O2 occurs by an inner-sphere reaction with Cu(I) (Scheme 1, C), resulting in a Cu(II) bound superoxide species (B → D) (24-26). This proposal circumvents the spin conversion problem associated with two-electron reduction reactions of oxygen (27), and is substantiated by the ample precedence for the reactivity of three-coordinate Cu(I) sites with O2 in copper-containing metalloproteins (28-30). Furthermore, detailed kinetics studies of the CuAO from lentil seedlings strongly supported the participation of the [Cu(I) − TPQSQ] intermediate in the reduction of O2 (31,32).
Additional support for an inner-sphere mechanism for reoxidation comes from metal-substitution experiments in Arthrobacter globiformis amine oxidase (AGAO) (33). Co(II)- and Ni(II)-substituted AGAO displayed kcat(O2) values of ∼ 1 % of the wild-type, Cu(II)-containing enzyme. Kishishita et al. (33) suggested that their data may be consistent with either an outer-sphere mechanism, where TPQAMQ directly reduces O2, or, given the significant rate advantage of native, copper-containing enzyme compared to the metal-substituted forms, an inner-sphere mechanism based on facile copper redox chemistry (33). Certainly, the kinetic advantage of the copper-containing enzyme is consistent with the [Cu(I) − TPQSQ] species as a viable intermediate.
In contrast, results obtained using the amine oxidases from Hansenula polymorpha (HPAO) and bovine plasma (BPAO) were consistent with an outer-sphere mechanism, thereby leading to the second proposal detailed in Scheme 1, B2 → D2 (34-37). These studies suggest that O2 binds in a hydrophobic pocket near the quinone cofactor and the first electron transfer reaction occurs via a classical outer-sphere step between TPQAMQ and O2 (B2 → C2; rate limiting step), with the [Cu(I) − TPQSQ] intermediate existing off-pathway, in equilibrium with species B2 (the semiquinone is not depicted in pathway B2 → D2 for the sake of clarity). The superoxide anion that is generated in the hydrophobic pocket then migrates to the Cu(II) center (C2 → D2) (38).
Notably, the flash frozen structure of catalytically competent Escherichia coli amine oxidase (ECAO) crystals following aerobic exposure to excess β-PEA reveals a dioxygen species bound to copper in a side-on fashion (39). The Cu-O-O bond angle of 88° is suggestive of a peroxide product, indicating that the cofactor is in the iminoquinone state. The observed peroxide species bridges the copper and TPQ cofactor, which could be consistent with electron transfer occurring from either TPQAMQ or Cu(I) (39,40).
It is clear that additional kinetics and spectroscopic experiments on structurally characterized CuAOs are necessary to define the reoxidation mechanism(s) and to probe the possibility that CuAOs from different sources are mechanistically distinct. Tanizawa and co-workers had previously demonstrated that AGAO is an excellent subject for investigating the oxidative half-reaction under single-turnover conditions (41). We carried out stopped-flow experiments as a function of pH, temperature, and O2 concentration using a photodiode array detector to collect spectra as a function of time. In contrast to the previous results (41), global data analysis of our data demonstrate that an inner-sphere mechanism is operative in which the [Cu(I) − TPQSQ] in AGAO reacts with O2, but is inconsistent with the direct reaction of TPQAMQ with O2 in an outer-sphere process.
Materials and Methods
Enzyme Purification
Our published procedure for overexpression of recombinant Strep-tagged AGAO in E. coli cells (42) was modified to eliminate catalase, thus simplifying the purification of AGAO. E. coli catalase depleted cells (BL21 DE3 CD03) were kindly provided by K. Tanizawa (33). The AGAO-Strep vector (pAGAOst) was then transformed into BL21 CD03 cells. The CD03 cells produced AGAO as effectively as the BL21 cells with production of only trace levels of catalase. Enzyme purification followed our published procedure (42) except that the final ultragel column was eliminated because this column was previously employed to separate catalase from AGAO. Generally ∼80 – 90 mg of purified AGAO was obtained from 4 L of cell culture. The purified protein is highly homologous and displays identical kinetics and spectroscopic properties to Strep-tagged AGAO (42) (E.M. Shepard, K.M. Hilmer and D.M. Dooley, unpublished results). Moreover, quantification of TPQ content accomplished via titration with phenylhydrazine (43) reveals preparations to consistently titrate 1.44 ± 0.02 TPQs per dimer.
Sample Preparation
All measurements were done in 100 mM potassium phosphate buffers, pH 7.2 or pH 8.2. For the experiments in D2O buffer, tribasic potassium phosphate was dissolved in D2O (99.9 atom % for deuterium, Aldrich). The pD of the solution was then decreased by addition of DCl (35 wt % solution in D2O, 99 atom % for deuterium, Aldrich) to a final pD of 8.25. All enzyme, substrate, and buffer solutions were transferred to sealed glass vials and thoroughly purged with Ar gas passed through a Vanadium bubbler, HCO3, H2O setup (44) for 3 hours. Solutions in D2O were only purged with Ar gas in order to prevent any deuterium isotope exchange with the H2O present in the Vanadium bubbler setup. When anaerobic, all solutions were transferred to a Coy anaerobic chamber (Coy Laboratories, Grass Lake, MI).
Separate 10 mL buffer solutions in glass vials were equilibrated with O2 in order to monitor reoxidation rates at distinct O2 concentrations. The first solution was bubbled with O2 gas for 30 minutes at 5 °C, yielding a final concentration of ∼ 1.40 mM O2, while the second solution was allowed to equilibrate with atmospheric O2 at 5 °C, producing a final concentration of ∼ 300 μM O2, as calculated based on published oxygen solubility tables (45). Each vial was subsequently sealed and transferred to the Coy anaerobic chamber. After mixing 1:1 with enzyme solutions in the stopped-flow, as described below, these buffers yield solutions with final O2 concentrations of 700 μM and 150 μM, respectively.
Substrate-reduced enzyme was prepared by addition of a 5-fold excess of β-phenylethylamine (β-PEA) (over active site concentration) and allowed to incubate for 20 minutes. An excess of β-PEA was utilized to ensure full reduction of the TPQ cofactor, in contrast to previous stopped-flow studies with AGAO (41). In order to ensure that single turnover conditions were achieved for stopped-flow studies, excess β-PEA was removed by running the anaerobic, substrate-reduced enzyme sample (following the incubation period) over a 5 mL PD-10 column (Pharmacia) that was equilibrated with 12 column volumes of anaerobic buffer (performed in the anaerobic chamber). Elution was accomplished by addition of anaerobic buffer. Fractions were collected by visual inspection, as the reduced enzyme is intensely yellow in color. The main protein fraction (∼ 1 mL) was collected and subsequently utilized for stopped-flow experiments. UV-vis spectral analysis of all fractions conclusively demonstrated the separation of excess β-PEA from enzyme.
Stopped-flow Measurements
Stopped-flow measurements were performed at 5 °C, 10 °C, and 20 °C with an Applied Photophysics SX.18MV photodiode-array stopped-flow spectrophotometer. To maximize the signal to noise ratio, the light guide was directly coupled to the lamp housing using a coupling device (Applied Photophysics). This effectively doubled the intensity of the lamp signal reaching the photodiode array in the 300 – 330 nm region.
To ensure anaerobic conditions were maintained during experimentation, the sample handling unit of the stopped-flow was housed inside the Coy anaerobic chamber, which was thoroughly purged of O2 (as monitored with an O2 sensor) via the use of N2/H2 gas mix in the presence of a Coy catalyst box. The thermostatted water bath utilized to control the temperature of the sample handling unit was thoroughly purged with N2 gas. Immediately prior to experimentation, the drive syringes on the sample handling unit were flushed with ∼ 40 mLs of anaerobic buffer. Equal volumes of the enzyme and buffer solutions were mixed and spectra were recorded at every 1.28 milliseconds in a wavelength region of 300 – 700 nm.
In order to confirm that full TPQ reduction was achieved and to obtain a control spectrum (see below), the enzyme sample from the PD-10 column elution was loaded into the sample handling unit of the stopped-flow using a Hamilton gas tight syringe. Another gas tight syringe was loaded containing anaerobic buffer. Spectral analysis of the reduced enzyme–anaerobic buffer mixture was then acquired for 500 milliseconds. The anaerobic buffer was then immediately flushed out of the drive syringe on the sample handling unit and replaced with buffer containing ∼1.4 mM O2. Spectral changes accompanying the oxidative half-reaction were then recorded. Upon data acquisition, the 1.4 mM O2 buffer was then immediately flushed out of the drive syringe on the sample handling unit and replaced with the 300 μM O2 buffer, at which time it was thoroughly flushed through the observation cell and data was again acquired. To ensure experimental reproducibility, three to four data sets at each oxygen concentration were obtained. In all cases, the results were highly reproducible.
Following data acquisition, files were exported in ASCII format. Spectra in the absence of O2 displayed the absorbance features characteristic of the TPQSQ moiety for the time course of the control experiment (500 milliseconds). An individual spectrum from this data file was then inserted into the 700 μM O2 and 150 μM O2 data files, respectively, as the initial t = 0 millisecond spectrum. The purpose of this was to establish a true starting point for the spectral changes associated with cofactor reoxidation. These measures were required because upon exposure of the reduced enzyme to O2, significant spectral changes occur during the dead-time (1.1 milliseconds) of the stopped-flow instrument.
Data Analysis
Potential reaction models for the oxidative half-reaction were examined using a global analysis software package (Pro-Kineticist II, Applied Photophysics). To minimize variables during the global analysis process, known spectra were entered into the Pro-Kineticist program for certain intermediate quinone and copper species along the reaction path. To summarize, anaerobically reduced CuAOs exist in an equilibrium between [Cu(II)-TPQAMQ] (Scheme 1, B) and [Cu(I)-TPQSQ] (Scheme 1, C) (24). The TPQSQ moiety displays a unique absorption spectrum with λmax values at ∼ 360, 440, and 470 nm (24-26,33,46), while the neutral TPQAMQ (Scheme 1, B) has a λmax ∼ 315 nm, with a featureless absorption spectrum in the visible region (47).
Keq values for the [Cu(II)−TPQAMQ] (x021C6) [Cu(I)-TPQSQ] equilibrium in AGAO have been experimentally determined at room temperature for pH 7.2 and pH 8.2 (48). The Keq values presented in Table 1 represent an average of the values obtained via extrapolation from a van't Hoff plot constructed from our previous measurements (48) and direct estimation of Keq from experimental absorbance values using λ480 of 1700 M-1cm-1 for TPQOX (38) and λ468 of 4500 M-1cm-1 for TPQSQ (48). The λ468 for TPQSQ in AGAO was independently determined by titration of substrate reduced enzyme with cyanide (20-fold excess over copper concentration). CN- binds Cu(I) thereby shifting the [Cu(II)−TPQAMQ] (x021C6) [Cu(I)-TPQSQ] equilibrium towards the latter species (49). Utilizing a factor of 1.4 reactive quinone species per dimer, based on titration of the oxidized enzyme with phenylhydrazine, a λ468 value of 4400 M-1cm-1 is obtained for TPQSQ. The calculation of kET and k-1 from respective Keq values assumes that the experimentally determined kobs (kET + k-1) for relaxation of reduced AGAO following a temperature jump is approximately independent of temperature. The availability of Keq for the intramolecular equilibrium, λ310 from a TPQAMQ model compound (33) and λ468 for TPQSQ enabled deconvolution of the fully reduced enzyme (TPQRED) spectrum (see above) into the component TPQAMQ and TPQSQ moieties under the majority of experimental conditions tested. Experiments in D2O are the exception as the effects of deuterium on the parameters listed in Table 1 are unknown. The deconvoluted TPQAMQ and TPQSQ files were appended with species concentration values and loaded into the Pro-K software program as separate fixed files, representing the contributions from each species to the t = 0 millisecond spectrum (TPQRED). Additionally, the rate constants for kET and k-1 (Table 1) were fixed during the model minimization process. A similar approach has recently been utilized in the global analysis of spectral changes accompanying the reductive half-reaction in AGAO (50).
Table 1.
Kinetic Parameters for the Internal Redox Equilibrium [Cu(II) − TPQAMQ] ⇋ [(Cu(I) − TPQSQ] in AGAO
| pH | Temperature | Keq | kET (s-1)a | k-1 (s-1)a |
|---|---|---|---|---|
| 7.2 | 5 °C | 0.29 | 73 ± 6 | 252 ± 20 |
| 7.2 | 10 °C | 0.33 | 82 ± 7 | 243 ± 20 |
| 7.2 | 20 °C | 0.48 | 106 ± 10 | 219 ± 19 |
| 8.2 | 10 °C | 0.35 | 35 ± 2 | 101 ± 5 |
The reported error values in kET and k-1 assume that the error in kobs from temperature jump relaxation measurements is equally shared (48).
Rate constants were obtained by fitting single wavelength difference absorbance changes to a first order rate equation using Origin 7.0 software (Microcal, MA, USA). Absorbance increases at 488 nm (pH 8.2 and pD 8.25 data) and 499 nm (pH 7.2 data) were not cleanly fit with a single exponential equation from time 0 to ∼20 milliseconds. The appearance of an isosbestic point after the initial phase (see results) supported the use of a double exponential fit for the full time series. Accordingly, absorbance changes at these wavelengths were fit with a biphasic exponential expression taking into account the initial contribution from the 450 nm intermediate. A time shift factor was used for the second rate of increase, associated explicitly with the isobestic conversion of the 340 nm intermediate to TPQOX. The absorbance changes from 0 – 2 milliseconds were excluded from fits due to the very rapid increase or decrease in absorbance occurring at certain wavelengths during the dead time of the stopped-flow instrument.
Results
Spectral Changes Associated With Single-Turnover Events At pH 7.2
The spectral changes accompanying reoxidation of fully reduced AGAO at pH 7.2 at 5 °C (Figure 1A), 10 °C (Figure 2A) and 20 °C (Figure S1A) establish that the reduced enzyme reacts rapidly with O2 at 700 μM O2. At 10 °C, the initial spectrum at 1.92 milliseconds shows that the majority of the TPQSQ species has reacted by this time, based on the substantial decrease of the characteristic TPQSQ absorbance features at 436 and 466 nm. These features are no longer detectable by ∼15 milliseconds at 5 °C, whereas they disappear by ∼ 3 milliseconds at 20 °C. This is not surprising as reoxidation in general is significantly faster at 20 °C than at 5 and 10 °C (see below).
Figure 1.

Stopped-flow spectral measurements of the reoxidation of reduced AGAO at 5 °C and pH 7.2. Protein concentration was 72 μM after mixing. (A) Observed spectral changes at 700 μM O2. The following color scheme applies to panels A and C. Red spectrum is at t=0 milliseconds, green spectrum = 1.92 milliseconds, blue = 3.2 milliseconds, cyan = 4.48 milliseconds, magenta = 5.76 milliseconds, and orange = 7.04 milliseconds. Spectral changes from 8.32 – 500 milliseconds represented in black. (B) Absorbance changes at fixed wavelengths from difference spectra at 700 μM O2 with associated exponential fits (see Materials and Methods). Single wavelengths shown are: 313.7 nm (!), 341.7 nm (−), and 499 nm (7). (C) Observed spectral changes at 150 μM O2. Protein concentration was 72 μM after mixing. (D) Absorbance changes at fixed wavelengths from difference spectra at 150 μM O2 with associated exponential fits (see Materials and Methods). Single wavelengths shown are: 313.7 nm (!), 341.7 nm (−), and 499 nm (7).
Figure 2.

Stopped-flow spectral measurements of the reoxidation of reduced AGAO at 10 °C and 700 μM O2. (A) Observed spectral changes at pH 7.2. Protein concentration was 71 μM after mixing. The following color scheme is identical for all spectra in this figure. Red spectrum is at t=0 milliseconds (see text), green spectrum = 1.92 milliseconds, blue = 3.2 milliseconds, cyan = 4.48 milliseconds, magenta = 5.76 milliseconds, and orange = 7.04 milliseconds. Spectral changes from 8.32 – 500 milliseconds represented in black. (B) pH 7.2 difference spectra created by subtracting the final oxidized TPQ spectrum at 500 milliseconds from each intermediate spectra. During the first ∼ 20 milliseconds of reoxidation, spectra shift through an isosbestic point at ∼385 nm. (C) Difference spectra at pH 7.2 showing the spectral changes from 23 – 500 milliseconds shifting through an isosbestic point at ∼392 nm. (D) Observed spectral changes at pH 8.2. Protein concentration was 66 μM after mixing. (E) pH 8.2 difference spectra created by subtracting the final oxidized TPQ spectrum at 500 milliseconds from each intermediate spectra. During the first ∼ 8 milliseconds of reoxidation, spectra shift through an isosbestic point at 420 nm. (F) Difference spectra at pH 8.2 showing the spectral changes from 8.32 – 500 milliseconds shifting through an isosbestic point at ∼390 nm.
To more clearly differentiate reoxidation rates as a function of temperature, difference spectra were created by subtracting the final, fully oxidized TPQOX spectrum from each intermediate spectrum (see Figure 2B and 2C for examples). This allowed us to plot single wavelength absorbance changes (Figure 1B, 1D and Figure S1B, S1D), enabling the determination of rate constants (Table S1). At 700 μM O2, the data reveal an extremely fast absorbance increase in the 325 – 375 nm region that occurs within the dead time of the stopped-flow instrument (Figure 2B). Despite the initial rapid increase in this region, the absorbance at 313.7 nm (Figure 1B, 1D and Figure S1B, S1D) decreases in single exponential fashion over the course of the entire reaction under all experimental conditions tested.
Based on the difference spectra, the oxidative half-reaction appears to occur in two phases, as evidenced by the presence of two distinct isosbestic points. During the first ∼ 20 milliseconds of the reaction, spectral changes shift through an isosbestic point at ∼ 385 nm (Figure 2B), whereas for the remainder of the half-reaction, spectral changes shift through an isosbestic point ∼ 392 nm (Figure 2C). These two isosbestic points are clearly resolved at both 5 and 10 °C, but only the second isosbestic point is apparent at 20 °C, owing to the faster reoxidation kinetics at this temperature (Table S1). Notably, at all three temperatures, the rates of decay at 313 and 341 nm are essentially equivalent to the rate of increase at 499 nm (which reflects formation of TPQOX), and decay of the ∼ 340 nm species is isosbestic with TPQOX formation (Figure 2C), which appears to be the rate-limiting step of the reaction.
The spectral changes accompanying reoxidation of fully reduced AGAO at pH 7.2 and 5 °C (Figure 1C), 10 °C (Figure 3A) or 20 °C (Figure S1C) at 150 μM O2 closely resemble those described at 700 μM O2 levels. Indeed, the data conclusively show that the spectral changes are essentially identical between the two [O2] values with one critical distinction. The characteristic TPQSQ absorbance bands at 436 and 466 nm in the first spectrum at 1.92 milliseconds at [O2] = 150 μM are significantly more intense than observed at 700 μM O2 (compare Figure 1A to 1C and Figure 2A to Figure 3A). Furthermore, over the course of the next ∼25 milliseconds, slight absorbance features at 436 and 466 nm are evident, indicating that the TPQSQ moiety is transiently present during reoxidation. These experiments also indicate that the observed rate constants at 313, 341, and 499 nm are essentially independent of oxygen concentration (Tables S1 and S2). The one exception to this is the initial rate of increase at 450 nm (see Discussion), which is calculated to be roughly half of that observed at 700 μM O2. Lastly, the spectral changes mimic the shift between the two isosbestic points as described for 700 μM O2, with the first isosbestic point existing at ∼ 380 nm during the first ∼ 20 milliseconds before shifting to the second isosbestic point at ∼ 390 nm for the remainder of the oxidative half-reaction (data not shown).
Figure 3.

Stopped-flow spectral measurements of the reoxidation of reduced AGAO at 10 °C and 150 μM O2. (A) Observed spectral changes at pH 7.2. Protein concentration was 71 μM after mixing. The following color scheme is identical for all spectra in this figure. Red spectrum is at t=0 milliseconds (see text), green spectrum = 1.92 milliseconds, blue = 3.2 milliseconds, cyan = 4.48 milliseconds, magenta = 5.76 milliseconds, and orange = 7.04 milliseconds. Spectral changes from 8.32 – 500 milliseconds represented in black. (B) pH 7.2 difference spectra created by subtracting the final oxidized TPQ spectrum at 500 milliseconds from each intermediate spectra. (C) Observed spectral changes at pH 8.2. Protein concentration was 66 μM after mixing. (D) pH 8.2 difference spectra created by subtracting the final oxidized TPQ spectrum at 500 milliseconds from each intermediate spectra.
Spectral Changes Associated With Single-Turnover Events At pH 8.2
Experiments at 700 μM O2 at pH 8.2 and 10 °C (Figure 2D) displayed similar spectral changes to those observed at pH 7.2, with three main exceptions. First, the 315:340 nm absorbance ratio at 1.92 milliseconds is ∼ 1:1 at pH 8.2 (Figure 2E), whereas this ratio is ∼ 1.25:1 at pH 7.2 (Figure 2B). Second, an initial, broader absorbance increase in the ∼400 nm region is observed at pH 8.2 (Figure 2D). Finally, the presence of this new feature in the 400 nm region shifts the initial isosbestic point from ∼ 385 nm at pH 7.2 to ∼ 420 nm at pH 8.2 (compare Figure 2B to 2E). The difference spectra are observed to shift through the 420 nm isosbestic point for ∼ 8 milliseconds before shifting to a second isosbestic point at ∼ 390 nm for the remainder of the oxidative half-reaction (Figure 2F). Just as was the case at pH 7.2, slight absorbance features due to the TPQSQ are transiently present after the addition of O2 and decay of the ∼ 340 nm species is isosbestic with TPQOX formation and again appears to be the rate-limiting step of the reoxidation reaction. As shown in Table S1, rates of decay at 313 and 341 nm are equal and are similar to the rate of increase at 488 nm (see below), the latter reflecting formation of TPQOX. The results indicate that the rate of TPQOX formation at pH 7.2 and pH 8.2 is virtually indistinguishable under our experimental conditions (Table S1).
The spectral changes accompanying reoxidation of fully reduced AGAO at pH 8.2 and 10 °C at 150 μM O2 (Figure 3C) mimic those described at 150 μM O2 at pH 7.2 and 10 °C but are distinct from the spectral changes described at 700 μM O2 levels at pH 8.2. Note especially that the initial absorbance increase at 400 nm is less prevalent at lower O2 levels, however, this absorbance is greater than that seen at pH 7.2 (Figure 3, A and C). Additionally, whereas the 1.92 millisecond absorbance ratio of 315:340 nm is clearly ∼ 1:1 at high O2 levels at pH 8.2 (Figure 2E), this ratio becomes ∼ 1.7:1 at 150 μM O2 (Figure 3D), comparable to the ratio of ∼ 1.4:1 observed at 150 μM O2 and pH 7.2 (Figure 3B). Unlike the initial spectra at high O2 levels, which cleanly shift through an isosbestic point at 420 nm, the difference spectra at 150 μM O2 do not shift through any clear isosbestic point during the first few milliseconds of the reaction with O2, but by ∼ 10 milliseconds they are observed to shift through an isosbestic point at ∼ 387 nm for the remainder of the oxidative half-reaction (data not shown).
The absorbance changes associated with the TPQSQ moiety during the initial phase of the reaction at pH 8.2 and 150 μM O2 are similar to those observed for pH 7.2 at 150 μM O2, again illustrating that the TPQSQ moiety is transiently present during reoxidation. Observed rate constants at 313, 341, and 488 nm for pH 8.2 are independent of oxygen concentration (Tables S1 and S2). Once again, the one exception to this is the initial rate of increase at 450 nm which is observed to be roughly half of that calculated at 700 μM O2.
Spectral Changes Associated With Single-Turnover Events At pD 8.25
Reoxidation experiments at 700 μM O2 at pD 8.25 and 10 °C (Figure S2A) displayed similar spectral changes to those observed at pH 8.2 with two main exceptions: (1) the initial 315:340 nm absorbance ratio, which is ∼1:1 at pH 8.2, becomes ∼0.8:1 in D2O (Figure S2C); and (2) an isotope effect is apparent. In agreement with previous findings (41), the absorbance at ∼ 400 nm persists longer at pD 8.25 than at pH 8.2, due to the longer lifetime of a Cu-peroxy intermediate (see below), and results in the difference spectra shifting through an isosbestic point at ∼ 424 nm for 16 milliseconds (Figure S2C), at which point the spectra then shift through an isosbestic point ∼ 390 nm for the duration of the oxidative half-reaction (data not shown). As observed at pH 7.2 and pH 8.2, slight absorbance features due to the TPQSQ are transiently present following addition of O2 and decay of the 340 nm species is isosbestic with TPQOX formation.
The second unique feature of the data collected in D2O is the slower rate of increase at 488 nm (Table S1), corresponding to TPQOX formation, indicating a kinetic isotope effect is present. This observation concurs with that reported by Hirota et al. (41). The spectral changes accompanying reoxidation of reduced AGAO at pD 8.25 and 10 °C at 150 μM O2 (Figure S2B) are similar to those described at pH 8.2 under the same experimental conditions.
Evidence For An O2 Derived Intermediate
Hirota et al. observed the absorbance at 400 nm to be more prevalent in D2O vs H2O at basic pH at ∼500 μM O2, and this absorbance feature was assigned as a Cu-peroxy intermediate (41). The calculated rates of decay at 400 nm at pH 8.2 and pD 8.25 reported in Table S1 are in excellent agreement with the rates of decay of this species reported in (41).
The data presented in this report provide further evidence that this intermediate is indeed an O2-derived species. A distinct feature at ∼400 nm was observed only at saturating O2 levels at pH 8.2 and pD 8.25 (Figure 2D, Figure S2A). This feature was much less prominent at [O2] = 150 μM, and absorbance changes at ∼400 nm were simply too small to accurately determine kobs for decay of this intermediate under these conditions. No absorbance increase was seen in this region for any of the experiments at pH 7.2, consistent with the hypothesis that the Cu-peroxy intermediate accumulates to a detectable level under basic conditions (41).
Global Data Analysis
Previous reports examining the oxidative half-reaction in AGAO provide an excellent framework to examine the current experimental results. For instance, it has been established that wild-type, copper-containing AGAO reacts extremely rapidly with O2 in a non rate-limiting fashion (apparent kobs ∼ 1000s-1) and that the rate-limiting step during reoxidation is formation of the charge-delocalized TPQOX cofactor via hydrolysis of the iminoquinone (33,41). Furthermore, we have recently determined the intramolecular electron transfer rate for the [Cu(II)−TPQAMQ] (x021C6) [Cu(I)−TPQSQ] equilibrium in AGAO (48) (Table 1).
Along these lines, two mechanisms for reoxidation have been put forth and are summarized in Scheme 1. The key difference between these pathways is the identity of the species that reacts with O2. In the top (inner-sphere) pathway (Scheme 1, B → D), Cu(I) is responsible for the first electron transfer to O2, whereas in the bottom (outer-sphere) pathway (Scheme 1, B2 → D2), the first electron transfer event to O2 occurs directly from TPQAMQ. To determine which mechanism is consistent with the data for AGAO, global analysis was utilized as a means to deconvolute the rapid scan stopped-flow spectral changes.
Given this body of information, we tested the pathways outlined in Scheme 1. Inspection of the data provides some clear insights into the reaction of TPQRED with O2. Most notably, the data collected at both O2 concentrations under all experimental conditions show a very rapid disappearance (within the dead time of the stopped-flow) in the majority of the absorbance features associated with TPQSQ. This permitted us to fix the pseudo-first-order rate constant for this kinetic step (TPQRED + O2 → TPQIMQ) at ∼ 1000 s-1 during global fitting analysis (note this would correspond to a second-order rate constant k2 = 1.4 × 10⁶ M-1s-1). Moreover, the spectral results clearly show the TPQSQ moiety to be transiently present following initial exposure to O2, as evidenced by slight absorbance features at 436 and 466 nm. These absorbance features are present at both 700 μM and 150 μM O2 levels, although they are more pronounced and are apparent for a longer time period at lower oxygen levels, as expected for an intermediate that is reacting with O2. Furthermore, under all experimental conditions, difference spectra clearly shift through an isosbestic point at ≈ 390 nm during the second, slower phase of the reoxidation reaction, showing the isosbestic conversion of a ∼ 340 nm intermediate to TPQOX (Figure 2C and 2F).
Global modeling of the experimental data with two user-defined models (Scheme 1, B → D and B2 → D2) establishes that the data are more consistent with the [Cu(I)−TPQSQ] couple reacting with O2, using a pseudo first order approximation for the reaction of Cu(I) with O2 in Eq 3. This difference is shown in Figure 4 which displays the calculated spectra from global modeling. It is important to note that, based on the spectral changes associated with the TPQSQ moiety during the initial phase of reoxidation, Scheme 1, B → D is more consistent with the data because this pathway invokes a rapid reaction of Cu(I) with O2 in a non-rate limiting fashion.
Figure 4.

Select best fit modeled spectra calculated during global analysis for the 10 °C, pH 7.2, 700 μM O2 experimental data set. (A) Calculated spectra from the user-defined model placing the TPQSQ moiety on-pathway, with kapparent for reaction of reduced enzyme with O2 set to 1000 sec-1 (Eq 3). (B) Calculated spectra from the user-defined model placing the TPQAMQ moiety on-pathway, with kapparent for reaction of reduced enzyme with O2 set to 1000 sec-1 (Eq 4). (C) Calculated spectra from the user-defined model placing the TPQAMQ moiety on-pathway, with kapparent for reaction of reduced enzyme with O2 set to being equivalent with the rate-limiting step at 22 sec-1 (Eq 4, Table S1). The following color scheme is identical for all spectra in this figure. The red line represents the experimentally obtained spectrum of the reduced enzyme at t = 0 milliseconds. All subsequent spectra are those generated during global analysis, with green corresponding to 1.92 milliseconds, blue = 3.2 milliseconds, cyan = 4.48 milliseconds, magenta = 5.76 milliseconds, orange = 7.04 milliseconds, black = 8.32 milliseconds, olive = 9.6 milliseconds, and violet = 10.88 milliseconds.
The calculated spectra for the inner-sphere mechanism agree exceptionally well with the experimental data (compare Figure 2A to Figure 4A). In light of the rate constants in Table 1 and the experimental spectral changes, global modeling suggests that the majority of the [Cu(I)−TPQSQ] present in the fully reduced enzyme reacts upon exposure to O2 within the dead-time of the stopped-flow. This result is consistent with the proposal that the interaction between Cu(I) and O2 is not rate-limiting. It is very important to recognize that the internal electron-transfer rates between [Cu(II) − TPQAMQ] and [Cu(I) − TPQSQ] are slow relative to the rate of reaction with O2. Hence, the reaction of these intermediates with O2 can be distinguished. The transient presence of the TPQSQ absorbance features during the first few milliseconds of reoxidation is consistent with the formation of [Cu(I) − TPQSQ] from unreactive [Cu(II) − TPQAMQ] at a rate of 82 s-1 (Eq 3; based on kinetics parameters for pH 7.2, 10 °C; Table 1), and its subsequent rapid reaction with O2.
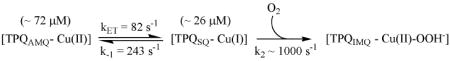 |
(3) |
 |
(4) |
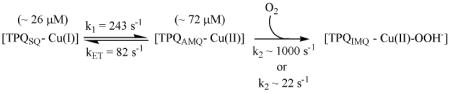
The close similarity between the experimental and calculated spectra obtained when [Cu(I)−TPQSQ] is modeled as the reactive intermediate is in stark contrast to the calculated spectra obtained when [Cu(II)−TPQAMQ] is modeled as the reactive intermediate. As seen in Figure 4B, the calculated spectra show a substantially larger contribution from the TPQSQ absorbance features during the first 6 milliseconds following O2 exposure, which is unambiguously inconsistent with the experimental data. The experimentally measured kET of 243 s-1 between Cu(I) and TPQSQ to yield TPQAMQ (Eq 4) is simply too low to account for the experimental spectral changes that occur within ∼ 6 milliseconds of O2 introduction. Consequently, this model does not converge in the global analysis even if it is assumed that k2 was ∼1000 s-1 (Eq 4). However, the outer-sphere mechanism (Scheme 1, B2 → D2) is predicated on the proposition that the reaction between TPQAMQ and O2 is rate-limiting (38). When k2 is modeled as the rate-limiting step (Table S1) the calculated spectra do not reproduce the observed spectra in any reasonable fashion (Figure 4C). Thus the outer-sphere mechanism is simply inconsistent with the experimental data.
One of the major advantages of our approach compared to previous studies (41) is the ability to deconvolute the reduced enzyme spectrum (TPQRED) into component TPQSQ and TPQAMQ contributions. These individual components, along with their initial concentration values (prior to O2 exposure), could then be fixed in global minimization routines. Rates for TPQOX formation were also entered for global analysis based on double exponential fits to absorbance changes (Tables S1 and S2) (see Materials and Methods). Rates of increase at 488 and 499 nm from these fits are less than rates of decrease at 341 nm, despite the isosbestic conversion of the 340 nm intermediate into TPQOX for all data sets. Given that three reactions contribute to the absorbance changes at 488 or 499 nm (formation of the 450-nm intermediate and its decay, formation of TPQOX) the error in the rates is larger than estimated by the fitting routines. In fact, a single-exponential fit to the absorbance changes at 488 or 499 nm at longer times (when the 450-nm intermediate has largely been consumed) provides a good description of the data but larger rate constants: for example, 21.8 and 20.6 s-1 for the pH 7.2, 10 °C data sets. For the global data analysis we therefore approximated the rate associated with TPQOX formation by choosing intermediate values between calculated rates of decrease at 340 nm and rates of increase for TPQOX (pH 7.2, 5 °C, 15 s-1; pH 7.2, 10 °C, 20 s-1; pH 7.2, 20 °C, 50 s-1; pH 8.2, 10 °C, 23 s-1) (Tables S1 and S2).
As mentioned, all data sets show rate-limiting isosbestic conversion of a ∼340 nm species to TPQOX (Figure 2C and 2F), providing strong evidence for the intramolecular hydrogen bonded iminoquinone. Accordingly, a spectrum of this quinone intermediate (Scheme 2D; TPQIMQ340) as derived from model studies (33) was employed in the analysis. Fixing the spectra of TPQSQ, TPQAMQ and TPQIMQ340 resulted in the generation of the intermediate spectrum of a species with a broad absorption band with λmax ∼ 450 nm in all cases tested (see below). This result is consistent with an iminoquinone species lacking an intramolecular hydrogen bond, analogous to species C in Scheme 2 (TPQIMQ450) (see Discussion). Given this finding, several user-defined models involving the two forms of the iminoquinone were tested for their ability to fit the experimental data (Supplementary Results). The model which best fit the experimental data suggested that oxidation of TPQSQ resulted in initial formation of TPQIMQ450, which is in equilibrium with TPQIMQ340, and both TPQIMQ450 and TPQIMQ340 hydrolyze to yield TPQOX (Scheme 2).
Scheme 2.

Revised CuAO catalytic mechanism for cofactor reoxidation in AGAO.
As discussed in the following section, O18 kinetic isotope effects on the reoxidation reaction of PSAO (51) and AGAO (J.P. Roth and D.M. Dooley, unpublished results) are consistent with reversible binding of O2 to Cu(I). Given these data, we tested a modification of our user-defined model allowing for the reversible binding of O2 to Cu(I), with second order rate constants of 1.4 × 10⁶ M-1s-1 at 700 μM O2 and 6.6 × 10⁶ M-1s-1 at 150 μM O2 (assumes kobs = 1000 s-1). The calculated spectra are in exceptional agreement with the 700 μM O2 and 150 μM O2 experimental data sets (compare Figure 5A to Figure 2A and Figure 5C to Figure 3A). Moreover, the absorption spectrum of the TPQIMQ450 intermediate generated during global analysis is quite reasonable based on expectations from TPQ model chemistry (see Discussion) (Figure 5E). Convergence fails if the second order rate is decreased to 2.8 × 10⁴ M-1s-1 (corresponding to a rate-limiting kobs of 20 s-1), lending further support to this model (Scheme 2).
Figure 5.

Best fit modeled spectra calculated during global analysis for the 10 °C, pH 7.2 experimental data sets. (A) Calculated spectra utilizing the model outlined in Scheme 2 with initial O2 concentration set at 700 μM. The following color scheme is identical for both panels A and C. The red line represents the experimentally obtained spectrum of the reduced enzyme at t = 0 milliseconds. All subsequent spectra are those generated during global analysis, with green corresponding to 1.92 milliseconds, blue = 3.2 milliseconds, cyan = 4.48 milliseconds, magenta = 5.76 milliseconds and orange = 7.04 milliseconds. All subsequent spectra in black represent the calculated, global analysis results for 8.32 – 500 milliseconds. (B) Profiles ([O2]initial = 700 μM) generated through global modeling detailing the concentration changes of each species over time. Species are as follows: [Cu(II)-TPQAMQ], black; [Cu(I)-TPQSQ], blue; O2, red; [Cu(II)-O2•--TPQSQ], orange; TPQIMQ340, magenta; TPQIMQ450, cyan; TPQOX, green. (C) Calculated spectra utilizing the model outlined in Scheme 2 with initial O2 concentration set at 150 μM. (D) Profiles ([O2]initial = 150 μM) generated through global modeling detailing the concentration changes of each species over time. Species are the same as in panel B. (E) Initial, intermediate and product global analysis spectra. Species colors are the same as given in panel B except both the [Cu(I)-TPQSQ] and [Cu(II)-O2•--TPQSQ] moieties are colored blue as they have identical absorption properties.
Additionally, modeling the reversible binding of O2 to Cu(I) offers an improvement in the spectra generated by global modeling, relative to the irreversible, first order O2 binding model (Eq 3) (compare Figure 5A to Figure 4A). For the pH 7.2, 700 μM O2 experimental data set, residuals are ≈ 15% of the experimental spectral contribution at 1.92 milliseconds (Figure S3A). The residuals decrease to ≤ 10% by 5.76 milliseconds (Figure S3B), are ≤ 5% at 10.88 milliseconds (Figure S3C) and are ≤ 2% at 16 milliseconds (Figure S3D). Residuals for all subsequent spectra are ≤ 1% (data not shown). For the pH 7.2, 150 μM O2 experimental data set, the initial residuals at 1.92 milliseconds are ≤ 10% of the experimental spectral contributions (Figure S4A). Residuals decrease to ≈ 7% by 5.76 milliseconds (Figure S4B), are ≤ 5% at 10.88 milliseconds (Figure S4C) and are ≤ 2% at 16 milliseconds (Figure S4D). The residuals for all subsequent spectra are ≤ 1% (data not shown). In all cases, the calculated spectra quickly converge to the experimental data. The magnitude of the residuals for the pH 7.2, 5 °C data sets are nearly indistinguishable from those at 10 °C, while those obtained for the pH 7.2, 20 °C data sets are ≤ 12% at 1.92 milliseconds and quickly decrease to ≤ 1% (data not shown).
The only data sets which could not be modeled were those collected at pD 8.25 as the effect of D2O on Keq is unknown, as is the effect of D2O on kET and k-1. Regardless, the spectral changes are qualitatively very similar to those at pH 8.2. The pH 8.2 data at 700 μM O2 was more difficult to analyze given the short-lived presence of the apparent Cu-OOH- species absorbing at ∼ 400 nm. Modification of the global model was made to account for the rapid formation of this intermediate with a decay rate based on single-exponential fits (Table S1, 380 s-1). Employing the kinetic rates in Table 1, global analysis showed that this model converged to the experimental data, although larger residuals were produced for initial spectra, relative to those observed for the pH 7.2 data.
At pH = 8.2 the initial residuals are significantly larger but the model satisfactorily reproduces the spectral contributions from 10 milliseconds and longer, yielding residuals at ∼ 11 milliseconds that are ≤ 10%, subsequently decreasing to ≤ 1% (data not shown). The large initial residuals in the 350 – 400 nm region can be attributed in part to the formation of the copper-peroxy species that absorbs in the 400 nm region, as this intermediate does not accumulate at pH 7.2. Visual inspection of the experimental data at pH 8.2 does show that the initial absorbance in the 480-nm region is less than that observed for the pH 7.2 data sets (compare Figure 2A and 2D and Figure 3A and 3C), indicating that there is likely a pH sensitive step in the reaction that is not explicitly included in our model. Other models were evaluated but failed to improve the global fits (data not shown). Attempts to model the pH 8.2, 700 μM O2 data with a scheme that eliminated the 450 nm (protonated) quinone intermediate showed that the global model would not converge to the experimental data and the intermediate spectrum generated for the 350 nm quinone species had significant absorption in the 450 nm region, indicating that both the 350 and 450 nm intermediates form at pH 8.2. It should be noted that kET is pH sensitive and is decreased relative to pH 7.2 (48). As suggested in Scheme 2, there are multiple steps sensitive to pH and more work remains to sort out the mechanism in that level of detail.
Discussion
The Proposed Role of Copper in Reoxidation
Scheme 1 details the two pathways for the reoxidation of the substrate-reduced form of copper-containing amine oxidases. The essential distinction is whether the initial electron transfer step occurs via an inner-sphere or an outer–sphere pathway. The pathway outlined in steps B → D depicts the non rate-limiting inner-sphere electron-transfer reaction between Cu(I) and O2. Clearly, a critical step in this mechanism is the rate of electron transfer between TPQAMQ and Cu(II), which we have measured by temperature-jump relaxation in three amine oxidases, most recently in AGAO (48). These measurements establish that kET is greater than kcat for the preferred substrate β-PEA at pH 6.2, 7.2 and 8.2, thereby permitting the [Cu(I)−TPQSQ] state to be a viable catalytic intermediate. Also, the magnitude of the forward and reverse electron-transfer rates permit the interconversion of the semiquinone and the aminoquinol to be observed on the stopped-flow time scale.
The outer-sphere mechanism outlined in Scheme 1, steps B2 → D2 depicts the proposal for cofactor reoxidation when the copper center is not involved in the initial electron-transfer reaction. It has been suggested that O2 binds in a hydrophobic pocket near the quinone cofactor, where it is subsequently reduced to O2•- by TPQAMQ in the rate-limiting step (B2 → C2) (38). Despite these key mechanistic differences, both pathways in Scheme 1 converge at the copper bound hydroperoxide, iminoquinone stage (species E).
Characterization of metal substituted forms of CuAOs has proven to be a valuable approach to distinguishing the reoxidation mechanisms. Kinetics studies of Cu(II), Co(II)- and Ni(II)-forms of AGAO revealed that the KM(O2) was virtually unchanged, whereas kcat was drastically reduced when the native copper ion was substituted with either cobalt or nickel (33). This is in marked contrast to metal-substitution studies with HPAO, where the significant reduction in activity observed for Co(II) was attributed to the 70-fold increase in KM(O2), relative to the wild-type, copper containing enzyme (34,35). In the case of metal substituted forms of AGAO, the reduction in kcat was attributed to the initial reaction between TPQAMQ and O2 being much slower in the metal-substituted enzymes (33), which implicates Cu(II) as playing an important role in the oxidative half-reaction. Kishishita et al. argued that the metal ion may bind superoxide and facilitate the second electron transfer event (33). However, the significant rate enhancement observed for the native enzyme is also consistent with a rapid inner-sphere reaction between Cu(I) and O2 that confers a kinetic advantage. We believed that a more careful analysis of the rapid spectral changes occurring following the introduction of O2 would provide a more direct means to observe the potential reactivity of the [Cu(I)-TPQSQ] species, given the rates of the reversible, internal electron-transfer reaction and the distinctive absorbance spectrum of the semiquinone.
Mechanism of the Oxidative Half-Reaction in AGAO
Temperature jump kinetics studies allowed us to determine the electron transfer rate between TPQAMQ and Cu(II) (48) and to resolve the kinetics parameters for the internal redox equilibrium presented in Table 1. Consequently, we could deconvolute the initial (t = 0 millisecond) TPQRED spectra into the component TPQAMQ and TPQSQ species, and observe the reactivity of the TPQAMQ versus the TPQSQ through global data analysis, given the distinct spectral properties of these two quinone species. Global data analysis provides strong support for the inner-sphere mechanism, where Cu(I) in the [Cu(I) − TPQSQ] species reacts rapidly with O2 (Figure 4 and Figure 5). Accordingly, we present a mechanism for cofactor reoxidation in AGAO that invokes a redox role for the copper center (Scheme 2). This mechanism is fully consistent with all the experimental data presented herein as well as the metal-substitution results in AGAO (33), but modifies the previous mechanism proposed in earlier stopped-flow work (41) (see discussion below). Importantly, the inner-sphere mechanism is also fully consistent with the recent mechanistic studies and 18O KIE measurements on the pea seedling amine oxidase (51), as well as the O18 KIE measurements on AGAO, which indicate that O2 binding is either reversible or, alternatively, that irreversible O2 binding is characterized by a late transition state (J.P. Roth and D.M. Dooley, unpublished results).
Inspection of the mechanism presented in Scheme 2 indicates that the rate of formation of TPQIMQ450 (Scheme 2, C) should approximate kET following the rapid conversion of the “resting state” concentration of [Cu(I) − TPQSQ] to [Cu(II) − OOH-−TPQIMQ450] upon initial O2 exposure, which predominately occurs in the dead time of the stopped-flow. Following this “burst” phase with kobs ∼1000 s-1, cofactor reoxidation proceeds through the conversion of unreactive [Cu(II) − TPQAMQ] into reactive [Cu(I) − TPQSQ] at a rate constant equivalent to kET, as the reaction of O2 with the enzyme is not rate limiting when O2 is saturating. Comparison of the rates of increase at 450 nm during the first 5 – 10 milliseconds at 700 μM O2 (Table S1) with the kET values in Table 1 shows reasonable agreement between these quantities. Moreover, inspection of experimental difference spectra clearly show the disappearance of a feature with absorbance at ∼ 310 nm during the initial phase of the oxidative half-reaction (Figure 2B, 2E and Figure 3B, 3D). We believe this represents the conversion of the unreactive TPQAMQ moiety (absorbing at ∼ 310 nm) into the reactive [Cu(I) − TPQSQ] species. The rate of decrease at 313 nm (Tables S1 and S2) likely does not equate to kET (Table 1) since three products of oxidation (TPQIMQ450, TPQIMQ350 and TPQOX) all have absorbance at ∼310 nm (Figure 5E). Therefore, the rate of decrease at 313 nm obtained from single wavelength absorbance changes is probably an underestimation of the true decay rate of this feature. In contrast, the initial rate of change at 450 nm (Tables S1 and S2) can be analyzed more confidently because only TPQIMQ450 and TPQOX absorb in this region and during the first ∼ 10 milliseconds of reoxidation the rate of change at 450 nm should be dominated by formation of TPQIMQ450.
Moreover, the data show that the TPQSQ absorbance features are more pronounced when O2 levels approach the concentration of TPQ and copper (Figure 1C and Figure 3A, 3C). The KM(O2) in AGAO has been determined to be 33 ± 2 μM (52). When O2 is not saturating ([O2] = 150 μM is ∼ 4.5 times KM), it is clear that a greater percentage of the available [Cu(I) − TPQSQ] in the resting enzyme does not completely react during the dead-time of the stopped-flow, compared to the reaction at [O2] = 700 μM (∼ 21 times KM). Consequently, following initial exposure to O2 the absorbance features due to the TPQSQ are more prevalent at [O2] = 150 μM compared to that observed at 700 μM O2, and persist for a longer period of time. At low [O2] the reaction of the Cu(I) − semiquinone with O2 may become partially rate-limiting such that the initial rate of increase at 450 nm (Table S2) no longer equates to kET (Table 1). These straightforward findings strongly support the inner-sphere mechanism for the reoxidation of substrate-reduced AGAO by O2, as outlined in Scheme 2.
Subsequent Steps in Cofactor Reoxidation
Global analysis of experimental absorbance changes indicated that oxidation of TPQSQ results in formation of TPQIMQ450, which is in equilibrium with TPQIMQ340. Hydrolysis of this latter species corresponds to the rate-limiting formation of TPQOX. These assignments are consistent with several enzyme and model studies, particularly the demonstration that the neutral iminoquinone (λmax ≈ 350 nm) exists with the illustrated intramolecular hydrogen bond (33,53), and that there is a substantial red-shift in λmax when this hydrogen bond is disrupted (53). Additionally, aeration of the aminophenol TPQ model compound resulted in formation of an iminoquinone species with a λmax value of 448 nm, representing an iminoquinone lacking the intramolecular hydrogen bond (47). This result was substantiated by the observation of a similar λmax when ammonia was added to resting BPAO (47). Furthermore, the existence of the TPQIMQ340 moiety during single turnover reoxidation conditions concurs with the flash frozen structure of the steady-state species in ECAO (39). Single crystal microspectrophotometry supported the iminoquinone assignment of TPQ in the crystals since the absorption spectrum was bleached (λmax ≈ 350 nm), consistent with a hydrogen bonded iminoquinone (33,53). Lastly, the observation that the difference spectra at pH 7.2 shift through the first isosbestic point for 20 milliseconds whereas the pH 8.2 difference spectra shift through the first isosbestic point for only 8 milliseconds may represent that the 350 nm iminoquinone (proposed to be deprotonated) forms more regularly at basic pH (Figure 2). This spectroscopic evidence may independently substantiate the pH sensitive equilibrium that the two iminoquinone species are proposed to exist in (Scheme 2).
The kinetics of reoxidation at pD = 8.25 suggest that the copper-hydroperoxide intermediate has a longer lifetime in D2O, relative to that observed at pH 8.2 (Table S1). Additionally, the spectral changes associated with the rate of increase at 488 nm are significantly slower than those at pH 8.2. We suggest that the slowed rate of increase at 488 nm in deuterium, corresponding to a KIE, represents rate-limiting formation of the fully oxidized, charge delocalized TPQOX moiety.
Comparison to Previous Stopped-Flow Studies of TPQRED Oxidation in AGAO
The previous stopped-flow study (41) of the reoxidation kinetics of reduced AGAO reported that the absorbance features of both the [Cu(II) − TPQAMQ] and [Cu(I) − TPQSQ] moieties disappeared within the dead time of the stopped-flow instrument. The products were suggested to be a Cu-peroxy species absorbing at ∼ 410 nm, and the protonated and deprotonated forms of the iminoquinone absorbing at 340 and 310 nm, respectively (41). However, the data were limited to a single temperature and one O2 concentration. Moreover, complete TPQ reduction was typically not achieved as stoichiometric amounts of substrate were used to reduce TPQOX, and the spectra displayed a relatively low signal to noise in the 300 – 320 nm region, which is a critical region for identifying intermediates in the reaction. Using the earlier studies as a solid foundation, we endeavored to extend and improve upon the results in several ways. First, cleaner single-turnover conditions were obtained by reducing the enzyme with excess substrate and separating the reduced enzyme from remaining substrate and aldehyde products immediately prior to experimentation. Second, our experimental design permitted us to acquire a true “time zero” spectrum of the reduced enzyme prior to addition of O2. Third, we were able to deconvolute the reduced enzyme spectrum into TPQAMQ and TPQSQ component spectra, and calculate the associated kinetics parameters for the various experimental conditions tested (Table 1, see Materials and Methods). Finally, and importantly, we obtained data at multiple temperatures, pH values and O2 concentrations.
Given the differences noted above, it is not surprising that in some instances our results do not completely concur with those reported previously (41). We believe this may be in part attributed to factors inherent to the rapid reaction of the [Cu(I) − TPQSQ] intermediate with O2. Following the addition of O2, the TPQSQ absorbance features make only a minor contribution to the observed spectra (Figure 1A, Figure 2A and 2D). These features become readily observable at non-saturating [O2] (Figure 1C, Figure 3A and 3C). Because Hirota et al. only examined reoxidation under saturating O2 conditions, it is quite reasonable that these slight absorbance features were simply missed, leading them to conclude that the absorbance features characteristic of both the TPQAMQ and TPQSQ moieties disappeared within the dead time of the stopped-flow. Our results conclusively show this to not be the case.
Furthermore, Hirota et al. reported an absorbance increase at 310 nm over the first 20 milliseconds of the oxidative half-reaction (41). Under all experimental conditions we tested, our data clearly show a clean, single-exponential decay at this wavelength (see Figure 1B, 1D and Figure S1B, S1D for examples). We were only able to observe an absorbance increase at 310 nm during this time period under multiple turnover conditions, where product aldehydes were present (Figure S5A). In our attempts to identify the optimal conditions to achieve full TPQOX reduction and clean separation of excess β-PEA from AGAO, stopped-flow data was collected from an enzyme sample which was reduced with 5 mM β-PEA. It was determined that at this relatively high concentration of β-PEA, complete separation from protein could not be achieved on the PD-10 column, resulting in trace amounts of amine and (probably) aldehydes present during reoxidation experiments (Figure S5A). None of the single-wavelength absorbance traces show single exponential behavior during the first ∼25 milliseconds following O2 introduction (Figure S5B). These results resemble those reported by Hirota et al., where “stoichoimetric” β-PEA was used to reduce TPQOX. The authors make note that incomplete TPQ reduction was sometimes observed. It is therefore possible that not all of the substrate reacted, such that trace amounts of β-PEA were present. Additionally, product aldehyde would have been present in these experiments. Either outcome, or both, could complicate the results. We also believe that the spectral assignments made by Hirota et al. for the two iminoquinone intermediates, which were based on spectral changes occurring during the first ∼20 milliseconds following addition of O2 (41), are questionable. Conversely, the assignments in Scheme 2 are fully consistent with our results.
Conclusions
The stopped-flow kinetics, spectra, and global data analysis results provide strong evidence for an inner-sphere mechanism (Scheme 2) for the oxidative half-reaction in AGAO. While these data provide strong support for the catalytic viability of the [Cu(I) − TPQSQ] couple in AGAO, the kinetic competence of this moiety among CuAOs from other sources is not fully resolved. A substantial body of data establish that the [Cu(I) − TPQSQ] intermediate reduces O2 in the plant enzymes (25,31,51,52). Furthermore, given the results and analysis in (51) it is plausible that [Cu(I) − TPQSQ] is a catalytic intermediate more generally among CuAO enzymes, given the high degree of similarity in active site architecture. It might be possible that CuAOs from different sources utilize distinct mechanisms of TPQRED oxidation, and this possibility may need to be evaluated on a case-by-case basis. Indeed, it appears possible that an outer-sphere mechanism operates in the Co(II)- and Ni(II)-substituted forms of AGAO, although with rate constants that are ∼ 1% of the native, Cu(II)-containing enzyme (33). In any event, the data presented herein demonstrate that the active site environment in native AGAO has been tuned to exploit the reactivity of [Cu(I) − TPQSQ].
Supplementary Material
Acknowledgments
We are grateful to Kimberly M. Hilmer for purifying the AGAO used in the pH 7.2, 5 °C stopped-flow experiments and to Jonathan K. Hilmer for helpful discussions about global data analysis. We thank Doreen E. Brown for titrating substrate reduced AGAO with cyanide for the determination of the TPQSQ ε468 value. We thank Professor Minae Mure (Kansas State) for helpful discussions concerning the proposed reoxidation mechanism.
Abbreviations
- AGAO
Arthrobacter globiformis amine oxidase
- BPAO
bovine plasma amine oxidase
- CuAO
copper and TPQ-containing amine oxidase
- ECAO
Escherichia coli amine oxidase
- EPR
electron paramagnetic resonance
- HPAO
Hansenula polymorpha amine oxidase
- kET
electron transfer rate
- LTQ
lysine tyrosylquinone
- β-PEA
β-phenylethylamine
- PSAO
pea seedling amine oxidase
- TPQ
2,4,5-trihydroxyphenylalanine quinone
- TPQAMQ
aminoquinol form of TPQ
- TPQIMQ
iminoquinone form of TPQ
- TPQIMQ340
intramolecular hydrogen bonded iminoquinone form of TPQ
- TPQIMQ450
iminoquinone form of TPQ lacking the intramolecular H-bond
- TPQOX
oxidized form of TPQ
- TPQRED
reduced form of TPQ existing in equilibrium between TPQAMQ and TPQSQ
- TPQSQ
semiquinone form of TPQ
Footnotes
This research was supported by grant GM 27659 (D.M.D) from the National Institutes of Health.
Supporting Information Available
Rate constants during single-turnover reoxidation of reduced AGAO at 700 μM O2 levels (Table S1) and 150 μM O2 levels (Table S2), stopped-flow spectral measurements of reoxidation at 20 °C, pH 7.2 at 700 μM O2 (Figure S1A) and 150 μM O2 (Figure S1C) along with respective absorbance changes at fixed wavelengths (Figure S1B and S1D), stopped-flow spectral measurements of reoxidation at 10 °C, pD 8.25 at 700 μM O2 (Figure S2A) and 150 μM O2 (Figure S2B) and associated difference spectra for 700 μM O2 data (Figure S2C), description of the user-defined models involving the two forms of the iminoquinone which were used to fit experimental data (Supplementary Results), overlay of experimental pH 7.2, 10 °C data with associated best fit model spectra generated through global analysis and associated residuals for 700 μM O2 at four time points (Figure S3A – D) and 150 μM O2 at four time points (Figure S4A – D), and stopped-flow spectral measurements of reoxidation at 10 °C, pH 7.2 at 700 μM O2 under multiple turnover conditions (Figure S5A) with associated absorbance changes at fixed wavelengths (Figure S4B). This material is available free of charge via the Internet at http://pubs.acs.org.
References
- 1.Ruggiero CE, Dooley DM. Stoichiometry of the topa quinone biogenesis reaction in copper amine oxidases. Biochemistry. 1999;38:2892–2898. doi: 10.1021/bi9824994. [DOI] [PubMed] [Google Scholar]
- 2.Ruggiero CE, Smith JA, Tanizawa K, Dooley DM. Mechanistic studies of topa quinone biogenesis in phenylethylamine oxidase. Biochemistry. 1997;36:1953–1959. doi: 10.1021/bi9628836. [DOI] [PubMed] [Google Scholar]
- 3.Bollinger JA, Brown DE, Dooley DM. The formation of lysyltyrosine quinone (LTQ) is a self-processing reaction. Expression and characterization of a Drosophila lysyl oxidase. Biochemistry. 2005;44:11708–11714. doi: 10.1021/bi0504310. [DOI] [PubMed] [Google Scholar]
- 4.DuBois JL, Klinman JP. Mechanism of post-translational quinone formation in copper amine oxidases and its relationship to the catalytic turnover. Arch Biochem Biophys. 2005;433:255–265. doi: 10.1016/j.abb.2004.08.036. [DOI] [PubMed] [Google Scholar]
- 5.Elmore B, Bollinger JA, Dooley DM. Human kidney diamine oxidase: Heterologous expression, purification, and characterization. J Biol Inorg Chem. 2002;7:565–579. doi: 10.1007/s00775-001-0331-1. [DOI] [PubMed] [Google Scholar]
- 6.Carter SR, McGuirl MA, Brown DE, Dooley DM. Purification and active-site characterization of equine plasma amine oxidase. J Inorg Biochem. 1994;56:127–141. doi: 10.1016/0162-0134(94)85043-7. [DOI] [PubMed] [Google Scholar]
- 7.McIntire WS, Hartmann C. Copper-Containing Amine Oxidases. In: Davidson VL, editor. Principles and Applications of Quinoproteins. Marcel Dekker Inc.; New York: 1993. pp. 97–171. [Google Scholar]
- 8.Mercier N, Moldes M, El Hadri K, Fève B. Regulation of semicarbazide-sensitive amine oxidase expression by tumor necrosis factor-α in adipocytes: Functional consequences on glucose transport. J Pharmacol Exp Ther. 2003;304:1197–1208. doi: 10.1124/jpet.102.044420. [DOI] [PubMed] [Google Scholar]
- 9.Yu PH, Wright S, Fan EH, Lun ZR, Gubisne-Harberle D. Physiological and pathological implications of semicarbazide-sensitive amine oxidase. Biochim Biophys Acta. 2003;1647:193–199. doi: 10.1016/s1570-9639(03)00101-8. [DOI] [PubMed] [Google Scholar]
- 10.Boomsma F, Bhaggoe UM, Van der Houwen AMB, Van den Meiracker AH. Plasma semicarbazide-sensitive amine oxidase in human (patho)physiology. Biochim Biophys Acta Protein Struct Mol Enzymol. 2003;1647:48–54. doi: 10.1016/s1570-9639(03)00047-5. [DOI] [PubMed] [Google Scholar]
- 11.O'Sullivan J, Unzeta M, Healy J, O'Sullivan MI, Davey G, Tipton KF. Semicarbazide-sensitive amine oxidases: Enzymes with quite a lot to do. Neurotoxicology. 2004;25:303–315. doi: 10.1016/S0161-813X(03)00117-7. [DOI] [PubMed] [Google Scholar]
- 12.Matyus P, Dajka-Halasz B, Foldi A, Haider N, Barlocco D, Magyar K. Semicarbazide-sensitive amine oxidase: current status and perspectives. Curr Med Chem. 2004;11:1285–1298. doi: 10.2174/0929867043365305. [DOI] [PubMed] [Google Scholar]
- 13.Parsons MR, Convery MA, Wilmot CM, Yadav KDS, Blakeley V, Corner AS, Phillips SEV, McPherson MJ, Knowles PF. Crystal structure of a quinoenzyme: copper amine oxidase of Escherichia coli at 2 Å resolution. Structure. 1995;3:1171–1184. doi: 10.1016/s0969-2126(01)00253-2. [DOI] [PubMed] [Google Scholar]
- 14.Kumar V, Dooley DM, Freeman HC, Guss JM, Harvey I, McGuirl MA, Wilce MCJ, Zubak VM. Crystal structure of a eukaryotic (pea seedling) copper-containing amine oxidase at 2.2 Å resolution. Structure. 1996;4:943–955. doi: 10.1016/s0969-2126(96)00101-3. [DOI] [PubMed] [Google Scholar]
- 15.Wilce MCJ, Dooley DM, Freeman HC, Guss JM, Matsunami H, McIntire WS, Ruggiero CE, Tanizawa K, Yamaguchi H. Crystal structures of the copper-containing amine oxidase from Arthrobacter globiformis in the holo and apo forms: Implications for the biogenesis of topaquinone. Biochemistry. 1997;36:16116–16133. doi: 10.1021/bi971797i. [DOI] [PubMed] [Google Scholar]
- 16.Li RB, Klinman JP, Mathews FS. Copper amine oxidase from Hansenula polymorpha: the crystal structure determined at 2.4 Å resolution reveals the active conformation. Structure. 1998;6:293–307. doi: 10.1016/s0969-2126(98)00033-1. [DOI] [PubMed] [Google Scholar]
- 17.Duff AP, Cohen AE, Ellis PJ, Kuchar JA, Langley DB, Shepard EM, Dooley DM, Freeman HC, Guss JM. The crystal structure of Pichia pastoris lysyl oxidase. Biochemistry. 2003;42:15148–15157. doi: 10.1021/bi035338v. [DOI] [PubMed] [Google Scholar]
- 18.Lunelli M, Di Paolo ML, Biadene M, Calderone V, Battistutta R, Scarpa M, Rigo A, Zanotti G. Crystal structure of amine oxidase from bovine serum. J Mol Biol. 2005;346:991–1004. doi: 10.1016/j.jmb.2004.12.038. [DOI] [PubMed] [Google Scholar]
- 19.Chen ZW, Schwartz B, Williams NK, Li RB, Klinman JP, Mathews FS. Crystal structure at 2.5 Å resolution of zinc-substituted copper amine oxidase of Hansenula polymorpha expressed in Escherichia coli. Biochemistry. 2000;39:9709–9717. doi: 10.1021/bi000639f. [DOI] [PubMed] [Google Scholar]
- 20.O'Connell KM, Langley DB, Shepard EM, Duff AP, Jeon HB, Sun G, Freeman HC, Guss JM, Sayre LM, Dooley DM. Differential inhibition of six copper amine oxidases by a family of 4-(aryloxy)-2-butynamines: evidence for a new mode of inactivation. Biochemistry. 2004;43:10965–10978. doi: 10.1021/bi0492004. [DOI] [PubMed] [Google Scholar]
- 21.Dove JE, Klinman JP. Trihydroxyphenylalanine quinone (TPQ) from copper amine oxidases and lysyl tyrosylquinone (LTQ) from lysyl oxidase. Adv Protein Chem. 2001;58:141–174. doi: 10.1016/s0065-3233(01)58004-3. [DOI] [PubMed] [Google Scholar]
- 22.Dawkes HC, Phillips SEV. Copper amine oxidase: cunning cofactor and controversial copper. Curr Opin Struct Biol. 2001;11:666–673. doi: 10.1016/s0959-440x(01)00270-6. [DOI] [PubMed] [Google Scholar]
- 23.Halcrow M, Phillips S, Knowles P. Amine Oxidases and Galactose Oxidase. In: Holzenburg A, Scrutton N, editors. Subcellular Biochemistry. Kluwer Academic/Plenum Publishers; New York: 2000. pp. 183–231. [DOI] [PubMed] [Google Scholar]
- 24.Dooley DM, McGuirl MA, Brown DE, Turowski PN, McIntire WS, Knowles PF. A Cu(I)-semiquinone state in substrate-reduced amine oxidases. Nature. 1991;349:262–264. doi: 10.1038/349262a0. [DOI] [PubMed] [Google Scholar]
- 25.Turowski PN, McGuirl MA, Dooley DM. Intramolecular electron transfer rate between active-site copper and topa quinone in pea seedling amine oxidase. J Biol Chem. 1993;268:17680–17682. [PubMed] [Google Scholar]
- 26.Dooley DM, Brown DE. Intramolecular electron transfer in the oxidation of amines by methylamine oxidase from Arthrobacter P1. J Biol Inorg Chem. 1996;1:205–209. [Google Scholar]
- 27.Ho RYN, Liebman JF, Valentine JS. Overview of the Energetics and Reactivity of Oxygen. In: Foote CS, Valentine JS, Greenberg A, Liebman JF, editors. Active Oxygen in Chemistry. Blackie Academic and Professional; New York: 1995. pp. 1–23. [Google Scholar]
- 28.Murthy NN, Karlin KD. In: Mechanistic Bioinorganic Chemistry. Thorp HH, Pecoraro VL, editors. American Chemical Society; Washington D.C.: 1995. pp. 165–193. [Google Scholar]
- 29.Karlin KD, Tyekl'ar Z. Bioinorganic Chemistry of Copper. Chapman and Hall; New York: 1993. [Google Scholar]
- 30.Whittaker JW. Oxygen reactions of the copper oxidases. Essays Biochem. 1999;34:155–172. doi: 10.1042/bse0340155. [DOI] [PubMed] [Google Scholar]
- 31.Medda R, Padiglia A, Bellelli A, Sarti P, Santanche S, Agro AF, Floris G. Intermediates in the catalytic cycle of lentil (Lens esculenta) seedling copper-containing amine oxidase. Biochem J. 1998;332:431–437. doi: 10.1042/bj3320431. [DOI] [PMC free article] [PubMed] [Google Scholar]
- 32.Padiglia A, Medda R, Bellelli A, Agostinelli E, Morpurgo L, Mondovi B, Finazzi-Agrò A, Floris G. The reductive and oxidative half-reaction and the role of copper ions in plant and mammalian copper-amine oxidases. Eur J Inorg Chem. 2001;1:35–42. [Google Scholar]
- 33.Kishishita S, Okajima T, Kim M, Yamaguchi H, Hirota S, Suzuki S, Kuroda S, Tanizawa K, Mure M. Role of copper ion in bacterial copper amine oxidase: Spectroscopic and crystallographic studies of metal-substituted enzymes. J Amer Chem Soc. 2003;125:1041–1055. doi: 10.1021/ja017899k. [DOI] [PubMed] [Google Scholar]
- 34.Mills SA, Klinman JP. Evidence against reduction of Cu2+ to Cu+ during dioxygen activation in a copper amine oxidase from yeast. J Amer Chem Soc. 2000;122:9897–9904. [Google Scholar]
- 35.Mills SA, Goto Y, Su QJ, Plastino J, Klinman JP. Mechanistic comparison of the cobalt-substituted and wild-type copper amine oxidase from Hansenula polymorpha. Biochemistry. 2002;41:10577–10584. doi: 10.1021/bi0200864. [DOI] [PubMed] [Google Scholar]
- 36.Schwartz B, Olgin AK, Klinman JP. The role of copper in topa quinone biogenesis and catalysis, as probed by azide inhibition of a copper amine oxidase from yeast. Biochemistry. 2001;40:2954–2963. doi: 10.1021/bi0021378. [DOI] [PubMed] [Google Scholar]
- 37.Su QJ, Klinman JP. Probing the mechanism of proton coupled electron transfer to dioxygen: The oxidative half-reaction of bovine serum amine oxidase. Biochemistry. 1998;37:12513–12525. doi: 10.1021/bi981103l. [DOI] [PubMed] [Google Scholar]
- 38.Mure M, Mills SA, Klinman JP. Catalytic mechanism of the topa quinone containing copper amine oxidases. Biochemistry. 2002;41:9269–9278. doi: 10.1021/bi020246b. [DOI] [PubMed] [Google Scholar]
- 39.Wilmot CM, Hajdu J, McPherson MJ, Knowles PF, Phillips SEV. Visualization of dioxygen bound to copper during enzyme catalysis. Science. 1999;286:1724–1728. doi: 10.1126/science.286.5445.1724. [DOI] [PubMed] [Google Scholar]
- 40.Brazeau BJ, Johnson BJ, Wilmot CM. Copper-containing amine oxidases. Biogenesis and catalysis; a structural perspective. Arch Biochem Biophys. 2004;428:22–31. doi: 10.1016/j.abb.2004.03.034. [DOI] [PubMed] [Google Scholar]
- 41.Hirota S, Iwamoto T, Kishishita S, Okajima T, Yamauchi O, Tanizawa K. Spectroscopic observation of intermediates formed during the oxidative half-reaction of copper/topa quinone-containing phenylethylamine oxidase. Biochemistry. 2001;40:15789–15796. doi: 10.1021/bi011631o. [DOI] [PubMed] [Google Scholar]
- 42.Juda GA, Bollinger JA, Dooley DM. Construction, overexpression, and purification of Arthrobacter globiformis amine oxidase - Strep-Tag II fusion protein. Protein Expression and Purification. 2001;22:455–461. doi: 10.1006/prep.2001.1468. [DOI] [PubMed] [Google Scholar]
- 43.Janes SM, Klinman JP. An investigation of bovine serum amine oxidase active site stoichiometry: Evidence for an aminotransferase mechanism involving two carbonyl cofactors per enzyme dimer. Biochemistry. 1991;30:4599–4605. doi: 10.1021/bi00232a034. [DOI] [PubMed] [Google Scholar]
- 44.Meites L, Meites T. Removal of oxygen from gas streams. Anal Chem. 1948;20:984–985. [Google Scholar]
- 45.Weiss R. The solubility of nitrogen, oxygen, and argon in water and seawater. Deep Sea Res. 1970;17:721–735. [Google Scholar]
- 46.Medda R, Padiglia A, Bellelli A, Pedersen JZ, Agro AF, Floris G. Cu(I)-semiquinone radical species in plant copper-amine oxidases. FEBS Lett. 1999;453:1–5. doi: 10.1016/s0014-5793(99)00675-4. [DOI] [PubMed] [Google Scholar]
- 47.Mure M, Klinman JP. Synthesis and spectroscopic characterization of model compounds for the active site cofactor in copper amine oxidases. J Am Chem Soc. 1993;115:7117–7127. [Google Scholar]
- 48.Shepard EM, Dooley DM. Intramolecular electron transfer rate between active-site copper and TPQ in Arthrobacter globiformis amine oxidase. J Biol Inorg Chem. 2006;11:1039–1048. doi: 10.1007/s00775-006-0153-2. [DOI] [PubMed] [Google Scholar]
- 49.Shepard EM, Juda GA, Ling KQ, Sayre LM, Dooley DM. Cyanide as a copper and quinone-directed inhibitor of amine oxidases from pea seedlings (Pisum sativum) and Arthrobacter globiformis: evidence for both copper coordination and cyanohydrin derivatization of the quinone cofactor. J Biol Inorg Chem. 2004;9:256–268. doi: 10.1007/s00775-004-0522-7. [DOI] [PubMed] [Google Scholar]
- 50.Chiu YC, Okajima T, Murakawa T, Uchida M, Taki M, Hirota S, Kim M, Yamaguchi H, Kawano Y, Kamiya N, Kuroda S, Hayashi H, Yamamoto Y, Tanizawa K. Kinetic and structural studies on the catalytic role of the aspartic acid residue conserved in copper amine oxidase. Biochemistry. 2006;45:4105–4120. doi: 10.1021/bi052464l. [DOI] [PubMed] [Google Scholar]
- 51.Mukherjee A, Smirnov VV, Lanci MP, Brown DE, Shepard EM, Dooley DM, Roth JP. Inner-sphere mechanism for molecular oxygen reduction catalyzed by copper amine oxidases. J Am Chem Soc. 2008;130:9459–9473. doi: 10.1021/ja801378f. [DOI] [PMC free article] [PubMed] [Google Scholar]
- 52.Juda GA, Shepard EM, Elmore BO, Dooley DM. A comparative study of the binding and inhibition of four copper containing amine oxidases by azide: Implications for the role of copper during the oxidative half-reaction. Biochemistry. 2006;45:8788–8800. doi: 10.1021/bi060481k. [DOI] [PubMed] [Google Scholar]
- 53.Mure M, Klinman JP. Model studies of topaquinone-dependent amine oxidases. Characterization of reaction intermediates and mechanism. J Am Chem Soc. 1995;117:8707–8718. [Google Scholar]
Associated Data
This section collects any data citations, data availability statements, or supplementary materials included in this article.