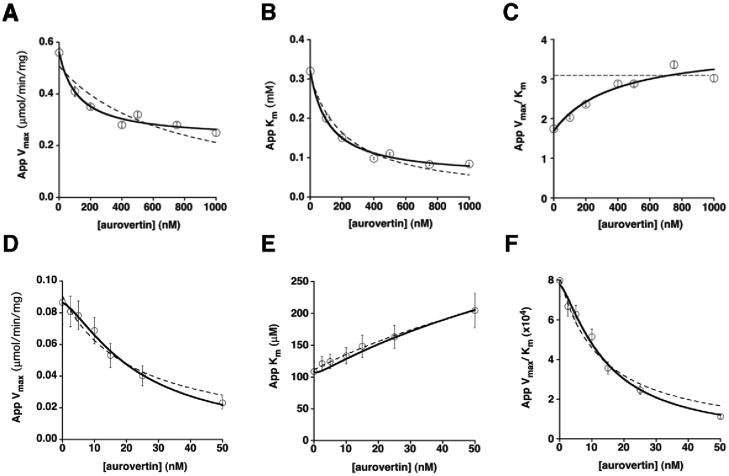
Figure 1.
Aurovertin inhibition of the F1Fo-ATPase in bovine SMPs. ATP hydrolysis: Aurovertin decreases both the apparent Vmax (A) and Km (B), and increases the apparent Vmax/Km (C). The plots of the kinetic parameters in panels A, B, and C were fit using either eq 1 for a purely uncompetitive inhibitor (dotted lines) or eq 2–4 for a mixed inhibitor with residual activity of the enzyme-substrate-inhibitor (ESI) complex (solid lines), as described in Materials and Methods. Fits shown are with all n values set equal to 1. ATP synthesis: Aurovertin decreases both the apparent Vmax (D) and Vmax/Km (F), and increases the apparent Km (E). The Vmax and Vmax/Km plots were fit using eq 1 and the plot of Km was fit using eq 3, consistent with mixed inhibition. The fits are shown with n(E) and n(ES) both set equal to 1 (dotted lines), and with n(E) = 2, n(ES) = 1 (solid lines).

