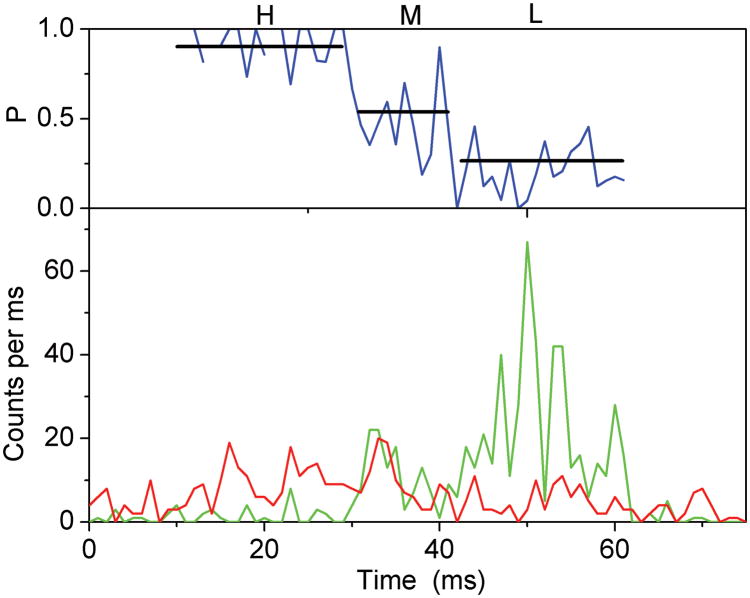
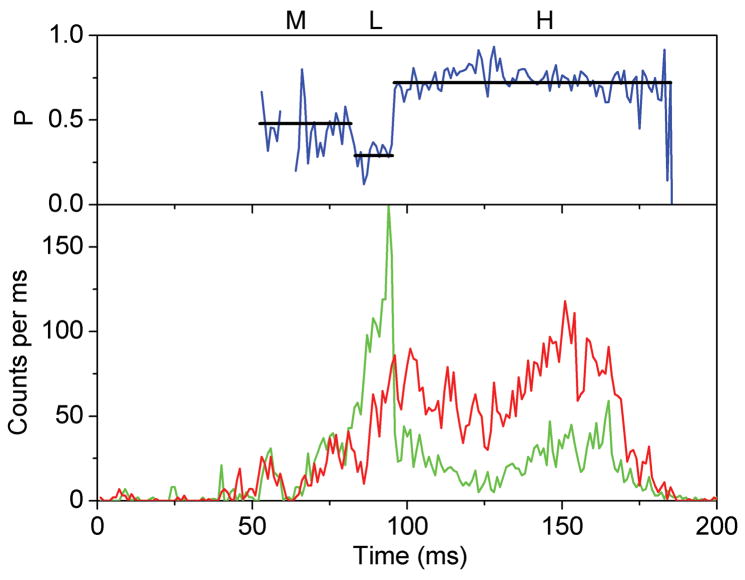
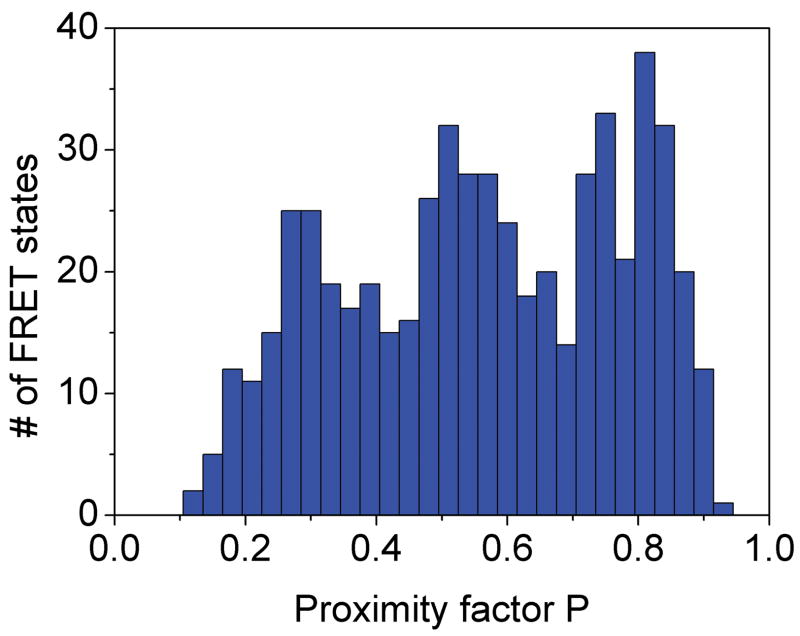
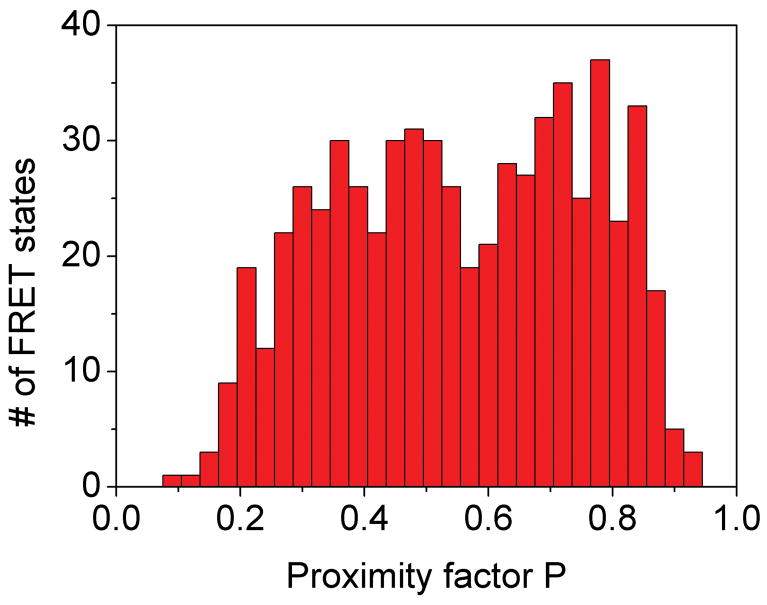
Figure 4.
Photon bursts and proximity factor distributions of single FRET-labeled F1Fo-ATPases from E. coli in liposomes in the presence of 1 mM ATP (A) and 1 mM ATP with 20 μM aurovertin (B). The F1Fo-ATPase was labeled with rhodamine 110 at the rotating γ subunit and with Cy5-bismaleimide crosslinking the static b2 subunits. Background-corrected fluorescence time trajectories of FRET donor (ID, green) and acceptor (IA, red) are shown in the lower panel and the corresponding proximity factor P=IA/(ID+IA) as blue trace in the upper panel. The sequential transitions of three proximity factor levels within the burst indicate stepwise rotation of γ. The intermediate FRET level (M) in the absence of aurovertin has a dwell time of 10 ms (A). The intermediate FRET level (L) in the presence of aurovertin has a dwell time of 15 ms (B). (C, D) Distribution of proximity factors of FRET-labeled F1Fo-ATPases upon ATP hydrolysis. (C) Distribution of FRET levels of rotating F1Fo-ATPase in the presence of 1 mM ATP showing three or more levels within single photon bursts (556 levels in total). (D) Distribution of FRET levels in the presence of ATP plus 20 μM aurovertin (617 levels in total). Thresholds of minimal FRET level dwells of 10 ms, minimal mean photon count rates of 5 counts per ms, maximal peak intensities of 150 counts per ms, and fluctuations of the proximity factor P of less than 0.15 in each FRET level were applied.


