Abstract
Molecular dynamics computer simulations have been carried out on aqueous solutions of glucose at concentrations bracketing those previously measured with quasi-elastic neutron scattering (QENS), in order to investigate the motions and interactions of the sugar and water molecules. In addition, QENS measurements have been carried out on fructose solutions to determine whether the effects previously observed for glucose apply to monosaccharide solutions. The simulations indicate a dynamical analog between higher solute concentration and lower temperature that could provide a key explanation of the bioprotective phenomena observed in many living organisms. The experimental results on fructose solutions show qualitatively similar behavior to the glucose solutions. The dynamics of the water molecules are essentially the same, while the translational diffusion of the sugar molecules is slightly faster in the fructose solutions.
Keywords: monosaccharide, water, dynamics, neutron scattering, molecular dynamics
I. Introduction
Osmotic dehydration is a well-known process based on the immersion of fresh products such as fruits into a concentrated sugar or salt solutions.1,2 The osmotic pressure difference between the fruit and the solution leads to partial removal of water from the plant tissues and migration of the osmotic solutes back into the fruit. Among currently used osmotic media, solutions of the monosaccharides glucose and fructose are particularly efficient in water replacement and preservation of fruit structures. In a similar mechanism, many living organisms use mono- and disaccharides, either produced internally or accumulated in their tissues, to protect themselves against severe climates.3,4,5,6,7 These examples illustrate the important role that hydrated sugars play in biological processes.
Carbohydrates have complicated structures, including overlapping polar and apolar groups, inter- and intramolecular hydrogen bonds, and a large number of hydroxyl groups, conferring a strong hydrophilic character. Thus, sugars exhibit a natural affinity for water, as shown by their high solubility. The collective structure of bulk water is even more complex, with its well-organized hydrogen bonded network and long list of unusual properties.8,9 Depending on their configurations and conformations, the structuring imposed on water by sugars can be more or less compatible with the hydrogen bond network of bulk water, in some cases leading to disruption of that network or changes in the sugar conformation due to the surrounding water molecules.10,11 The stereochemistry of sugars affects the physico-chemical properties of their solutions, as shown by the significant variations in density, glass transition temperature (Tg), viscosity and hydration number.12 The two hexoses - glucose and fructose - are particularly interesting because they constitute the most prominent monosaccharides occurring in living organisms. While glucose is an aldose, and fructose a ketose, it remains that their topologies are quite different. At equilibrium at room temperature, for example, glucose consists of a mixture of two six-membered ring forms α-d-glucopyranose (38%) and β-d-glucopyranose (62%), while fructose exhibits four topological configurations of its five- and six-membered rings: α-d-fructopyranose (2.3%), β-d-fructopyranose (72%), α-d-fructofuranose (5.2%) and β-d-fructofuranose (20%) (Fig. 1).13,14 These different morphologies lead to significant variations in the properties of their solutions such as density (1.1209 g.cm-3 for glucose vs. 1.1251 for fructose at 30 wt.%)12, solubility (0.08029 for glucose15 vs. 0.3750 for fructose16), and viscosity (3.46 mPa.s for glucose vs. 3.07 for fructose at 30 wt.%).17 It is therefore important to study the effects of stereochemistry on the dynamical properties of the aqueous solutions of these two monosaccharides.
Fig. 1.
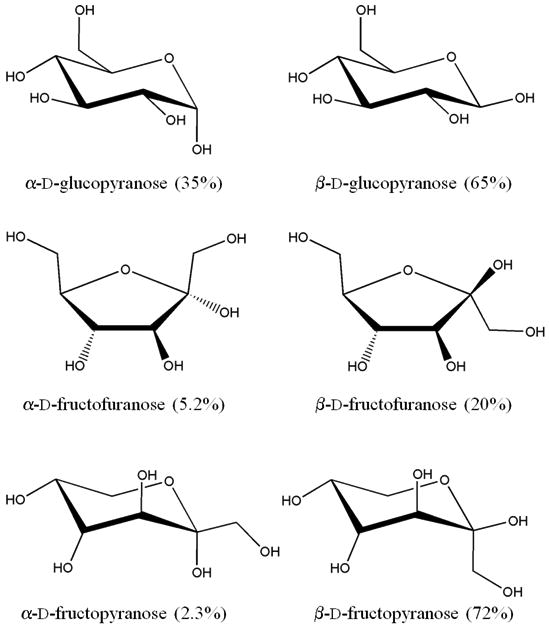
Stick representation of the different tautomers of d-glucose and d-fructose. The percentage values correspond to the relative abundance of each isomer at the tautomeric equilibrium.13,14
Recently, we reported quasielastic neutron scattering (QENS) measurements of the dynamics of both water and glucose molecules in dilute and concentrated solutions.18,19 A diffusive process with a relaxation time τ gave rise to a peak in the scattering function S(Q,E) centered at zero energy transfer E with a full width at half-maximum (FWHM) ΔE related to 1/τ. In the simple case of a purely exponential relaxation, S(Q,E) has a Lorentzian shape with ΔE = 2ħl2Q2/6τ, where l is a characteristic jump distance and Q is the scattering vector. Thus, QENS measurements carried out as a function of both E and Q give temporal and spatial information about the diffusive process. The relaxation time τR for rotational diffusion can also be extracted.
Recently, we found that the addition of glucose to the water caused a substantial slowing, by a factor of 10 for the translational diffusion and 3-4 for the rotational motion at the highest concentration studied, 1:11 C6H12O6:H2O.18 The glucose translational diffusion and the rotational motions slowed down considerably with a decrease in concentration: for example, the diffusion coefficient dropped by a factor of 5 in going from a 1:55 to a 1:11 concentration.19 More recently, we have studied the effects of confinement in silica gel on the dynamics of glucose and trehalose solutions.20,21
The present work has two objectives. First, numerical molecular dynamics (MD) simulations were carried out on glucose solutions, at concentrations bracketing those measured by QENS in order to investigate in detail the processes involved and to compare them with experiments. Secondly, the dynamics of aqueous solutions of fructose were measured by QENS to check the universality of the behavior observed in glucose solutions. Thus, we can obtain an insight into the role of the stereochemistry on the global dynamics.
II. Experimental
A. MD Computer Simulations
Classical MD simulations were carried out for glucose:H2O solutions with 1, 3 and 5 molal concentrations, respectively. These three simulations span the concentration range of the QENS measurements reported previously.18,19 The total numbers of the glucose anomers were chosen to be as close as possible to the tautomeric equilibrium values, with 36 α-glucose and 64 β-glucose molecules, and the box size was selected to match the experimental densities at the desired temperature. The simulation parameters are listed in Table 1. The water molecules were represented with the SPC/E model22 and the CSFF force field was employed for the glucose.23 Because quantitative estimates of the diffusional behavior were sought, all simulations were performed as microcanonical ensembles with the CHARMM program,24 using a time step of 1 fs and with the chemical bonds to the hydrogen atoms kept fixed with the SHAKE program.25 The van der Waals and electrostatic interactions were smoothly truncated on a neutral group basis using switching functions from 13 to 15 Å. The initial temperature of each glucose solution was set at a temperature of approximately 100 K by random selection of each of the Cartesian components of the velocity of each atom from a Maxwell-Boltzmann distribution, subject to the geometric constraints imposed by the SHAKE algorithm. All solutions were heated at the rate of 20 K/ps until they reached the desired simulation temperatures, 240, 260, 280, 300, 320 and 340 K, respectively. The simulations were then equilibrated for a period of 50 ps, during which time the velocities were periodically rescaled if the average temperature of the system deviated from the target temperature by more than ±3.0 K. This equilibration was then followed by an additional 2 ns trajectory without scaling which was used for analysis. The actual system temperature and total energy were monitored during this data collection period to assure temperature stability and energy conservation.
Table 1. Summary of the solutions and parameters used in the simulations.
| Molality | # glucose | # water | density | number density | box size |
|---|---|---|---|---|---|
| g/cm3 | at./Å3 | Å | |||
| 1 molal | 18 (6α, 12β) | 995 | 1.0615 | 0.1032 | 32.1527 |
| 3 molal | 36 (12α, 24β) | 667 | 1.1433 | 0.1066 | 29.9447 |
| 5 molal | 60 (20α, 40β) | 666 | 1.2063 | 0.1095 | 31.5474 |
B. Samples
Selective hydrogen:deuterium isotope substitution is a valuable tool for sorting out the dynamics of a complex organic system with neutron scattering. Since the total bound-atom cross section for H (81.7 b) is much larger than that of D (7.6 b) and most other elements, the measured intensity is dominated by the scattering from the H atoms. Thus, the water dynamics can be highlighted by measuring samples with deuterated sugar dissolved in H2O,18 and the sugar dynamics with samples with isotopically-natural sugar dissolved in D2O.19 Unfortunately, the experimental situation is complicated by the unavoidable exchange of 5 of the 12 hydrogen atoms of the glucose molecule by hydrogen from the solvent water so that, in the first of the two cases just described, some contribution to the scattering from the sugar molecules is inevitable. The problem is alleviated to some extent by the fact that the time scale of the solvent dynamics is about 5 times that of the solute dynamics.
In order to disentangle the dynamics of the solvent from that of the solute, three samples were prepared with the following characteristics (Table 2): (1) Pure H2O, as a reference point, (2) a solution of 7d-fructose (Sigma Aldrich, d-fructose, C6H5D7O6, deuterated at the C1, C2, C3, C4, C5 and twice at the C6 position) in H2O at a molar concentrations of 1:24.5 C6H5D7O6:H2O, corresponding to a concentration of 2.3 molal, or 29 wt.%, in a fully protonated solution, and (3) a solution of deuterated fructose in D2O at the same molar concentration. In the case of the sample 2, d-fructose was mixed with heavy water, dried and re-mixed with D2O to avoid deuteration of the water by exchangeable hydrogens.
Table 2. Characteristics of the different solutions.
| # | Name | Solution | Concentration | Probed Dynamics | ||
|---|---|---|---|---|---|---|
| wt. % | sugar:water | molality | ||||
| 1 | H2O | H2O | 0% | - | - | Water |
| 2 | d-fruc+H2O | Fructose:H2O | 29% | 1 C6H5D7O6 : 24.5 | 2.3 molal | Solvent |
| 3 | h-fruc+D2O | Fructose:D2O | 29% | 1 C6D5H7O6 : 24.5 | 2.3 molal | Solute |
C. QENS Experiments
The QENS experiments on the fructose solutions were carried out on the IRIS Backscattering Spectrometer26 at the ISIS pulsed spallation source at the Rutherford-Appleton Laboratory, Chilton, UK, at an incident wavelength of 6.7 Å. The samples were loaded into aluminum annular cans with an annular distance of 0.5 mm (0.1 mm in the case of the H2O and d-fruc+H2O samples) and placed within the radiation shield of a closed-cycle refrigerator, in which the temperature could be controlled to ±1 K. The Q range was 0.46-1.84 Å-1 and runs of approximately 4 h were made at temperatures of 280, 300 and 320 K. With PG002 analyzers, the measured energy resolution was 17.5 μeV FWHM and the energy transfer window was ± 400 μeV, giving a dynamic range of 2 - 75 ps. The MODES suite of programs was used to derive the scattering functions S(Q,E).27
Following our previous work,18,19,20,21 the resolution-corrected scattering functions were fitted by the expression:
| (1) |
where  (Wn, E) denotes a Lorentzian function with unit area and a FWHM of Wn, and the linear background terms allow for a slowly varying inelastic scattering component. The Q dependence of Wn was least-squares-fitted by the following expressions:
| (2a) |
| (2b) |
In the spirit of the TBCD model,28 the parameters αi and βi have the following significance:
| (3a) |
| (3b) |
where D is the translational diffusion constant and l an effective jump distance, and
| (3c) |
where τR is a relaxation time for orientational diffusion, while β2 has two compensating components, one identified with 2ħD and the other reflecting the increasing contribution of higher-order rotational terms as Q increases. The constant α1 in Eq. (2a) is zero in the TBCD model but we allow it to take small non-zero values to allow for small differences between the true resolution function and the vanadium standard and, in the case of the d-fruc+H2O measurements, a possible contribution from the slower dynamics of the sugar molecules.
III. Results and discussion
A. MD Simulations
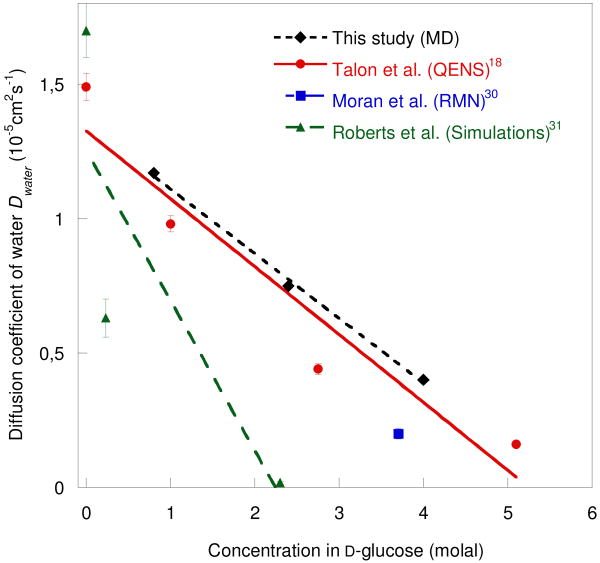
Water and sugar self-diffusion coefficients, Dwater and Dglucose, were obtained from the mean-square displacements as a function of time by using the Debye-Einstein relation.29 The diffusion constants of water obtained at the different concentrations are compared with previous NMR and QENS data in Fig. 2. The most obvious result is a strong reduction in the diffusion rate as the glucose concentration is increased. The MD results are considerably closer to the QENS values of Talón et al.18 and to the 2H NMR results of Moran et al.30 than the earlier MD simulations of Roberts et al.31 There are two probable reasons for this difference. First, the SPC/E model for water used in this study is known to give a more realistic diffusion coefficient (2.49 ± 0.05.105 cm2s-1) than the SPC model used by Sonoda et al.32, which gives a value a factor ∼ 1.5 too high.33 Secondly, while in the present study the values for the densities used in the simulations are taken from the experimental data in the literature,34,35,36 Roberts et al.31 used values for the concentrated solutions somewhat higher.
Fig. 2.
Diffusion coefficient of water molecules in glucose solutions at 280K obtained in this study, together with experimental and simulation values results in the literature.18,30,31 The solid lines represent linear fits.
Concentration and temperature dependence
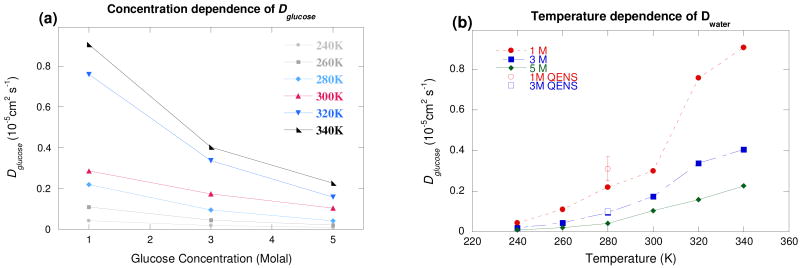
The temperature and concentration dependence of the diffusion constants of water and sugar are shown in Fig. 3 and 4, respectively. It can be seen that there is good agreement between the numerical and experimental values.18,19 (Fig. 3b and 4b) The numerical value for Dwater at 280 K decreases by a factor of 1.6 between 1 and 3 molal, reasonably consistent with the experimental factor of 2.2.18 This factor remains almost constant (1.4-1.6) over the entire temperature range investigated, indicating that the activation energy is almost constant between 1 and 3 molal, a trend also observed in the QENS18 and dielectric spectroscopy measurements.37 However, the absolute values remain higher than the experimental ones, which could be slightly underestimated since a low percentage of the total scattering comes from the solute. On the other hand, the simulation value of Dglucose at 280 K decreases by a factor of ∼2.5 between 1 and 3 molal and by a factor of ∼5.5 between 1 and 5 molal, consistent with the experimental values of ∼2.1 and ∼5.6.19 Nevertheless, the simulations reproduce the general trends for both solvent and solute molecules. The change in the dynamical regime of both types of molecules around 3 molal (Figs. 3 and 4) corresponds to the appearance of solute-solute interactions, as observed by near infrared spectroscopy (NIR),38 by QENS on fructose solutions,39 and in the earlier simulations of glucose solutions.31 The solvation of glucose molecules leads to a disruption of the local water hydrogen bond (H-bond) network by a steric effect in favor of new H bonds between the sugar and water molecules. The solute has a very localized influence on the water H-bond network, as shown by the relatively small decrease in Dwater between 0 and 1 molal. Around 3 molal,38 the appearance of sugar-sugar H bonds leads to the formation of localized sugar clusters, considerably modifying the water H-bond network. When the sugar concentration is further increased, the decrease in the number of water-water H bonds in favor of both sugar-water and sugar-sugar H bonds leads to a drastic change in the behavior of the water molecules, particularly a general slowing down of the translational dynamics, as observed in NMR,30 QENS,18 and NIR measurements38 and in MD simulations.40,41
Fig. 3.
Water diffusion constant in glucose solutions from MD simulations (a) as a function of glucose concentration and (b) as a function of temperature. The QENS values shown are extracted from the work of Talón et al.18 The solid lines in Fig. 3(a) represent linear fits whereas those in Fig. 3(b) are a guide for the eyes.
Fig. 4.
Glucose diffusion constant from MD simulations (a) as a function of concentration and (b) as a function of temperature. The QENS experimental values shown in Fig. 4(b) are extracted from this work. The solid lines are a guide for the eyes.
Concentration-temperature analogy
An especially interesting feature is the equivalence of different solutions from a dynamical point of view in the concentration/temperature diagram. The Fig. 5 highlights some similarities found in the translational diffusion coefficients of both glucose and water molecules obtained from the simulations. It appears that an increase in the glucose concentration is equivalent to a decrease in temperature. For example, if we consider a 3 molal sugar solution at 280 K, we find that a decrease in temperature by 20 K or an increase in concentration by 2 molal has the same effect for both solute and solvent molecules. An analogy has been made between the effects of certain solutes on the local structure of the water and those of temperature or pressure on the connectivity of the water network: d-glucose in dilute system is equivalent to a decrease in temperature, i.e. to an increase of the ordering. Talón et al. (QENS),18 Giangiacomo (NIR),38 and Paolantoni et al. (Raman)42 found similar analogies that support this interpretation. This trend has been observed experimentally for both monosaccharide14 and disaccharide solutions.43 At higher temperatures, above 320 K, the temperature/concentration analogy seems to break down, consistent with the known decrease with temperature of hydrogen bonding in pure liquid water, so that it seems to be valid only in a restricted window of the concentration/temperature diagram.
Fig. 5.
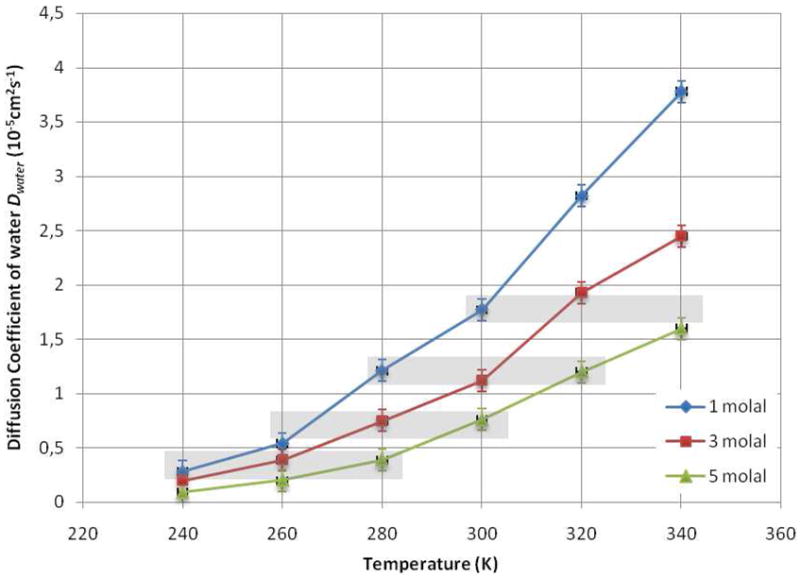
Evolution of the MD diffusion constants obtained from the MD simulations for solutions of 1, 3 and 5 molal. The grey rectangles show the dynamical analogies existing between the different solutions in the composition / temperature diagram.
B. QENS Experiments
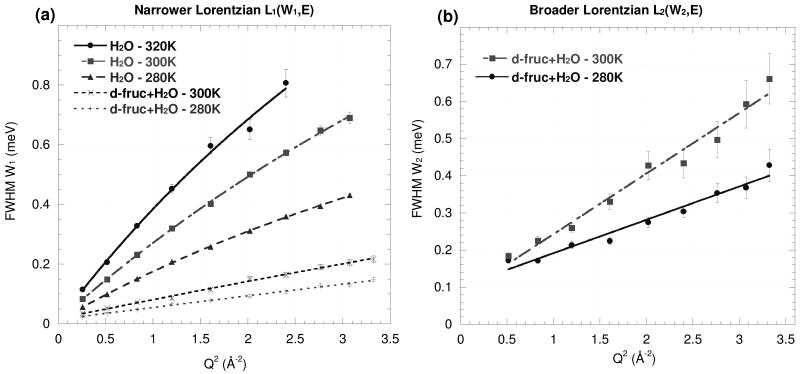
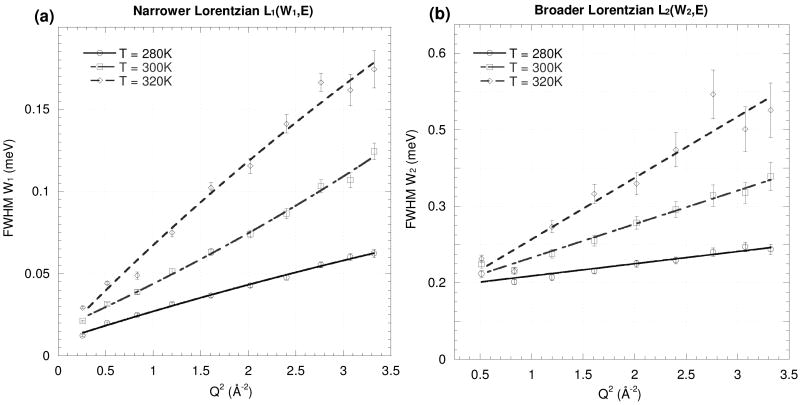
Fits of Eq. (2) to the IRIS measurements on the H2O and d-fruc+H2O samples are shown in Fig. 6, and those for h-fruc+D2O on the Fig.7. The values derived for D, l and τR from Eq. (3) for the dynamics of the solvent and solute molecules are given in Table 3.
Fig. 6.
FWHM of (a) the narrower Lorentzian W1 and (b) the broader Lorentzian W2 fitted to the QENS spectra at different values of Q for the water and d-fruc+H2O at 280, 300 and 320K. The lines represent fits of Eq. (2).
Fig. 7.
FWHM of the narrower Lorentzian W1 (a) and of the broader Lorentzian W2 (b) fitted to the QENS spectra at different values of Q for the h-fruc+D2O sample measured at 280, 300 and 320K. The lines represent fits of Eq. (2).
Table 3.
Diffusion constants of the water molecules Dwater (H2O and d-fruc+H2O) and of the fructose molecules Dfructose (h-fruc+D2O), effective jump distance l and relaxation time for orientational diffusion τR calculated from the fits of Eq. (3). These results (bold) are compared to previous ones (italic) obtained for glucose solutions at 280 K.18,19 (Water dynamics: d-gluc+ H2O / Solute dynamics: h-gluc+ D2O)
| Sample | Temperature (K) |
D (10-5 cm2 s-1) |
l (Å) |
τR (ps) |
|
|---|---|---|---|---|---|
| This work | H2O | 280 | 1.4 ± 0.04 | 0.81 ± 0.01 | - |
| 300 | 2.13 ± 0.08 | 0.73 ± 0.04 | - | ||
| 320 | 3.3 ± 0.6 | 0.9 ± 0.3 | - | ||
| d-fruc+H2O, 1:24.5 | 280 | 0.3 ± 0.04 | 0.2 ± 0.5 | 4.3 ± 0.4 | |
| 300 | 0.49 ± 0.05 | 0.4 ± 0.3 | 4.2 ± 0.8 | ||
| h-fruc+D2O, 1:24.5 | 280 | 0.14 ± 0.01 | 0.5 ± 0.2 | 3.2 ± 0.1 | |
| 300 | 0.24 ± 0.02 | 0.4 ± 0.3 | 3.4 ± 0.2 | ||
| 320 | 0.45 ± 0.08 | 0.6 ± 0.3 | 3.2 ± 0.4 | ||
| Talon et al.18 | d-gluc+H2O, 1:55 | 280 | 0.98 ± 0.03 | - | - |
| d-gluc+H2O, 1:20 | 280 | 0.44 ± 0.02 | - | - | |
| Smith et al.19 | h-gluc+D2O, 1:55 | 280 | 0.252 ± 0.002 | 0.2 | - |
| h-gluc+D2O, 1:20 | 280 | 0.123 ± 0.002 | 1.4 | - | |
Dynamics of pure water
The activation energy for translational diffusion of pure water obtained from the temperature dependence is 4.0 ± 0.4 kcal.mol-1, similar to that obtained earlier for the 1:20 glucose solution (3.8 ± 0.4 kcal.mol-1).18 For comparison, Teixeira et al.28 reported D = 1.34×10⁻⁵ cm2s-1 and an activation energy of 3.6 kcal.mol-1, in good agreement with our values.
Dynamics of monosaccharide molecules in solution
The value of Dfructose in a 2.3 molal solution is similar to that of β-furanose (0.095×10⁻⁵ cm2s-1) and β-pyranose (0.092×10⁻⁵ cm2s-1), measured at 277 K by PFG-NMR.14 Our value, Dfructose = 0.14×10⁻⁵ cm2s-1, has the same order of magnitude as that observed for glucose19 but is slightly higher. This behavior can be explained by (1) the remarkably low viscosity value of fructose solutions compared with other monosaccharides,44,45 (2) the difference in the number of tautomers (2 for the glucose vs. 4 for the fructose – cf. Fig. 1)13,32, and (3) the slightly higher hydrophobicity of the fructose, especially in the β-d-fructopyranose form in which two hydrogens atoms are bonded on the C1 carbon.45 Thus, the fructose tends to disrupt the H-bond network of the water more than the glucose. The orientational relaxation time of fructose, τR = 3.4 ps, is almost constant over the whole temperature range investigated, implying a very low activation energy.
Dynamics of water molecules in solution
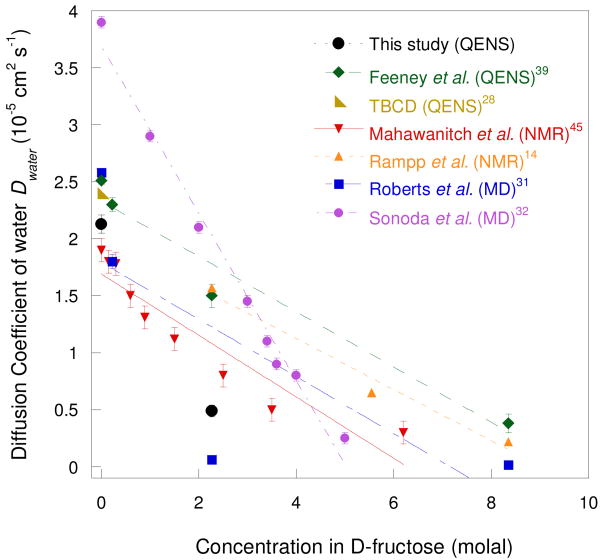
The values of Dwater extracted from the IRIS measurement are compared in Fig. 8 with earlier experimental and numerical results.14,28,31,32,39,45 Both sets are in good agreement with the 1H NMR results of Mahawanich et al.45 but slightly lower than those measured by QENS by Feeney et al.39 and by NMR by Rampp et al.14 on solutions of fully protonated fructose in water. Nevertheless, the global trend of the concentration dependence is similar in the two cases. The earlier simulations31,32 are not in good agreement with the experimental results except for the lower concentration studied by Roberts et al.31.
Fig. 8.
Diffusion coefficient of water molecules in fructose solutions at 300K obtained in this study, together with experimental and simulation results in the literature.
At 280 K and 2.3 molal, the values of Dwater measured in the fructose solution is 40% lower than in the corresponding glucose solution,18 while the orientational relaxation time τR of water, 4.3 ps, is longer than in glucose (τR = 1.4 ps). A similar reduction (∼ 50%) is obtained when we compare with the numerical values that we calculate. Water molecules are then less mobile in fructose solutions as indicated by the lower values of Dwater and the relatively small jump distance l, showing that the solvent molecules are more localized in the fructose solutions than in the glucose. It gives then an indication of the extent of the H-bonds occurring in these two monosaccharide solutions.
IV. Conclusions
In contrast to previous simulations,31,32 the results of MD simulations on glucose solutions are in excellent agreement with experimental results18,19,30 over the whole range of sugar concentrations studied. They indicate a dynamical analogy between higher solute concentrations and lower temperatures. The dehydration process thus leads to a physico-chemical state equivalent to higher temperature. While this hypothesis seems to be validated by the few experimental results in the literature, a complete systematic study over a wide range of concentration and temperature for several mono- and disaccharides is needed. If confirmed, this concentration-temperature analogy could provide a key explanation of the bioprotective phenomena observed in many living organisms.3,4,46
The experimental results on fructose solutions show a qualitative similarity in behavior with the glucose solutions. First, the dynamics of the water molecules are almost the same, showing that for these relatively low concentrations the different topologies and molecular sizes of two monosaccharides do not make a significant difference in the dynamical properties of the water molecules. However, the translational diffusion of the fructose molecules is slightly faster than that of the glucose.
Acknowledgments
GL is indebted to the Region Centre for a SOLEIL scholarship. This work was supported by grant GM63018 from the US National Institutes of Health in US, and the Centre National de la Recherche Scientifique in France. The authors acknowledge the support of the CCLRC in providing the neutron research facilities for this work. Experiments at the ISIS Pulsed Neutron and Muon Source were supported by a beamtime allocation from the Science and Technology Facilities Council.
References
- 1.Chenlo F, Moreira R, Fernández-Herrero C, Vázquez G. J Food Eng. 2006;74:324. [Google Scholar]
- 2.Rodrigues S, Fernandes FAN. J Food Eng. 2007;80:678. [Google Scholar]
- 3.Watanabe M. Appl Entomol Zool. 2006;41(1):15. [Google Scholar]
- 4.Wolfe J, Bryant G. Cryobiology. 1999;39:103. doi: 10.1006/cryo.1999.2195. [DOI] [PubMed] [Google Scholar]
- 5.Kasuga J, Arakawa K, Fujikawa S. New Phytologist. 2007;174:569. doi: 10.1111/j.1469-8137.2007.02025.x. [DOI] [PubMed] [Google Scholar]
- 6.Dashnau JL, Vanderkooi JM. J Food Sci. 2007;72(1):R1. doi: 10.1111/j.1750-3841.2006.00242.x. [DOI] [PubMed] [Google Scholar]
- 7.Chiantia S, Kahya N, Schwille P. Langmuir. 2005;21:6317. doi: 10.1021/la050115m. [DOI] [PubMed] [Google Scholar]
- 8.Eisenberg D, Kauzmann W. The Structure and Properties of Water. Oxford University Press; Oxford: 1969. [Google Scholar]
- 9.Stillinger FH. Science. 1980;209:451. doi: 10.1126/science.209.4455.451. [DOI] [PubMed] [Google Scholar]
- 10.Ueda K, Brady JW. Biopolymers. 1996;38(4):461. doi: 10.1002/(sici)1097-0282(199604)38:4<461::aid-bip3>3.0.co;2-r. [DOI] [PubMed] [Google Scholar]
- 11.Naidoo KJ, Brady JW. J Am Chem Soc. 1999;121(10):2244. [Google Scholar]
- 12.Gharsallaoui A, Rogé B, Génotelle J, Mathlouthi M. Food Chem. 2008;106:1443. [Google Scholar]
- 13.Fuchs K, Kaatze U. J Phys Chem B. 2001;105:2036. [Google Scholar]
- 14.Rampp M, Buttersack C, Lüdermann HD. Carbohydrate Res. 2000;328:561. doi: 10.1016/s0008-6215(00)00141-5. [DOI] [PubMed] [Google Scholar]
- 15.Gray MC, Converse AO, Wyman CE. Appl Biochem & Biotech. 2003;105-108:179. doi: 10.1385/abab:105:1-3:179. [DOI] [PubMed] [Google Scholar]
- 16.Cockman M, Kubler DG. J Carbohydrate Chem. 1987;6(2):181. [Google Scholar]
- 17.Migliori M, Gabriele D, Di Sanzo R, de Cindio B, Correra S. J Chem Eng Data. 2007;52:1347. [Google Scholar]
- 18.Talón C, Smith LJ, Brady JW, Lewis BA, Copley JRD, Price DL, Saboungi ML. J Phys Chem B. 2004;108:5120. [Google Scholar]
- 19.Smith LJ, Price DL, Chowdhuri Z, Brady JW, Saboungi ML. J Chem Phys. 2001;120:3527. doi: 10.1063/1.1648302. [DOI] [PubMed] [Google Scholar]
- 20.Lelong G, Price DL, Douy A, Kline S, Brady JW, Saboungi ML. J Chem Phys. 2005;122:164504. doi: 10.1063/1.1884989. [DOI] [PubMed] [Google Scholar]
- 21.Lelong G, Price DL, Brady JW, Saboungi ML. J Chem Phys. 2007;127:065102. doi: 10.1063/1.2753841. [DOI] [PubMed] [Google Scholar]
- 22.Berendsen HJC, Grigera JR, Straastsma TP. J Phys Chem. 1987;91:6269. [Google Scholar]
- 23.Neria E, Fischer S, Karplus M. J Chem Phys. 1996;105(5):1902. [Google Scholar]
- 24.Brooks BR, Bruccoleri RE, Olafson BD, Swaminathan S, Karplus MJ. J Comput Chem. 1983;4:187. [Google Scholar]
- 25.van Gunsteren WF, Berendsen HJC. Mol Phys. 1977;34:1311. [Google Scholar]
- 26.Adams MA, Howells WS, Telling MTH. Rutherford-Appleton Laboratory Technical Report RAL-TR-2001-002. 2001. [Google Scholar]
- 27.Telling MTH, Howells WS. MODES Manual. ISIS Facility Rutherford-Appleton Laboratory; 2003. unpublished. [Google Scholar]
- 28.Teixeira J, Bellissent-Funel MC, Chen SH, Dianoux AJ. Phys Rev A. 1985;31:1913. doi: 10.1103/physreva.31.1913. [DOI] [PubMed] [Google Scholar]
- 29.Allen MP, Tildesley DJ. Computer Simulation of Liquids. Chapter 2. Oxford Science Publications; 1989. [Google Scholar]
- 30.Moran GR, Jeffrey KR, Thomas JM, Stevens JR. Carbohydrate Res. 2000;328:573. doi: 10.1016/s0008-6215(00)00125-7. [DOI] [PubMed] [Google Scholar]
- 31.Roberts CJ, Debenedetti PG. J Phys Chem B. 1999;103:7308. [Google Scholar]
- 32.Sonoda MT, Skaf MS. J Phys Chem B. 2007;111:11948. doi: 10.1021/jp0749120. [DOI] [PubMed] [Google Scholar]
- 33.Mahoney MW, Jorgensen WL. J Chem Phys. 2001;114(1):363. [Google Scholar]
- 34.Comesaña JF, Otero JJ, García E, Correa A. J Chem Eng Data. 2003;48:362. [Google Scholar]
- 35.Cerdeiriña CA, Carballo E, Tovar CA, Romaní L. J Chem Eng Data. 1997;42:124. [Google Scholar]
- 36.Ji P, Fei W, Tan T. J Chem Eng Data. 2007;52:135. [Google Scholar]
- 37.Jansson H, Bergman R, Swenson J. J Non-Cryst Solids. 2005;351:2858. [Google Scholar]
- 38.Giangiacomo R. Food Chem. 2006;96:371. [Google Scholar]
- 39.Feeney M, Brown C, Tsai A, Neumann D, Debenedetti PB. J Phys Chem B. 2001;105:7799. [Google Scholar]
- 40.Molinero V, Çagin T, Goddard WA., III Chem Phys Lett. 2003;377:469. [Google Scholar]
- 41.Lee SL, Debenedetti PG, Errington JR. J Chem Phys. 2005;122:204511. doi: 10.1063/1.1917745. [DOI] [PubMed] [Google Scholar]
- 42.Paolantoni M, Sassi P, Moressi A, Santini S. J Chem Phys. 2007;127:024504. doi: 10.1063/1.2748405. [DOI] [PubMed] [Google Scholar]
- 43.Affouard F, Bordat P, Descamps M, Lerbret A, Magazù S, Migliardo F, Ramirez-Cuesta AJ, Telling MFT. Chem Phys. 2005;317:258. [Google Scholar]
- 44.Mathlouthi M, Seuvre AM. J Chem Soc, Faraday Trans I. 1988;84(8):2641. [Google Scholar]
- 45.Mahawanich T, Schmidt SJ. Food Chem. 2004;84:169. [Google Scholar]
- 46.Scott P. Annals of Botany. 2000;85:159. [Google Scholar]


