Abstract
Communication between the cell surface and the nucleus is essential for regulated gene expression. In neurons, Ca2+-dependent gene transcription is sensitive to local Ca2+ entry. In immune cells, excitation-transcription coupling is thought to involve global Ca2+ signals. Here, we show that in mast cells, Ca2+ microdomains from store-operated Ca2+ release-activated Ca2+ channels activate expression of the transcription factor c-fos. Local Ca2+ entry is sensed by the tyrosine kinase Syk, which signals to the nucleus through the transcription factor STAT5. Ca2+ microdomains also promote secretion of proinflammatory messengers, which, like gene expression, requires Syk. Syk therefore couples Ca2+ microdomains to the activation of two spatially and temporally distinct cellular responses, revealing the versatility of local Ca2+ signals in driving cell activation.
Ca2+ is a universal intracellular messenger, which activates a wide array of important cellular responses, including secretion, mitochondrial metabolism, gene expression, and cell growth and differentiation (1). Because cells can respond to Ca2+ by generating more than one type of Ca2+-dependent response, a fundamental question concerns how specificity can occur to such a multifarious signal (2, 3). Growing evidence points to a major role for local Ca2+ signals in activating specific cellular targets (4). The simplest form of a local Ca2+ signal is a Ca2+ microdomain, which occurs following the opening of a Ca2+-permeable channel in either the plasma membrane or intracellular organelles (5). Because the volume a microdomain occupies is extremely small, the Ca2+ concentration can rise to reach levels that are orders of magnitude greater than the bulk cytoplasmic Ca2+ rise (3, 5).
Store-operated Ca2+ channels are the major route for agonist-evoked Ca2+ entry in non-excitable cells and open following stimulation of phospholipase C-coupled receptors (6). These receptors generate inositol 1,4,5-trisphosphate, which releases Ca2+ from the endoplasmic reticulum (ER)3 (7). The fall in Ca2+ content within the store is detected by the ER Ca2+ sensor STIM1, which migrates to specialized ER-plasma membrane junctions, where it opens the store-operated channels (8). The best characterized store-operated channel is the Ca2+ release-activated Ca2+ (CRAC) channel (6), the pore-forming subunit of which is composed of Orai1 (9–12). Ca2+ entry through CRAC channels regulates enzyme activity, secretion, gene expression, and cell growth and proliferation (13).
Here, we have examined whether excitation-transcription coupling is driven by Ca2+ microdomains arising from open CRAC channels in mast cells. In T cells, NFAT-dependent gene expression requires a global Ca2+ rise (14–16). We find that local Ca2+ influx signals to the nucleus much more effectively than a robust bulk Ca2+ rise. This leads to the expression of the transcription factor c-fos, a regulator of proinflammatory gene expression (17). Furthermore, the non-receptor tyrosine kinase Syk clusters at the cell periphery and couples Ca2+ microdomains to c-fos expression through recruitment of the cytoplasmic transcription factor STAT5 in a protein kinase C- and MEK/ERK-independent pathway. Ca2+ microdomains following CRAC channel activation also activate Ca2+-dependent phospholipase A2, followed by secretion of cysteinyl leukotrienes (18). However, unlike c-fos expression, this is mediated via the MEK/ERK pathway. Parallel processing of the Ca2+ microdomain by Syk through two distinct signaling pathways constitutes a novel mechanism to evoke spatially and temporally different cellular responses.
EXPERIMENTAL PROCEDURES
Cell Culture
Rat basophilic leukemia-1 (RBL-1), an immortalized mast cell line, was bought from ATCC. Cells were cultured (37 °C, 5% CO2) in Dulbecco's modified Eagle's medium with 10% fetal bovine serum, 2 mm l-glutamine, and penicillin/streptomycin, as described previously (19). For Ca2+ imaging and patch clamp experiments, cells were passaged (using trypsin) onto glass coverslips and used 24–48 h after plating. All cells were used between passages 4 and 16.
Ca2+ Imaging
Ca2+ imaging experiments were carried out using the IMAGO CCD camera-based system from TILL Photonics, as described previously using Fura 5F (loaded in the AM form) (18). Cells were alternately excited at 356 and 380 nm (20-ms exposures; 0.5 Hz) using a polychrome monochromator. Images were analyzed offline using IGOR Pro. Cells were loaded with Fura 5F-AM (2 μm) for 40 min at room temperature in the dark and then washed in a standard external solution of 145 mm NaCl, 2.8 mm KCl, 2 mm CaCl2, 2 mm MgCl2, 10 mm d-glucose, 10 mm HEPES, pH 7.4, with NaOH. Ca2+ signals are presented as the ratio 356 nm/380 nm, except in Fig. 1A, which gives calculated Ca2+. In some experiments, the cytoplasm was loaded with EGTA or BAPTA through the AM derivative. Loading was exactly as described previously (21).
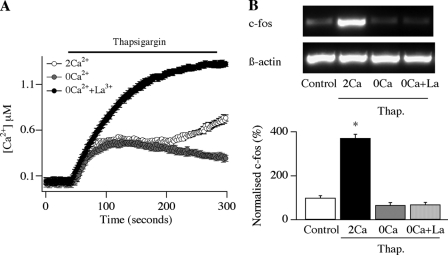
FIGURE 1.
Local Ca2+ entry activates c-fos expression. A, Ca2+ signals evoked by thapsigargin (2 μm) are shown for the various conditions. B, gene expression evoked by thapsigargin (Thap.) is compared in 2 Ca2+, 0 Ca2+, and 0 Ca2+ plus La3+. Top panel, typical gel; bottom panel, aggregate data from four experiments. The only stimulation protocol that differed from the control (non-stimulated) state was thapsigargin in 2 mm Ca2+ (p < 0.01, ANOVA). c-fos expression has been normalized to the control level.
Reverse Transcription-PCR
Reverse transcription-PCR of c-fos expression was carried out as reported (20). Cells were stimulated with thapsigargin in 2 mm external Ca2+ for 4 min, perfused with thapsigargin and Ca2+-free solution (containing 0.1 mm EGTA) for 41 min, and then RNA-extracted.
Western Blotting
All Western blots were carried out as reported (20). ERK2 expression was measured in order to normalize phosphorylated ERK expression to the number of cells used per gel lane. STAT5 was likewise used to normalize phosphorylated STAT5. The antibodies used to recognize STAT5 and phopshorylated STAT5 were from Cell Signaling. Syk antibody was from Abcam.
Patch Clamp
Whole cell patch clamp experiments and all recording solutions were as described (18). Sylgard-coated, fire-polished patch pipettes were filled with a solution that contained 145 mm cesium glutamate, 8 mm NaCl, 1 mm MgCl2, 2 mm Mg-ATP, 10 mm HEPES, 10 mm EGTA, 2 μm thapsigargin, pH 7.2, with CsOH. Pipette resistance was ∼5 megaohms when placed in an external solution containing 145 mm NaCl, 2.8 mm KCl, 10 mm CsCl, 10 mm CaCl2, 2 mm MgCl2, 10 mm d-glucose, 10 mm HEPES, pH 7.4, with NaOH. A correction of +10 mV was applied for the subsequent liquid junction potential that arose from the glutamate-based pipette solutions. Ca2+ current through CRAC channels was followed by applying voltage ramps (at 0.5 Hz) spanning −100 to +100 mV in 50 ms from a holding potential of 0 mV. Current amplitudes were measured from the ramps at −80 mV and normalized to cell size by dividing the amplitude by cell capacitance. Currents were filtered using an 8-pole Bessel filter at 2.5 kHz and digitized at 100 μs.
Immunocytochemistry
Cells were fixed, and Syk distribution was identified using confocal microscopy as reported (18).
Transfection
RNAi to Syk (Invitrogen) and scrambled RNAi were transfected using the AMAXA system (21). The Syk construct was as follows (5′–3′): sense, CCCUCUGGCAGCUAGUGGAACAUUA; antisense, UAAUGUUCCACUAGCUGCCAGAGGG.
Statistics
Data obtained from independent measurements are presented as the mean ± S.E. Statistical analysis was carried out using Student's t test (when only two data sets were recorded) or ANOVA followed by a post hoc Newman-Keuls multiple comparison test. Differences were considered significant for p < 0.05.
RESULTS AND DISCUSSION
We previously found that activation of store-operated CRAC channels in mast cells triggered expression of the c-fos gene (20). To see whether such excitation-transcription coupling was driven by a local or global Ca2+ signal, we stimulated a population of RBL-1 cells (a mast cell line) with thapsigargin, a Ca2+ATPase inhibitor on the endoplasmic reticulum, which depletes the Ca2+ stores and thereby opens CRAC channels (6). Because the RBL-1 cell culture is a homogenous population and the cells respond to thapsigargin by generating Ca2+ signals with very similar kinetics, we were able to relate c-fos expression in cell populations to Ca2+ signals in individual cells. Stimulation with thapsigargin for 240 s in the absence of external Ca2+ produced a transient Ca2+ rise in Fura 5F-loaded cells (Fig. 1A), but the Ca2+ signal was not associated with any activation of c-fos expression (Fig. 1B, labeled 0Ca/thap.; aggregate data are summarized in the bottom panel; p > 0.5 when compared with control (non-stimulated) cells, ANOVA). On the other hand, stimulation with thapsigargin for the same time in the presence of 2 mm Ca2+, which results in Ca2+ influx through CRAC channels, elicited only a slightly larger Ca2+ rise (Fig. 1A), but this nevertheless evoked robust c-fos expression (Fig. 1B; *, p < 0.01 when compared with control (non-stimulated) cells, ANOVA). A major mechanism contributing to the decline of the Ca2+ signal in Ca2+-free external solution is the plasma membrane Ca2+ATPase pump (22). Block of this pump with La3+ increases the size and prolongs the duration of the Ca2+ signal in response to thapsigargin (applied in Ca2+-free solution (Fig. 1A) (18)). Despite this substantial increase in cytoplasmic Ca2+ concentration, no c-fos expression was induced (Fig. 1B). These results demonstrate that excitation-transcription coupling is driven by local Ca2+ influx through CRAC channels rather than a bulk Ca2+ rise. A major determinant of the size of a Ca2+ microdomain is the single channel current, which depends on the prevailing electrochemical gradient for Ca2+ entry (3, 5). We manipulated this gradient in two ways: first, we reduced the electrical driving force for Ca2+ entry by depolarizing the membrane potential. Second, we altered the concentration gradient for Ca2+ influx by varying the external Ca2+ concentration.
Fig. 2A summarizes the effects of membrane depolarization on the Ca2+ signal following exposure of cells to Cs+ and TEA+. These agents fully block the inwardly rectifying K+ current in RBL-1 cells (23), leading to a membrane depolarization from a resting potential of −80 to −40 mV (24). Over the 4-min exposure to thapsigargin, bulk Ca2+ was only slightly lower in depolarized cells (Fig. 2A). However, c-fos expression, following stimulation with thapsigargin for the same time period, was substantially reduced following membrane depolarization (Fig. 2B; *, p < 0.01 when thapsigargin was compared with thapsigargin/Cs+/TEA+, ANOVA). Stimulation with thapsigargin in 0.5 mm Ca2+ evoked a bulk Ca2+ signal that was very similar to that seen in 2 mm Ca2+ (Fig. 2C). However, c-fos expression was significantly lower when cells were challenged in 0.5 mm Ca2+ (*, p < 0.01 for 2 mm versus 0.5 mm Ca2+, ANOVA; Fig. 2D). Stimulation in the presence of a lower Ca2+ concentration (0.25 mm) resulted in a smaller bulk Ca2+ rise and only modest gene expression (Fig. 2, C and D). Collectively, these results reveal that maneuvers that alter local Ca2+ entry through CRAC channels but have little effect on the bulk Ca2+ rise impact strongly on c-fos expression.
FIGURE 2.
Changes in local Ca2+ influx impact upon c-fos expression. A, Ca2+ signals in response to 2 μm thapsigargin in 2 mm Ca2+ (normal) are compared with those seen in the presence of 10 mm Cs+ and 10 mm TEA+, to block inwardly rectifying K+ channels. B, c-fos expression was significantly reduced, compared with thapsigargin (Thap.) stimulation, when cells were stimulated with thapsigargin and Cs+/TEA+. Aggregate data from three independent experiments are shown in the bottom panel. Both thapsigargin groups were significantly different from the resting group and from each other (p < 0.01, ANOVA). C, Ca2+ signals following stimulation with thapsigargin in different external Ca2+ concentrations (0.25, 0.5, and 2 mm) are compared. D, c-fos expression is compared for the different conditions. Aggregate data from four independent experiments are depicted in the histogram. Data have been normalized to control (non-stimulated levels). Differences between each data set were significant (p < 0.01, ANOVA). There was a significant difference between thapsigargin/2 Ca2+ and thapsigargin/0.5 Ca2+ (p < 0.01, ANOVA).
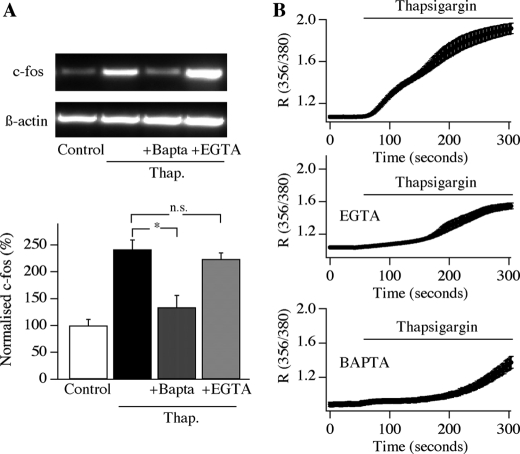
Consistent with this, we found that loading cells with the slow Ca2+ chelator EGTA failed to reduce gene expression following CRAC channel activation (Fig. 3A; *, p < 0.01 when thapsigargin and thapsigargin/EGTA groups were compared with the control (non-stimulated) group, ANOVA; p > 0.2 when thapsigargin was compared with thapsigargin/EGTA, ANOVA), despite substantially slowing the rate of development of the bulk Ca2+ signal (Fig. 3B) (see Ref. 18). Because EGTA is too slow to buffer incoming Ca2+ through Ca2+ channels, it does not impact local Ca2+ signals (3, 25). On the other hand, the fast Ca2+ chelator BAPTA can reduce the extent of Ca2+ microdomains (3, 5), and it impaired the ability of CRAC channels to trigger gene expression (Fig. 3A; p > 0.3 for thapsigargin and BAPTA group compared with the control (non-stimulated) group, ANOVA; p < 0.01 for thapsigargin/BAPTA versus thapsigargin/EGTA, ANOVA), despite reducing bulk Ca2+ to a similar extent as that seen in EGTA (Fig. 3B).
FIGURE 3.
Thapsigargin-evoked c-fos expression is blocked by cytoplasmic BAPTA but not EGTA. A, a typical gel is shown in the top panel, and aggregate data from four independent experiments is shown below. There was no significant difference between thapsigargin (Thap.) and thapsigargin/EGTA groups, but p was <0.01 between thapsigargin and thapsigargin/BAPTA (ANOVA). B, thapsigargin-evoked Ca2+ signals are compared between control cells, cells loaded with BAPTA, and cells loaded with EGTA (number of cells between 20 and 33). Error bars (S.E.) are included in each graph.
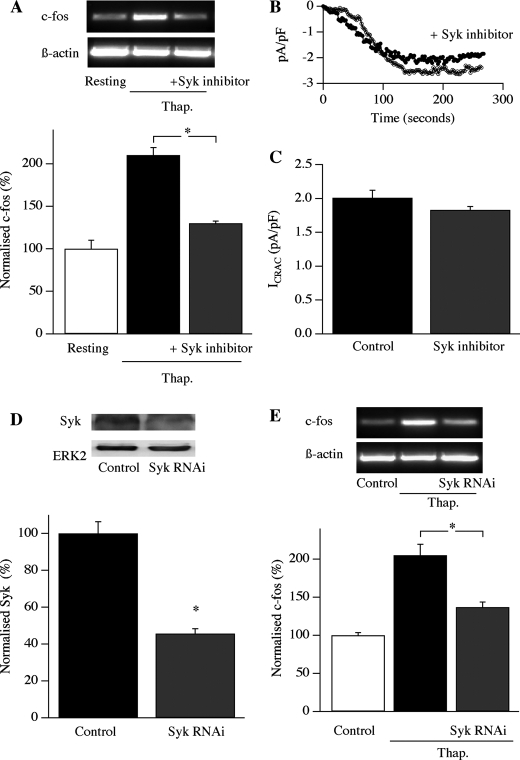
What senses this local Ca2+ entry? We recently found that the non-receptor tyrosine kinase Syk can be activated by Ca2+ microdomains arising from open CRAC channels (21), prompting us to consider whether it translates local Ca2+ entry into gene expression. We tested this possibility using two different approaches. First, we exposed cells acutely to the Syk inhibitor 3-(1-methyl-1H-indoyl-3-yl-methylene)-2-oxo2,3-dihydro-1H-indole-5-sulfonamide (10 μm for 10 min) and then stimulated cells with thapsigargin. c-fos expression was suppressed (Fig. 4A; aggregate data from four experiments are summarized in the bottom panel). There was no significant difference between the thapsigargin and Syk inhibitor group versus the control group (ANOVA), whereas thapsigargin versus control was significantly different (p < 0.01, ANOVA; the difference between thapsigargin versus thapsigargin/Syk was also significant, p < 0.01, ANOVA). Importantly, Ca2+ flux through CRAC channels was unaffected by the inhibitor (Fig. 4, B and C) as was the membrane potential, measured in current clamp recordings (−78 ± 3 mV control and −74 ± 5 mV after Syk inhibitor; data not shown). Hence, the loss of c-fos expression is not due to a change in the CRAC channels themselves nor to the driving force for Ca2+ influx. Second, we knocked down expression of Syk using an RNAi approach. Whereas Syk was clearly expressed in control cells (measured in Western blots; Fig. 4D), transfection with Syk RNAi reduced protein expression by ∼60% (Fig. 4D; *, p < 0.01, Student's t test). This was associated with a significant reduction in c-fos gene activation following stimulation with thapsigargin (Fig. 4E; aggregate data from four experiments are summarized in the bottom panel; *, p < 0.01 between control (non-stimulated) and thapsigargin groups, ANOVA; p < 0.01 between thapsigargin and thapsigargin/Syk RNAi groups, ANOVA). Collectively, these results reveal that Syk couples CRAC channel activity to nuclear events.
FIGURE 4.
Syk is involved in excitation-transcription coupling. A, top panel, c-fos expression in response to Syk is blocked by the Syk inhibitor. Bottom panel, aggregate data from four experiments are shown. p < 0.01 between thapsigargin (Thap.) and thapsigargin/Syk inhibitor group (ANOVA). B, time course of ICRAC in a control cell is compared with one pre-exposed to the Syk inhibitor. The patch pipette contained 10 mm EGTA to deplete the stores. C, aggregate data from experiments as in B are depicted (p > 0.3; number of cells was 7 for control and 8 for the Syk inhibitor). D, top panel, Syk expression, measured using Western blotting, is compared between wild type cells transfected with scrambled siRNA and cells transfected with siRNA against Syk. The bottom panel depicts aggregate data from three independent experiments for the two conditions; p < 0.01, Student's t test. E, Syk knockdown reduces c-fos expression. Top panel, a typical gel. Bottom panel, aggregate data from four independent experiments are shown. Thapsigargin and thapsigargin/Syk RNAi groups were both significantly different from the control group (p < 0.01 and p < 0.05, respectively) and significantly different from each other (*, p < 0.01, ANOVA). The thapsigargin group had been transfected with scrambled siRNA against Syk.
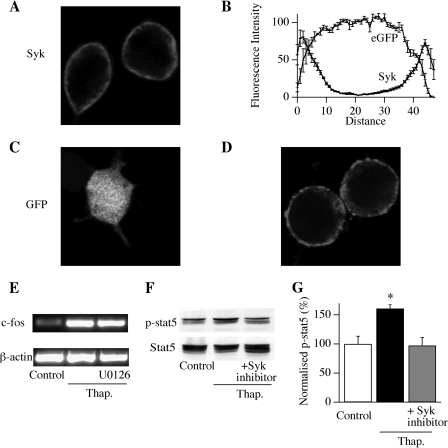
If Syk detects local Ca2+ entry, it should be located at the cell periphery. Immunocytochemical studies revealed that this was indeed the case (Fig. 5A). We plotted the lateral profile of Syk across the cell and found two peaks, corresponding to the two plasma membrane sections, with a substantial dip between them (reflecting bulk cytoplasm; Fig. 5B). Enhanced green fluorescence protein is widely used to measure the cytoplasmic distribution (26). In marked contrast to Syk, a relatively stable and elevated profile was found when the cytoplasmic profile of enhanced green fluorescence protein was analyzed in the same way (Fig. 5, B and C) with no peaks near the plasma membrane. Does Syk migrate to the nucleus after Ca2+ influx? To examine this possibility, we stimulated cells with thapsigargin and measured the spatial profile of Syk. Syk remained at the cell periphery with no detectable translocation into the cytoplasm (Fig. 5D). An intermediary signal is therefore needed to couple Syk to the nucleus. We tested for the involvement of a range of downstream cascades including protein kinase C, calmodulin, calcineurin, MEK/ERK, and JNK pathways. Inhibition of each of these pathways had no effect on CRAC channel-transcription coupling. Pretreatment for 20–30 min with 1 μm GO-6983 (to block protein kinase C), 10 μm calmidazolium (to block calmodulin), 5 μm cyclosporine (to block calcineurin), and 50 μm AG490 (to block the JNK pathway) all failed to interfere with thapsigargin-evoked c-fos expression (data not shown). In agreement with our previous work, we found that block of the MEK/ERK pathway with U0126 (10 μm; 20 min pretreatment) failed to interfere with c-fos expression following stimulation with thapsigargin (Fig. 5E). We also failed to see any phosphorylation of CREB following CRAC channel activation, suggesting this transcription factor likewise is not involved (data not shown). Signal transducers and activators of transcription (STAT), is a family of cytoplasmic transcription factors (27) that are widely expressed in immune cells. STATs can be activated following tyrosine phosphorylation by non-receptor tyrosine kinases (28). Phosphorylated STATs dimerize and then rapidly translocate to the nucleus, where they bind to enhancer elements and regulate gene expression (28). Using an anti-phospho-specific STAT5 antibody, we found that stimulation with thapsigargin resulted in STAT5 activation within 240 s of stimulation (Fig. 5F; aggregate data from three independent experiments are summarized in Fig. 5G), and this was fully prevented by pretreating cells with the Syk inhibitor (Fig. 5G; *, p < 0.01 between control and thapsigargin groups, ANOVA; p > 0.4 between control and thapsigargin/Syk inhibitor groups, ANOVA). An anti-phospho-specific STAT3 antibody failed to detect activation of STAT3 following opening of CRAC channels (data not shown). Hence, Syk recruits the transcription factor STAT5.
FIGURE 5.
Syk recruits the transcription factor STAT5. A, distribution of endogenous Syk in resting RBL-1 cells, observed using immunocytochemistry. B, aggregate data measuring the intensity of Syk fluorescence across the lateral profile of cells is shown, measured in line scan mode (nine cells for Syk and 11 for green fluorescent protein). C, distribution of green fluorescent protein (GFP), used as a cytoplasmic marker, in an RBL-1 cell. D, Syk remains at the plasma membrane following stimulation with thapsigargin. E, thapsigargin (Thap.)-evoked c-fos expression is unaffected by blocking the MEK/ERK pathway with U0126. F, thapsigargin promotes phosphorylation of the transcription factor STAT5, and this is prevented by inhibition of Syk. G, aggregate data from three experiments (as in F) are shown. The thapsigargin-stimulated group differs significantly from control (non-stimulated) and thapsigargin/Syk inhibitor groups (*, p < 0.01, ANOVA). Thapsigargin/Syk inhibitor group was not significantly different from the control (non-stimulated) one (p > 0.5).
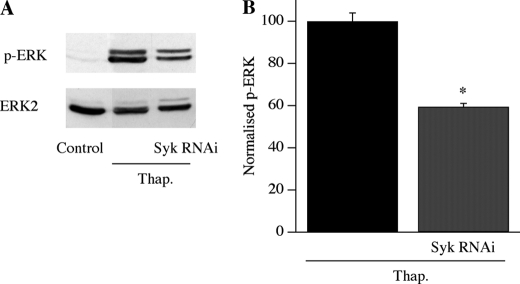
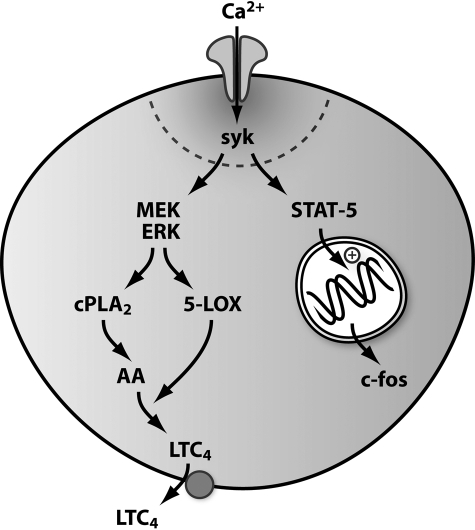
We have recently established that Ca2+ microdomains near CRAC channels activate the cytoplasmic enzymes Ca2+-dependent phospholipase A2 and 5-lipoxygenase via recruitment of the MEK/ERK pathway (20). This results in the generation of the intracellular messenger arachidonic acid, which is rapidly metabolized by 5-lipoxygenase to the proinflammatory paracrine signal leukotriene C4 (18, 20). Do the Ca2+ microdomains couple to gene expression and ERK/cPLA2/leukotrienes by the same mechanism? Pharmacological data implicated Syk in coupling Ca2+ microdomains to ERK and cPLA2 activation (18). To strengthen this, we measured ERK activation, before and then after knockdown of Syk. Whereas thapsigargin evoked robust stimulation of ERK in control cells (measured as ERK phosphorylation (18) after 4-min stimulation), the extent of ERK activation was significantly reduced following pretreatment of the cells with siRNA against Syk (Fig. 6, A and B). Hence ERK activation and gene expression, which occur over very different time frames, are both triggered by local Ca2+ influx-mediated stimulation of Syk. However, the signaling mechanisms then diverge in that Syk activates gene expression independent of the MEK/ERK pathway (Fig. 5E). These findings reveal the remarkable versatility of Ca2+ microdomains in activating key cell responses. Local Ca2+ influx can simultaneously activate two spatially and temporally distinct processes via Syk (Fig. 7). Syk might detect the local Ca2+ signal directly, or a Ca2+-dependent tyrosine kinase like Pyk-2 (29) could act as an intermediary, linking the Ca2+ microdomain to Syk. Parallel processing of the Ca2+ microdomain by Syk activates cytoplasmic enzymes as well as gene expression in the nucleus, several μm away. Such an intimate interaction between the Ca2+ channel and signal transduction to the nucleus would greatly increase the fidelity, speed, and selectivity of excitation-transcription coupling.
FIGURE 6.
Syk knockdown reduces ERK activation. A, Western blot showing that ERK phosphorylation evoked by thapsigargin (Thap.) (in scrambled siRNA-treated cells) is reduced by siRNA knockdown of Syk. B, aggregate data from three independent gels are compared. *, p < 0.01, Student's t test.
FIGURE 7.
Parallel processing of the Ca2+ microdomain by Syk. Local Ca2+ entry is detected by Syk, which then activates two distinct signaling pathways. Syk recruits protein kinase C and the MEK/ERK cascade, resulting in activation of cPLA2 and 5-lipoxygenase. This generates the intracellular messenger arachidonic acid (AA) and the proinflammatory paracrine signal leukotriene C4 (LTC4) (18). At the same time, Syk phosphorylates the transcription factor STAT5, which then migrates to the nucleus, where it increases c-fos expression. The Ca2+ microdomain can therefore be processed by Syk through two parallel pathways into the activation of temporally distinct cellular responses.
This work was supported by a Medical Research Council program grant (to A. B. P.).
- ER
- endoplasmic reticulum
- CRAC
- Ca2+ release-activated Ca2+
- MEK
- mitogen-activated protein kinase/extracellular signal-regulated kinase kinase
- ERK
- extracellular signal-regulated kinase
- RBL-1
- Rat basophilic leukemia-1
- BAPTA
- 1,2-bis(2-aminophenoxy)ethane-N,N,N′,N′-tetraacetic acid
- AM
- acetoxymethyl ester
- RNAi
- RNA interference
- ANOVA
- analysis of variance
- STAT
- signal transducers and activators of transcription
- cPLA2
- cytosolic phospholipase A2.
REFERENCES
- 1.Berridge M. J., Bootman M. D., Roderick H. L. (2003) Nat. Rev. Mol. Cell Biol. 4, 517–529 [DOI] [PubMed] [Google Scholar]
- 2.Clapham D. E. (2007) Cell 131, 1047–1058 [DOI] [PubMed] [Google Scholar]
- 3.Parekh A. B. (2008) J. Physiol. 586, 3043–3054 [DOI] [PMC free article] [PubMed] [Google Scholar]
- 4.Berridge M. J. (2006) Cell Calcium 40, 405–412 [DOI] [PubMed] [Google Scholar]
- 5.Neher E. (1998) Neuron 20, 389–399 [DOI] [PubMed] [Google Scholar]
- 6.Parekh A. B., Putney J. W., Jr. (2005) Physiol. Rev. 85, 757–810 [DOI] [PubMed] [Google Scholar]
- 7.Berridge M. J. (1993) Nature 361, 315–325 [DOI] [PubMed] [Google Scholar]
- 8.Lewis R. S. (2007) Nature 446, 284–287 [DOI] [PubMed] [Google Scholar]
- 9.Feske S., Gwack Y., Prakriya M., Srikanth S., Puppel S. H., Tanasa B., Hogan P. G., Lewis R. S., Daly M., Rao A. (2006) Nature 441, 179–185 [DOI] [PubMed] [Google Scholar]
- 10.Yeromin A. V., Zhang S. L., Jiang W., Yu Y., Safrina O., Cahalan M. D. (2006) Nature 443, 226–229 [DOI] [PMC free article] [PubMed] [Google Scholar]
- 11.Prakriya M., Feske S., Gwack Y., Srikanth S., Rao A., Hogan P. G. (2006) Nature 443, 230–233 [DOI] [PubMed] [Google Scholar]
- 12.Vig M., Beck A., Billingsley J. M., Lis A., Parvez S., Peinelt C., Koomoa D. L., Soboloff J., Gill D. L., Fleig A., Kinet J. P., Penner R. (2006) Curr. Biol. 16, 2073–2079 [DOI] [PMC free article] [PubMed] [Google Scholar]
- 13.Parekh A. B. (2007) Cell Calcium 42, 111–121 [DOI] [PubMed] [Google Scholar]
- 14.Dolmetsch R. E., Xu K., Lewis R. S. (1998) Nature 392, 933–936 [DOI] [PubMed] [Google Scholar]
- 15.Gallo E. M., Canté-Barrett K., Crabtree G. R. (2006) Nat. Immunol. 7, 25–32 [DOI] [PubMed] [Google Scholar]
- 16.Li W., Llopis J., Whitney M., Zlokarnik G., Tsien R. Y. (1998) Nature 392, 936–941 [DOI] [PubMed] [Google Scholar]
- 17.Lee Y. N., Tuckerman J., Nechushtan H., Schutz G., Razin E., Angel P. (2004) J. Immunol. 173, 2571–2577 [DOI] [PubMed] [Google Scholar]
- 18.Chang W. C., Di Capite J., Singaravelu K., Nelson C., Halse V., Parekh A. B. (2008) J. Biol. Chem. 283, 4622–4631 [DOI] [PubMed] [Google Scholar]
- 19.Moreau B., Nelson C., Parekh A. B. (2006) Curr. Biol. 16, 1672–1677 [DOI] [PubMed] [Google Scholar]
- 20.Chang W. C., Nelson C., Parekh A. B. (2006) FASEB J. 20, 2381–2383 [DOI] [PubMed] [Google Scholar]
- 21.Ng S. W., di Capite J., Singaravelu K., Parekh A. B. (2008) J. Biol. Chem. 283, 31348–31355 [DOI] [PubMed] [Google Scholar]
- 22.Moreau B., Straube S., Fisher R. J., Putney J. W., Jr., Parekh A. B. (2005) J. Biol. Chem. 280, 8776–8783 [DOI] [PubMed] [Google Scholar]
- 23.Straube S., Parekh A. B. (2002) Pfluegers Arch. 444, 389–396 [DOI] [PubMed] [Google Scholar]
- 24.Bakowski D., Parekh A. B. (2007) Cell Calcium 42, 333–339 [DOI] [PubMed] [Google Scholar]
- 25.Neher E. (1998) Cell Calcium 24, 345–357 [DOI] [PubMed] [Google Scholar]
- 26.Frieden M., James D., Castelbou C., Danckaert A., Martinou J. C., Demaurex N. (2004) J. Biol. Chem. 279, 22704–22714 [DOI] [PubMed] [Google Scholar]
- 27.Darnell J. E., Jr. (1997) Science 277, 1630–1635 [DOI] [PubMed] [Google Scholar]
- 28.Bromberg J. F. (2001) BioEssays 23, 161–169 [DOI] [PubMed] [Google Scholar]
- 29.Lev S., Moreno H., Martinez R., Canoll P., Peles E., Musacchio J. M., Plowman G. D., Rudy B., Schlessinger J. (1995) Nature 376, 737–745 [DOI] [PubMed] [Google Scholar]


