

Abstract
Limits to the capacity of visual short-term memory (VSTM) indicate a maximum storage of only 3 or 4 items. Recently, it has been suggested that activity in a specific part of the brain, the posterior parietal cortex (PPC), is correlated with behavioral estimates of VSTM capacity and might reflect a capacity-limited store. In three experiments that varied the delay period and the stimuli to be stored, we found dissociations between functional magnetic resonance imaging (fMRI) activity in PPC and behavioral measures of capacity. When the delay length increased, fMRI activity in this area increased with memory load beyond the behaviorally determined limits of capacity. The results suggest that activity in PPC may reflect the attentional demands of short-term memory rehearsal processes rather than capacity limitations, and imply that a larger number of items than that determined by behavioral measures of capacity may be rehearsed during STM tasks. This account is consistent with the role of PPC in attentional processes and with the close correlation between brain areas that are involved in attention and those that mediate STM.
Keywords: FMRI, Memory capacity limits, Rehearsal, Memory delay, VSTM
The ability to retain information for short periods of time plays an essential role in cognition. One of the most intriguing aspects of short-term memory is its limited capacity ([Cowan, 2001] and [Cowan, 2006]; Vogel, Woodman, & Luck, 2001; Wheeler & Treisman, 2002). Although numerous studies have examined this aspect of STM, the origins of these limitations are as yet unclear (Cowan, 2006). The short-term retention of information typically involves a sequence of processes: encoding, maintenance and the retrieval of information from memory to guide behavior. Most theories, however, assume that VSTM is limited by a small number of items that can be maintained in the store, leaving no room for errors due to encoding or retrieval processes. According to these theories, errors arise when more items are presented than can be stored and participants are probed on one of the excess items. If this view is correct, the critical measure of memory capacity can be directly estimated from the observed accuracy ([Cowan, 2001] and [Pashler, 1988]).
Research on short-term memory using fMRI has revealed a large network of brain areas involved in the short-term maintenance of information (Cohen et al., 1997; Courtney, Ungerleider, Keil, & Haxby, 1997; Curtis & D'Esposito, 2003; Jonides, Lacey, & Nee, 2005; LaBar, Gitelman, Parrish, & Mesulam, 1999; Linden et al., 2003; Pessoa, Gutierrez, Bandettini, & Ungerleider, 2002; Ungerleider, Courtney, & Haxby, 1998). Recent findings on memory for color circles have suggested that a neural correlate of the behavioral capacity limitations can be found in activity in the IPS (intraparietal sulcus) of the PPC (Todd & Marois, 2004), suggesting that this area may constitute a capacity-limited visual memory store. The activity in this area was correlated with the group-averaged behavioral measures of capacity. Importantly, the observed activity in PPC showed an asymptotic function and leveled off with as few as 3 items.
A subsequent study suggested that the correlation with capacity limitations is restricted to the superior part of the IPS together with an additional area, the lateral occipital cortex (LOC) (Xu & Chun, 2006). In this study, the activated area of the superior IPS was localized for each participant using their individual behavioral measures of capacity obtained in a color VSTM task. Subsequently, these ROIS were used to examine fMRI activity in response to a VSTM task to simple shapes. With these simple shapes, the same pattern of activity was obtained; the fMRI activity in the superior IPS increased up to 3 items and leveled off, in accordance with the behavioral measures of capacity.
The claim that a particular cortical area could be identified with a storage area for items in VSTM rightly aroused a great deal of interest. However, it is worth examining whether the close correlation between behavioral measures of capacity and fMRI activity in the superior IPS holds up across variations of memory delay, task and materials in order to establish the generality of these VSTM mechanisms in PPC, or to derive alternative accounts.
One factor that may influence processes that occur during a VSTM task is the length of the memory delay. At the behavioral level, several studies suggest that qualitatively different processes occur in VSTM tests with short delays (around 1 s) and longer delays (around 6 s) ([Baddeley, 1986] and [Phillips, 1974]; Treisman & Zhang, 2006). During the first second, the memorized items appear to remain close to their original perceptual format, while over the next few seconds they are consolidated into a more abstract, less location-specific format (Treisman & Zhang, 2006). Thus, within the first second, memorized items have probably not formed durable STM representations. Consolidation is assumed to be a process during which items are transformed from perceptual representations into durable STM representations that are resistant to masking. Estimates of consolidation time range between 400 ms and 1 s or possibly even longer, and this estimate increases with memory set size, implying that the consolidation process is time consuming and capacity limited (Jolicoeur & Dell'Acqua, 1998; Vogel, Woodman, & Luck, 2006). Counteracting consolidation, in the next few seconds of VSTM there is an increasing threat of loss through decay or interference. In order to maintain the traces, more attentional resources may be engaged at longer delays. Thus the delay length may have an impact on the processes that occur during the task and may also influence the mechanisms that are engaged. Here we examine whether the differences between short and longer delays and the potentially greater attentional demands of longer delays influence the pattern of activity in PPC, a key area in attentional processes (Corbetta & Shulman, 2002; Kastner & Ungerleider, 2000).
Experiments 1 and 2 compare behavioral load functions and fMRI activation during VSTM for colored circles at delays of 1200 ms and of 6000 ms. Experiment 3 compares the same measures in STM for spatial locations at the longer delay. Although behavioral as well as neural evidence suggest that spatial and visual information may be stored by separate systems (Baddeley, 1992; Courtney, Ungerleider, Keil, & Haxby, 1996; Smith et al., 1995; Tresch, Sinnamon, & Seamon, 1993), attentional processes that mediate the increased demands of load may be similar.
To anticipate, our results demonstrate that when the demands of the STM task increase with the delay length, the relation between fMRI activity in superior IPS and behavioral measures of capacity also changes. When the attentional demands of the task increase, the activity no longer reaches an asymptote early and deviates from the behavioral measures of capacity. We suggest that the studies that found a close correlation between PPC activity and capacity limitations represent instances in which attentional engagement in the VSTM task was limited, leading PPC activity in those tasks to reach an asymptote at low load levels, which therefore seemed to parallel the behavioral measures of capacity that also reached an asymptote early.
1. Experiment 1
The goal of experiment 1 was to replicate previous findings that established the relation between fMRI activity in PPC and behavioral measures of capacity (Todd & Marois, 2004). A color VSTM task with a delay of 1200 ms was employed in the experiment.
2. Methods
2.1. Participants
Fourteen neurologically healthy participants were tested in experiment 1. All had normal or corrected-to-normal vision and gave written informed consent for participation, which was approved by the Institutional Review Panel of Princeton University.
2.2. Stimuli and design
Each trial began with the presentation of three digits for 500 ms appearing side by side and centered at fixation (the string of digits measuring approximately 1° in width and 0.3° in height). Participants were asked to remember the digits for later test. This secondary digit task was used to discourage participants from naming and verbally rehearsing the colors. The digit display was followed by 2600 ms of fixation (Fig. 1). The color memory sample was presented for 500 ms thereafter. The memory sample contained either 1, 3, 5 or 7 filled colored circles measuring 0.4° each, that appeared in randomly selected cells (excluding the central location where the fixation cross was presented throughout the trial) within a 5 × 5 matrix centered around fixation (the matrix measuring approximately 6° × 6°, with each cell measuring 1.2° × 1.2°). The target circles were jittered within the cells with the constraint that the circles never touched the edge of the cell.
Fig. 1.
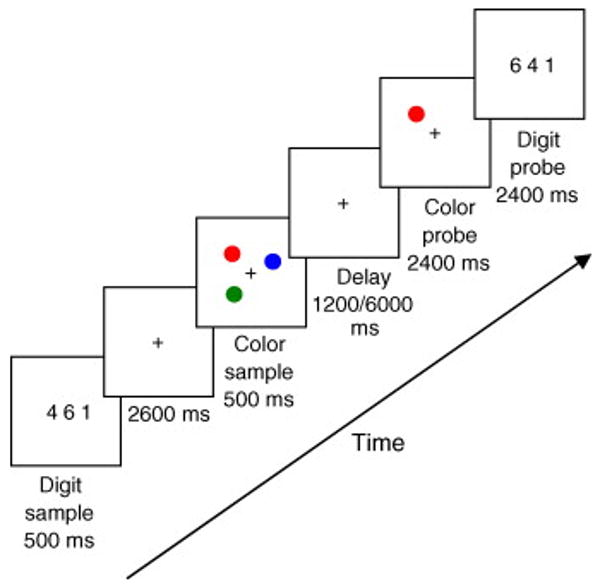
Experimental design (experiments 1 and 2). Each trial began with the presentation of three digits (for 500 ms). After a blank period of 2600 ms the color memory display, consisting of a varying number of colored circles (1, 3, 5 or 7), was presented for 500 ms. A delay of 1200 ms (Exp. 1) or 6000 ms (Exp. 2) was followed by the presentation of the color probe. Participants judged whether the color and location of the probe matched that of one of the items in the memory sample display. The digit probe was presented afterwards, and participants had to decide whether all three digits had appeared at the beginning of the trial.
To make sure that the difficulty level between the different load conditions could only be explained by the number of memorized items, we matched the density of the stimulus display between load conditions by restricting the size of the possible space in which the items were presented. Therefore, three items were always presented in randomly selected 3 × 3 sub-matrices within the main 5 × 5 matrix, and five items were always presented in randomly selected 5 × 3 sub-matrices within the main matrix. One and seven items were presented randomly within the 5 × 5 matrix. The colors of the circles were chosen randomly without replacement from a set of nine colors (green, blue, red, yellow, cyan, magenta, white, brown or black). Thus, each color could appear only once on each trial.
Following a delay period of 1200 ms a single probe for the color VSTM task was presented for 2400 ms in one of the previously occupied locations. The probe could match the color of the item presented at that location (match condition), or be a different color in the non-match condition (randomly chosen from the remaining colors). Following the color probe, three digits were presented for 2400 ms. These could match or mismatch the identity of the three digits presented at the beginning of the trial, regardless of order of presentation. Participants responded by key presses to both tasks, using the same response keys. Each trial was followed by 9600 ms of fixation, to allow the fMRI signal to return to baseline. A warning tone indicated to the subjects the forthcoming trial 3 s before the end of the fixation time. There were eight fMRI runs in each experiment, with 16 trials in each run. The load manipulation was randomized within each run.
2.3. Data acquisition and analysis
Data were acquired with a Siemens Allegra 3T head scanner. A Macintosh G4 computer running Matlab software (The MathWorks; Natick, MA) and Psychophysics toolbox (Brainard, 1997) was used to display stimuli and collect participants' responses. Stimuli were projected from a PowerLite 7250 LCD display projector (Epson; Long Beach, CA) outside the scanner room onto a screen located at the end of the scanner bore. A trigger pulse from the scanner synchronized the onset of stimulus presentation at the beginning of the image acquisition. Functional images were taken with a gradient echo, echoplanar sequence (TR = 1200 ms; TE = 30 ms; flip angle = 65; matrix 64 × 64 voxels). 20 axial slices were acquired (thickness = 4 mm; gap = 2 mm; in plane resolution, 3 mm × 3 mm). Additional structural high resolution images were taken of the whole brain (MPRAGE sequence, TR = 2500 ms; TE = 4.38 ms; flip angle = 8; 256 × 256 matrix, 1.5 × 1 × 1 mm).
2.3.1. Behavioral data
RTs and errors were collected during the scanning session. The number of items held in memory was evaluated using Cowan's K formula (Cowan, 2001): K = (hit rate + correct rejection rate − 1) × N (N = memory set size). The formula is based on the assumption that K out of N items can be held in memory, and participants perform correctly on K/N of the trials. However, the formula also takes into account that some of the accurate responses are based on guessing.
2.3.2. fMRI data
Data were analyzed using AFNI (http://afni.nimh.nih.gov/afni). Data pre-processing consisted of 3D motion correction, slice acquisition time correction, spatial smoothing with a Gaussian kernel (FWHM = 8 mm) and Talairach transformation (Talairach and Tournoux, 1988).
For the statistical analysis, a set of square wave functions were defined for each load level. All regressors were convolved with a gamma-variate function and used as regressors of interest in a multiple regression model (Friston et al., 1995). Several regressors were added to account for variance due to baseline shifts between time series, linear drifts within time series and head motion.
The statistical analyses were based on a random-effects ANOVA using K-weighted coefficients of the group-averaged K (Todd & Marois, 2004). Although we hypothesized that the activity in PPC does not necessarily follow the behavioral K function, the statistical analysis was aimed at locating the same area that was localized in previous studies using the same method (Todd & Marois, 2004). Note that the K-weighted coefficients give considerable weight to set size 1, in comparison to the other set sizes. Therefore, other patterns of activity that satisfy this comparison (a large difference between set size 1 and other set sizes) may emerge using the K-weighted coefficients.
Statistical maps were thresholded using the Alphasim program included in AFNI to correct for multiple comparisons. A minimum cluster size of 84 voxels in original space was used to achieve corrected significance of P < 0.05. Unless stated otherwise, all statistical comparisons on the behavioral and fMRI data are one-tailed paired-samples t-tests.
The time series of fMRI signals were extracted for each load level and for each activated area. Percent signal change for each condition was calculated by normalizing the response obtained during each trial to the activity measured at the first time point of that trial. The time series were extracted separately for each participant and then averaged across individuals. The peak percent signal change was defined as the peak activity in the averaged time course across all conditions and participants (Todd & Marois, 2004). The peak activity was at 7.2 s following stimulus onset.
3. Results
3.1. Behavioral results
The behavioral estimates of K were calculated for each participant, for each load level and then averaged across participants. K increased significantly from set size 1 to 3 (t(13) = 13.0, P < 0.01), and from set size 3 to 5 (t(13) = 2.8, P < 0.01), and then leveled off (t(13) = 1.3, P > 0.2) between set sizes 5 and 7 (Fig. 2a). Reaction time (RT) increased significantly from each set size to the next (all Ps < 0.01, t(13) = 6.9, 4.6, 3.0 respectively). Accuracy in the digit task was high overall (95– 98%) and did not vary as a function of load (F(3,39) = 1.4, P > 0.3 in a repeated measures ANOVA).
Fig. 2.
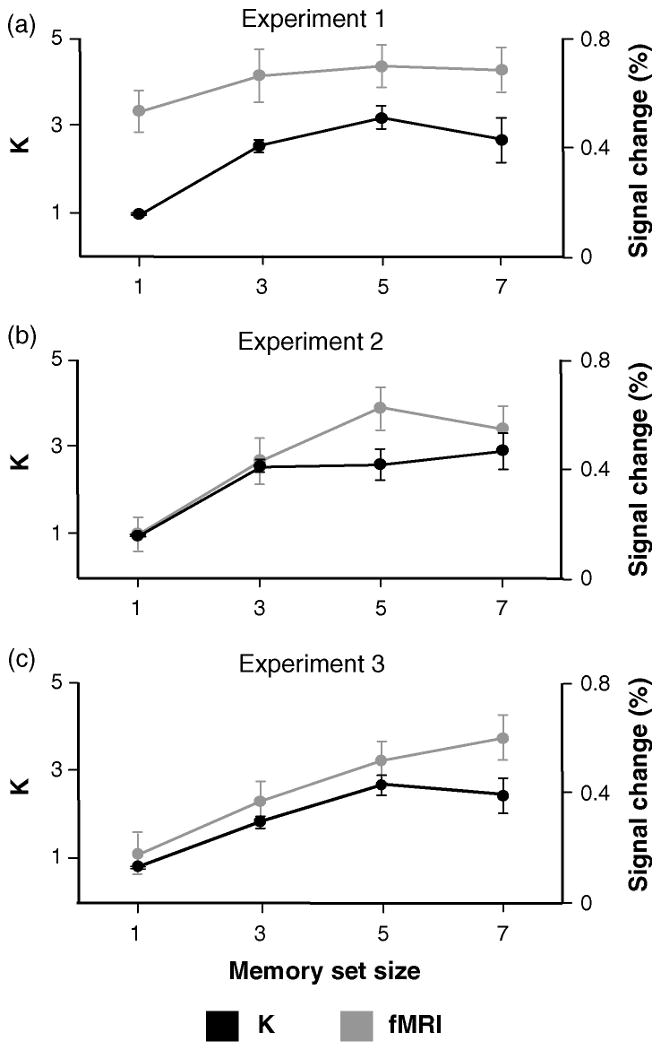
Behavioral and fMRI results from experiments 1, 2 and 3. (a) Averaged behavioral K estimates, and averaged peak activity in experiment 1 as a function of memory load. (b) Averaged behavioral K estimates and averaged activity over the defined delay interval (see Section 5) in Superior IPS in experiment 2. (c) Averaged behavioral K estimates and averaged activity over the defined delay period in experiment 3 (error bars represent s.e.m.).
3.2. FMRI results
The fMRI analysis revealed activation in a bilateral area in superior IPS cortex, in a location similar to that previously reported in VSTM tasks (Todd & Marois, 2004; Xu & Chun, 2006) (Fig. 3a). Time course analyses of the peak response amplitude in this area revealed that the activity increased significantly from set size 1 to 3 (t(13) = 4.7, P < 0.01) but leveled off thereafter (t(13) = 1.2, P > 0.2 for the difference between 3 and 5) (Fig. 2a).
Fig. 3.
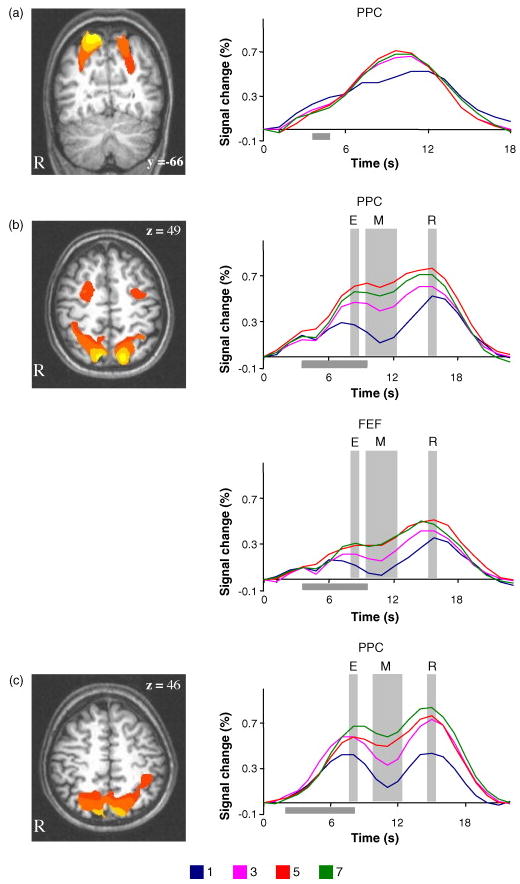
Results of experiments 1, 2 and 3. (a) Results of experiment 1. (Left) Group statistical parametric map overlaid on structural image of a representative subject. Talairach coordinates of the highest activated voxels in PPC (x,y,z): +25/−28,−54/−51,+48/+48. (Right) fMRI signals from the activated IPS area. (b) Results of experiment 2. (Left) Group statistical parametric map overlaid on a structural image of a representative subject. Talairach coordinates of the highest activated voxels (x,y,z): PPC +15/−22,−63/−70,+52/+42. FEF +23/−32,+1/+5,+48/+48. (Right) fMRI signals from the activated regions within IPS and the FEF. (c) Results of experiment 3. (Left) Group statistical parametric map overlaid on a structural image of a representative subject. Talairach coordinates of the highest activated voxels (x,y,z): +24/−18,−57/−63,+42/+42. (Right) fMRI signals from the activated area in IPS. The grey horizontal bar represents the delay interval. The grey vertical bars in experiments 2 (b) and 3 (c) indicate the three phases of the task (encoding, maintenance and retrieval).
The fMRI data of experiment 1 replicate previous findings in which the fMRI signal in PPC also leveled off at set size 3 (Todd & Marois, 2004; Xu & Chun, 2006). However, our results suggest a dissociation between the fMRI signals in PPC and the behavioral K estimates, since the latter continued to increase between load levels of 3 and 5. Thus, the fMRI signals in experiment 1 underestimate the number of items that were retained in VSTM.
4. Experiment 2
Experiment 2 was critical in examining our hypothesis. It was aimed at testing whether the potentially greater demands of a longer delay period would change the pattern of fMRI activity, independently of any effects on the behavioral K function. Experiment 2 was identical to experiment 1 except for the delay length, which was increased to 6000 ms.
5. Methods
5.1. Participants
Ten neurologically healthy participants participated in experiment 2 (eight participated in experiment 1 as well). As in experiment 1, all had normal or corrected-to-normal vision and gave written informed consent for participation, which was approved by the Institutional Review Panel of Princeton University.
5.2. Stimulus and design
The delay length in experiment 2 was 6000 ms. All other aspects of the behavioral task were identical to experiment 1.
5.3. Data acquisition and analysis
Data acquisition procedures were identical to experiment 1.
5.3.1. Behavioral data
As in experiment 1, RTs and errors were collected during the scanning session. The number of items held in memory was evaluated using Cowan's K formula (Cowan, 2001).
5.3.2. FMRI data
As in experiment 1, data were analyzed using AFNI (http://afni.nimh.nih.gov/afni). Data preprocessing consisted of 3D motion correction, slice acquisition time correction, spatial smoothing with a Gaussian kernel (FWHM = 8 mm) and Talairach transformation.
For the statistical analysis, a set of square wave functions were defined for each load level. Due to the long delay employed in the task, these functions were defined separately for each of three phases of the task (i.e., encoding, delay and retrieval). Although, the delay phase lasted for 6000 ms, the delay regressor was defined based on the last 2 s of the delay period. When modeling delay activity care needs to be taken to ensure that the delay activity is not contaminated by carryover of activity from the encoding phase. As has been indicated before (Zarahn, Aguirre, & D'Esposito, 1997), a temporal separation of 4 s between two neural events (i.e., encoding and maintenance here) is desirable to dissociate the neural activity that is related to these events. The delay regressor, which was based on the last 2 s of the delay period, was separated by 4 s from encoding, and therefore was not contaminated by activity from it. To verify the robustness of the results, we tested our data with an additional regressor that was based on the last 4 s of the delay. The parametric statistical map that was based on this regressor was identical to that of the 2 s regressor (similar results were obtained before (Pessoa et al., 2002)).
All regressors were convolved with a gamma-variate function and used as regressors of interest in a multiple regression model (Friston et al., 1995). Several regressors were added to account for variance due to baseline shifts between time series, linear drifts within time series and head motion.
As in experiment 1, the statistical analyses were based on a random-effects ANOVA using K-weighted coefficients of the group-averaged K. The K weighted coefficients analysis was conducted on the activity during the delay period, which should best reflect the maintenance period. Statistical maps were thresholded using the Alphasim program included in AFNI to correct for multiple comparisons. A minimum cluster size of 70 voxels in original space was used to achieve corrected significance of P < 0.05. As in experiment 1, all statistical comparisons on the behavioral and fMRI data are one-tailed paired-samples t-tests, unless stated otherwise.
5.3.3. Individual ROI analysis
The relation between the behavioral K function and fMRI activity has been examined either using the group K function (Todd & Marois, 2004) or individual K functions and individual ROIS (Xu & Chun, 2006). The present study used the group averaged K function. Nevertheless, because experiment 2 was critical in testing our hypothesis, we thought it necessary to examine the data of experiment 2 with the individual analysis as well.
Therefore, in experiment 2 we conducted a multiple regression analysis separately for each participant, with K-weighted coefficients corresponding to each participant's behavioral K function. The resultant activity in the area of PPC was defined as the ROI corresponding to the K function. The data was corrected for multiple comparisons (FDR (false discovery rate), P < 0.05). If the activated area was extensive, the ROI was limited to 20 voxels (6 mm × 3 mm × 3 mm) around the peak activity. Two of the ten subjects in experiment 2 did not show any activation after the FDR analysis. For these subjects, the ROI was defined as the 20 highest activated voxels (P < 0.001 uncorrected, for both subjects).
For both types of analysis, the time series of fMRI signals were extracted for each load level and for each activated area. Percent signal change for each condition was calculated by normalizing the response obtained during each trial to the activity measured at the first time point of that trial. The time series were extracted separately for each participant and then averaged across individuals. Three phases of the task were defined, namely, encoding, delay and retrieval. The encoding and retrieval phases were defined as the two peaks following stimulus and probe presentation respectively in an averaged time course across all conditions and participants. The delay period was defined as the time between these two peaks and around the dip of the time course before the activity increased again due to the presentation of the probe. This gave the following timing of the different phases: encoding at 4.8 s after stimulus onset, maintenance between 6 and 9.6 s after stimulus onset, and retrieval at 12 s after stimulus onset.
6. Results
6.1. Behavioral results
The behavioral results of experiment 2 showed a significant increase in K from set size 1 to 3 (t(9) = 14.4, P < 0.01), that leveled off thereafter (t(9) = 0.02, P > 0.9 for the difference between set sizes 3 and 5) (Fig. 2b). RT increased significantly from each set size to the next for all load levels (Ps < 0.01, t(9) = 6.2, 4.1, 2.6 respectively). Accuracy in the digit task was high (92–97%) and did not differ as a function of VSTM load (F(3,27) = 2.0, P > 0.1 in a repeated measures ANOVA).
6.1.1. Comparing the K function in experiments 1 and 2
We compared the measures of K in experiments 1 and 2 (based on the data of eight subjects who participated in both experiments). A repeated measures ANOVA showed main effects of both experiment (F(1,7) = 11.2, P < 0.01) and load (F(3,21) = 16.9, P < 0.01) and a significant interaction between them (F(3,21) = 3.6, P < 0.05). K was significantly reduced with the longer delay, suggesting some loss through decay or distraction in the higher load conditions. On the other hand, RT continued to increase significantly from each set size to the next for all load levels, indicating that the increasing load demanded more effort during retrieval, although the effort was not successful.
6.2. FMRI results
The fMRI analysis revealed a bilateral area in the superior IPS, similar to that found in experiment 1, and an additional area in the precentral sulcus, in the region of the human FEF (Fig. 3b). With the delay of 6000 ms we were able to examine the load effect separately at three phases of the memory task: encoding, maintenance and retrieval.
6.2.1. PPC ROI
Time course analyses for the encoding and retrieval phases showed the same pattern of activity (Fig. 3b): the activity increased from set size 1 to 3 (t(9) = 3.4 t(9) = 2.6 (for encoding and retrieval respectively) Ps < 0.01), and from 3 to 5 (t(9) = 2.2, t(9) = 2.4 (for encoding and retrieval respectively) Ps < 0.05), which then leveled off (t(9) = 1.3, P > 0.2 for encoding, t(9) = 0.9, P > 0.4 for retrieval). The activity during the delay period, which should reflect maintenance processes, increased from set size 1 to 3 (t(9) = 5.6, P < 0.01), and from 3 to 5 (t(9) = 3.5, P < 0.01), and then decreased significantly from set size 5 to 7 (t(9) = 2.3, P < 0.05) (Fig. 2b). The pattern of activity during all phases of the task dissociated from the behavioral K estimates, which leveled off at set size 3. The activity did not increase linearly with the number of items presented, but showed an asymptotic function that deviated from the asymptotic behavioral K function.
6.2.1.1. Comparing PPC activations in experiments 1 and 2
The activated area in PPC in experiment 2 extended further medially and superiorly relative to experiment 1. To verify that the results of experiment 2 were not due to these additional areas of activation, we used the ROI from experiment 1 (that did show a K-like asymptotic function of fMRI activity), to extract the time-course from experiment 2. This analysis was done on the data of eight subjects who participated in both experiments. The time course analysis of experiment 2 data in this smaller ROI did not change the pattern of results of this experiment: the activation over the delay period increased significantly from set size 1 to 3 (t(7) = 3.3, P < 0.01), from 3 to 5 (t(7) = 2.0, P < 0.05) and then decreased significantly from set size 5 to 7 (t(7) = 2.6, P < 0.05).
To further establish the dissociation between the patterns of activity in experiments 1 and 2, we compared the activity in superior IPS in the two experiments (again, for the eight subjects who participated in both experiments). First, we normalized the observed activity at each load level by subtracting from it the activity obtained with set size 1. On these normalized fMRI data we conducted a repeated measures ANOVA. The ANOVA showed a main effect of experiment (F(1,7) = 33.5, P < 0.01) and load (F(3,21) = 21.0, P < 0.01) and a significant interaction between them (F(3,21) = 6.4, P < 0.01). Importantly, the combined results of the two experiments showed a double dissociation between the behavioral and fMRI measures. Whereas the K function was steeper with the short delay, the fMRI signals in PPC showed a steeper function with the longer delay. These results are consistent with the idea that accuracy is higher shortly after presentation of the memory display, and drops with decay over time. On the other hand, active attentional processes that are reflected in the fMRI activity in IPS are invoked in an attempt to counteract this memory loss.
6.2.1.2. Individual ROI analysis
The group results of experiment 2 showed a deviation of the fMRI activity from the behavioral measures of capacity even when we used the smaller ROI from experiment 1. However, it is still possible that with longer memory delays, such as that used in experiment 2, even this smaller ROI contains areas of activity that are unrelated to VSTM capacity limits. This in turn may have led to the deviation of the fMRI activity in experiment 2 from the behavioral K function. To rule out this alternative explanation we localized, for each participant, the area in PPC corresponding to their individual K function, as in Xu and Chun (2006).
The averaged Talairach coordinates (Talairach & Tournoux, 1988) were similar to those of previous reports (Todd & Marois, 2004; Xu & Chun, 2006) and those of the analysis reported here ((x,y,z): +22/−18,−61/−63,+49/+48). Using the individual ROI analysis did not change the pattern of results of experiment 2. The fMRI activity still deviated from the behavioral measures of capacity. During the delay period, the activity increased from set size 1 to 3 (t(9) = 8.7, P < 0.01), and from set size 3 to 5 (t(9) = 4.5, P < 0.01), and then decreased significantly from set size 5 to set size 7 (t(9) = 2.0, P < 0.05) (Fig. 4).
Fig. 4.
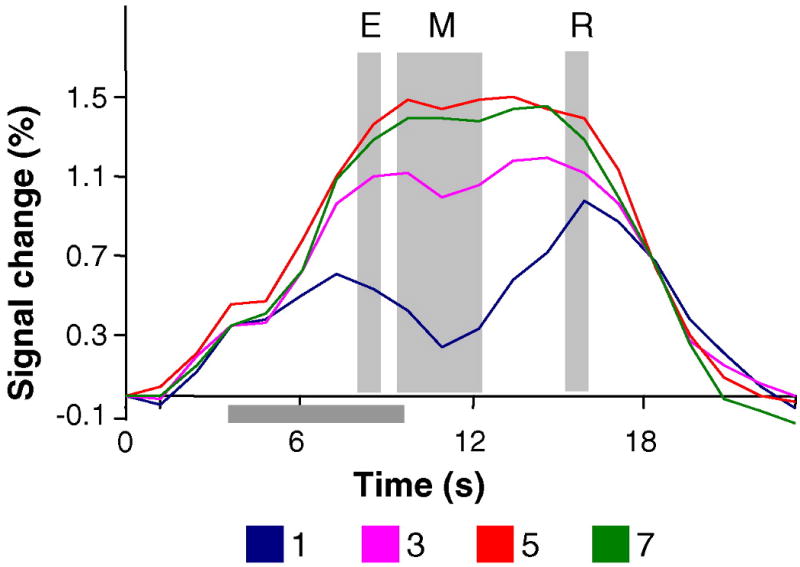
Results of experiments 2, individual ROI analysis. FMRI signals from the individually defined ROIs, averaged across subjects. The grey horizontal bar represents the delay interval. The grey vertical bars indicate the three phases of the task (encoding, maintenance and retrieval). Note that the y-axis was stretched relative to previous figures to accommodate the individual ROI analysis data.
6.2.2. FEF ROI
Our interpretation, attributing IPS activity in experiment 2 to attentional processes, is supported by the finding of a similar pattern of activity in the human FEF. During encoding, the activity in FEF showed a main effect of load (F(3,27) = 3.2, P < 0.05 in a repeated-measures ANOVA) although the difference between immediately adjacent set sizes did not reach significance. During both the delay and the retrieval periods, the activity showed significant increases from set size 1 to 3 (t(9) = 3.0, t(9) = 2.3 (for delay and retrieval respectively) Ps < 0.01), and 3 to 5 (t(9) = 1.9, P < 0.05 for the delay, t(9) = 1.8, P = 0.05 for the retrieval), and then leveled off (t(9) = 0.05, P > 0.9 for the delay, t(9) = 0.4, P > 0.7 for the retrieval phase) (Fig. 3b).
The results of experiment 2 demonstrate that activity in PPC can increase beyond the behaviorally defined K function. The pattern of fMRI activity in PPC differed from the activity observed in the same area with the same task but with a shorter delay period. The results were consistent in three different types of analysis. Moreover, a similar pattern of fMRI activity was observed in another brain area, in the human FEF.
7. Experiment 3
Experiment 3 was aimed at testing whether our results could be generalized to memory for spatial locations. As mentioned before, ample evidence, both behavioral and neural suggest that separate systems may be involved in storage of spatial and visual information ([Baddeley, 1992], [Courtney et al., 1996], [Smith et al., 1995] and [Tresch et al., 1993]). Nevertheless, if PPC is involved in attentional processes that mediate the increased demands of load, we would expect to find similar results with spatial STM.
8. Methods
8.1. Participants
Twelve neurologically healthy participants were tested in experiment 3 (four participated in experiments 1 and 2). All had normal or corrected-to-normal vision and gave written informed consent for participation, which was approved by the Institutional Review Panel of Princeton University.
8.2. Stimuli and design
On each trial, 1, 3, 5 or 7 black squares (0.5°) were presented in a 4 × 6 matrix (10° × 15°) either on the left or the right sides of fixation with no separation between the two sides. The density again was matched across load levels (3 items were presented in a randomly placed 3 × 4 sub-matrix within the larger 4 × 6 matrix, 5 items were presented in a 5 × 4 sub-matrix and 1 and 7 items were placed randomly in the whole 4 × 6 matrix). Each trial began with 1500 ms of fixation followed by 500 ms presentation of the memory sample. Following a delay period of 6000 ms, a single probe was presented for 2000 ms either in a previously occupied location (match condition) or a new location within the same matrix (non-match condition). Each trial was followed by 12,000 ms of fixation to allow the BOLD signal to return to baseline. The load manipulation was blocked. There were eight runs, two for each load level with 16 trials in each run. The order of presentation of the different runs was counterbalanced between subjects.
8.3. Data acquisition and analysis
Functional images were taken with a gradient echo, echoplanar sequence (TR = 1200 ms; TE = 30 ms; flip angle = 90; matrix 64 × 64 voxels). All other aspects of the data acquisition procedures were identical to the previous experiments.
8.3.1. Behavioral data
As in previous experiments, RTs and errors were collected during the scanning session. The number of items held in memory was evaluated using Cowan's K formula (Cowan, 2001).
8.3.2. FMRI data
As in previous experiments, data were analyzed using AFNI (http://afni.nimh.nih.gov/afni). Data pre-processing consisted of 3D motion correction, slice acquisition time correction, spatial smoothing with a Gaussian kernel (FWHM = 8 mm) and Talairach transformation.
For the statistical analysis, a set of square wave functions were defined for each load level in all three experiments. These functions were defined separately for each of the three phases of the task (i.e., encoding, delay and retrieval). As in experiment 2, we modeled the delay phase either on the last 2 or the last 4 s of the delay period. The resultant statistical parametric maps were virtually identical. All regressors were convolved with a gamma-variate function and used as regressors of interest in a multiple regression model (Friston et al., 1995). Several regressors were added to account for variance due to baseline shifts between time series, linear drifts within time series and head motion.
As in experiment 2, statistical analyses were based on a random-effects ANOVA using K-weighted coefficients of the group-averaged K. The K weighted coefficients analysis was conducted on the activity during the delay period. Statistical maps were thresholded using the Alphasim program included in AFNI to correct for multiple comparisons. A minimum cluster size of 77 voxels in original space was used to achieve corrected significance of P < 0.05. As in previous experiments, unless stated otherwise, all statistical comparisons on the behavioral and fMRI data are one-tailed paired-samples t-tests.
Similarly to experiment 2, the time series of fMRI signals were extracted for each load level and for each activated area. Percent signal change for each condition was calculated by normalizing the response obtained during each trial to the activity measured at the first time point of that trial. The time series were extracted separately for each participant and then averaged across individuals. The three phases of the task were defined as in experiment 2. This resulted in the following timing of the different phases: Encoding at 6 s after stimulus onset, maintenance from 8 to 11 s after stimulus onset, and retrieval at 13 s after stimulus onset.
9. Results
9.1. Behavioral results
The behavioral results in experiment 3 showed significant increases in K from set size 1 to 3 (t(11) = 8.3, P < 0.01) and 3 to 5 (t(11) = 3.7, P < 0.01) and then leveled off (t(11) = 0.5, P > 0.6) (Fig. 2c). Memory capacity in experiment 3 was marginally lower than in experiment 2 (Kmax = 2.67 and 2.91 in experiments 3 and 2 respectively), but the difference was not significant. RT increased from set size 1 to 3 (t(11) = 4.1, P < 0.01), the difference between set sizes 3 and 5 was marginally significant (t(11) = 1.5, P = 0.07), and then leveled off (t(11) = 0.7, P > 0.5 for the difference between set sizes 5 and 7).
9.2. FMRI results
The statistical parametric map of fMRI activity revealed activation in superior IPS with similar Talairach coordinates to those found in experiments 1 and 2 (Fig. 3c). The results for items presented in the left and right visual fields were similar, and were combined for the analyses. Separate analyses of the fMRI signals during the encoding, delay, and retrieval periods showed the following pattern (Fig. 3c): during the encoding and retrieval phases, the fMRI signals increased significantly from set size 1 to 3 (t(11) = 1.8, P < 0.05 for encoding, t(11) = 4.7, P < 0.01 for retrieval), and from 5 to 7 (t(11) = 1.8, P < 0.05 for encoding, t(11) = 2.1, P < 0.05 for retrieval) (although the increase between set sizes 3 and 5 did not reach significance (t(11) = 0.02, P > 0.9 for encoding, t(11) = 1.2, P > 0.3 for retrieval). During the delay period, activity showed a significant linear increase with each increase in load up to the maximum of 7, (t(11) = 3.7, P < 0.01) for the difference between set sizes 1 and 3, (t(11) = 4.7, P < 0.01) for the comparison of set sizes 3 and 5, and (t(11) = 1.9, P < 0.05) for the comparison of set sizes 5 and 7 (Fig. 2c).
The findings of experiment 3 that employed a long delay of 6000 ms mirror those of experiment 2 with the same delay length. The fMRI activity continued to increase with load from 5 to 7 items, beyond the point at which the behavioral K function leveled off.
10. Discussion
The results of the three experiments reported here yield some important findings. First, the fMRI activations involved the same regions in PPC in all three experiments, suggesting that similar processes are involved in both visual and spatial STM. Secondly, the relation between behavioral measures of recognition and the profile of fMRI load activity in superior IPS differed for short and for long delays and for different sets of stimuli, dissociating fMRI load effects from the behavioral estimates of capacity limitations. One might claim that the results merely point to the fact that behavioral measures of capacity do not always correspond to fMRI activity. However, the discrepancy is consistent: fMRI activity underestimates the behavioral measure with short delays and overestimates them with the longer delays (experiments 2 and 3). The results are consistent with the suggestion that the attentional demands of the long delay condition are greater with the increase in load and that this results in greater activity in IPS.
What is the nature of the greater attentional demands of the long delay conditions? We suggest that activity in the IPS reflects the amount of rehearsal in the STM task (Baddeley, 1986). As the delay length in the memory task increases, there is an increasing threat of loss through decay or interference. Rehearsal becomes increasingly necessary and engages additional attentional resources.
10.1. Rehearsal in STM
Several forms of rehearsal should be distinguished. With verbal or easily verbalized material, memory maintenance usually takes the form of articulatory rehearsal—of mentally repeating the names to oneself (Baddeley, 1986). When memory for visual locations is relevant, rehearsal appears to consist of shifting attention between the remembered locations (Awh & Jonides, 2001; Awh, Jonides, & Reuter-Lorenz, 1998; Awh et al., 1999). When the identity of the visual items is relevant and when verbal coding is prevented, as in the present study, rehearsal may also consist of shifting attention successively between the remembered images. If this is the case, increasing the number of items to be stored should increase the neural activity in areas that are sensitive to parametric manipulations of visual attentional shifts. Indeed, the same areas that were activated in the present study, namely the IPS and frontal eye fields (FEF) were also implicated in a study that parametrically varied attentional shifts (Beauchamp, Petit, Ellmore, Ingeholm, & Haxby, 2001). Furthermore, the same areas were also activated when attention was explicitly directed to items already stored in STM (Lepsien, Griffin, Devlin, & Nobre, 2005; Lepsien & Nobre, 2007).
We suggest that superior IPS activity represents visual attentional rehearsal processes in STM that change as a function of the delay length and the nature of the memorized representations. The rehearsal hypothesis fits the results that showed higher activity and steeper load functions in superior IPS with longer relative to shorter delays of the same task, and showed a similar activity pattern for visual and for spatial STM tasks. Our hypothesis that fMRI reflects rehearsal also entails that if participants give up on rehearsing when the load is too high or the memorized items are difficult to rehearse, the fMRI activity will drop back down. Thus fMRI activity could be higher than predicted from the behavioral estimates of capacity but also to be limited when rehearsal becomes too demanding. This could help explain the discrepancy between the results of experiments 2 and 3 of the present study and previous studies by Linden et al. (2003) and by Xu and Chun (2006).
Contrary to the present results, these studies did find a correlation of fMRI activity with behavioral capacity measures even at longer delays. However, these studies used much more complex objects than the colored circles that we used. Complex objects have been shown to yield very limited estimates of capacity (Alvarez & Cavanagh, 2004). When memory for complex objects was examined with fMRI (Linden et al., 2003; Xu & Chun, 2006), both fMRI and K estimates leveled off around set size 2. This poses the question why the fMRI activity in IPS also leveled off with only 2 items rather than increasing with increased attention demands and rehearsal caused by the more demanding task. A plausible answer is that the complex items, unlike simple items, are difficult or impossible to rehearse as wholes. Complex objects that give low estimates of VSTM capacity also give very slow visual search rates (Alvarez & Cavanagh, 2004). If search rates correlate with rehearsal rates, as seems plausible, the ability to rehearse these complex objects might be seriously curtailed. The rehearsal hypothesis could then explain why with simple objects we found PPC activity that increased with load beyond the behaviorally determined capacity limitations, whereas the studies with complex objects did not.
10.2. The number of memorized items
The findings of experiments 2 and 3 indicate that activity in PPC increased beyond the behaviorally determined measures of capacity. For instance, while the behavioral K measures in experiment 2 indicated that the same number of items was memorized in set sizes 3, 5 and 7, the level of fMRI activity in PPC varied between these load conditions. One interpretation of these findings might be that, K accurately reflects the number of memorized (and rehearsed) items, however when the initial memory display consists of more than K items rehearsal might be more demanding due to the need to suppress the excessive items.
Alternatively, the increase in activity with load may suggest that the number of items selected for rehearsal continued to increase with these higher load levels, even though recall (as indicated by K) leveled off. If so, then our estimate of the number of rehearsed items is higher than the typical estimates of STM capacity limits (around 3 or 4 items), suggesting that errors due to retrieval processes also limit the estimate of STM capacity. Several lines of evidence, presented below, support the suggestion that more than K items may be maintained during the delay period of a STM task.
One method that allows a more accurate estimation of the number of memorized items, introduces cues during the maintenance period (termed retro-cues), that direct attention to one of the memorized items (Griffin & Nobre, 2003). When the retro-cue validly indicates the location of the to-be probed item, performance improves both in terms of RT and accuracy, compared to conditions in which the cue is neutral, invalid or absent (Griffin & Nobre, 2003; Landman, Spekreijse, & Lamme, 2003; Lepsien et al., 2005; Lepsien & Nobre, 2007; Makovski & Jiang, 2007; Makovski, Sussman, & Jiang, 2008; Matsukura, Luck, & Vecera, 2007; Sligte, Scholte, & Lamme, 2008). Performance is enhanced even when the cues appear several seconds into the delay period, long after the iconic trace of the memory display had decayed. Hence, the beneficial effect of the retro-cue suggests that capacity (during the delay period) is larger than that estimated in a typical non-cued VSTM task. The cue has been suggested to enhance performance by protecting the cued items from degradation, distraction, and from being overwritten by the probe display ([Makovski et al., 2008] and [Matsukura et al., 2007]). Importantly, all the studies employing retro-cues demonstrate that measures of capacity in standard change detection tasks may underestimate the number of maintained items.
Additionally, a recent study of attention to locations (Franconeri, Alvarez, & Enns, 2007) showed that the number of locations that can be selected for short retention intervals depends on the resolution that the task required, with up to 7 locations available when resolution is low. The stimuli in experiment 3 were quite sparse, which should allow the selection and rehearsal of up to seven locations. Memory for both colors and locations may require a higher resolution than spatial locations alone, which may explain why the rehearsal limit was 5 in experiment 2. Furthermore, spatial memory may also differ from memory for color identities in allowing storage of configural groups and relative locations. This could help explain why rehearsal-based activity is higher with locations than with colors.
The assumption that the increased activity in PPC indicates that more items than those estimated by K are rehearsed during the delay period, should not be taken as evidence that PPC actually represents the number of memorized items. This sort of interpretation of our findings cannot account for the underestimation of the behavioral measures of capacity in the short delay experiment. If the activity in PPC represents the number of items in memory, it should always increase monotonically with K. However, the activity in PPC in the short delay experiment underestimated the behaviorally determined K measures. Taken together, the results of the three experiments support our claim that PPC activity represents an active process that was less pronounced in the short delay experiment (hence the underestimation of K) and was more pronounced in the longer delay experiments (which resulted in the over estimation of K).
In contrast to previous suggestions (Todd & Marois, 2004; Xu & Chun, 2006) PPC is assumed to take part in rehearsal in STM, rather than serve as a limited capacity store. Consequently, we must assume that the memorized items are stored elsewhere in the brain. Following several lines of evidence, one possibility is that PPC, together with prefrontal cortex, may be engaged in biasing attentional resources towards more posterior sensory areas where the items are maintained (Awh & Jonides, 2001; Curtis & D'Esposito, 2003; Lepsien & Nobre, 2007). Several studies have shown sensory specific sustained activity in posterior visual areas that was sustained even in the face of distraction (Yoon, Curtis, & D'Esposito, 2006). Furthermore, a recent study has demonstrated that orienting attention in STM toward the memorized items modulates activity in sensory areas that process those items (Lepsien & Nobre, 2007).
10.3. Individual versus group analysis in VSTM
The correlation between behavioral K measures and fMRI activity has been examined with two approaches. One approach (Todd & Marois, 2004) used the group averaged K measures and another (Xu & Chun, 2006) used the individually K-defined ROI. From the present results and these previous studies the two methods seem to yield similar results. Activity in PPC levels off at low load conditions in the short delay experiments, regardless whether a group analysis or an individual analysis approach is taken. Here in experiment 2, again both the group analysis and the individual analysis approach showed the same deviation of PPC activity from the behavioral K measures of capacity.
10.4. Relation to previous studies
The present study emphasizes the importance of PPC in mediating the increasing demands of rehearsal with increasing load and delay length. However, it may not be the only area involved. In experiment 2 we observed an additional area in the human FEF that was also influenced by the load manipulation, and that we assume is also involved in visual rehearsal of stored items. Several other areas within frontal and prefrontal cortex also appear to be sensitive to load manipulations in spatial, visual and verbal STM tasks (Cohen et al., 1997; Jha & McCarthy, 2000; Leung, Seelig, & Gore, 2004; Linden et al., 2003). Indeed, the superior IPS and FEF may represent only one link involved in attentional rehearsal of memorized items, in a network of areas that respond to increases in STM load.
The comparison of experiments 1 and 2 indicates that STM delay length has an impact on the pattern of fMRI activity. The effect of delay may, however, not increase monotonically. If the pattern of rehearsal changes as the delay increases, so will the fMRI activity. It is conceivable that even longer delays than those examined here will engage other mechanisms and show different patterns of activity. With delays of 15,000 ms, a study on memory for multicolored shapes found reduced activity in more posterior and parietal areas relative to delays of 5000 ms, and more activity in temporal lobes and ventrolateral frontal cortices (Elliot & Dolan, 1999). Another study examined STM for faces with extended delays of 15,000 (Jha & McCarthy, 2000). The load effect in parietal areas in this study dissipated towards the end of the delay. These studies further support the notion that STM tasks with different delays should be considered as distinct tasks that may recruit different neural mechanisms.
Taken together, the results have important implications for the nature of representations in VSTM. The estimate of K has been taken to imply that a small number of items are stored with high-fidelity in VSTM ([Cowan, 2001] and [Pashler, 1988]). The alternative we propose is that a larger number of items than is estimated from K may be stored and rehearsed, and that errors due to retrieval processes also limit performance. The linear increase in RT as a function of load in experiments 1 and 2 and in other studies (Linden et al., 2003; Todd & Marois, 2004), even at set sizes beyond capacity, suggests that participants may search through a larger set than K items during retrieval (Sternberg, 1966). Finally, the results of the present study reopen the question of whether storage limits as such are represented in the brain and if so whether they are represented in a single area of the STM network, or whether capacity limitations result from a number of different cognitive processes and activation in a widespread network mediating short-term memory.
Acknowledgments
This work was supported by grants to A.T. (NIH grant 2RO1 MH 058383, 1RO1 MH 062331) and to S.K. (1RO1 MH64043, 2P50 MH-62196).
References
- Alvarez GA, Cavanagh P. The capacity of visual short-term memory is set both by visual information load and by number of objects. Psychological Science. 2004;15:106–111. doi: 10.1111/j.0963-7214.2004.01502006.x. [DOI] [PubMed] [Google Scholar]
- Awh E, Jonides J. Overlapping mechanisms of attention and spatial working memory. Trends in Cognitive Sciences. 2001;5:119–126. doi: 10.1016/s1364-6613(00)01593-x. [DOI] [PubMed] [Google Scholar]
- Awh E, Jonides J, Reuter-Lorenz PA. Rehearsal in spatial working memory. Journal of Experimental Psychology: Human Perception & Performance. 1998;24:780–790. doi: 10.1037//0096-1523.24.3.780. [DOI] [PubMed] [Google Scholar]
- Awh E, Jonides J, Smith EE, Buxton RB, Frank LR, Love T, et al. Rehearsal in spatial working memory: Evidence from neuroimaging. Psychological Science. 1999;10:433–437. [Google Scholar]
- Baddeley A. Working memory. Oxford University Press; Oxford: 1986. [Google Scholar]
- Baddeley A. Is working memory working? The fifteenth Bartlett lecture. Quarterly Journal of Experimental Psychology. 1992;44B:1–31. [Google Scholar]
- Beauchamp MS, Petit L, Ellmore TM, Ingeholm J, Haxby JV. A parametric fMRI study of overt and covert shifts of visuospatial attention. Neuroimage. 2001;14:310–321. doi: 10.1006/nimg.2001.0788. [DOI] [PubMed] [Google Scholar]
- Brainard DH. The Psychophysics Toolbox. Spatial Vision. 1997;10:433–436. [PubMed] [Google Scholar]
- Cohen JD, Perlstein WM, Braver TS, Nystrom LE, Noll DC, Jonides J, et al. Temporal dynamics of brain activation during a working memory task. Nature. 1997;386:604–608. doi: 10.1038/386604a0. [DOI] [PubMed] [Google Scholar]
- Corbetta M, Shulman GL. Control of goal-directed and stimulus-driven attention in the brain. Nature Neuroscience. 2002;3:201–215. doi: 10.1038/nrn755. [DOI] [PubMed] [Google Scholar]
- Courtney SM, Ungerleider LG, Keil K, Haxby JV. Object and spatial visual working memory activate separate neural systems in human cortex. Cerebral Cortex. 1996;6:39–49. doi: 10.1093/cercor/6.1.39. [DOI] [PubMed] [Google Scholar]
- Courtney SM, Ungerleider LG, Keil K, Haxby JV. Transient and sustained activity in a distributed neural system for human working memory. Nature. 1997;386:608–611. doi: 10.1038/386608a0. [DOI] [PubMed] [Google Scholar]
- Cowan N. The magical number 4 in short-term memory: A reconsideration of mental storage capacity. Behavioral Brain Sciences. 2001;24:87–114. doi: 10.1017/s0140525x01003922. [DOI] [PubMed] [Google Scholar]
- Cowan N. Working memory capacity. Psychology Press; NY: 2006. [Google Scholar]
- Curtis CE, D'Esposito M. Persistent activity in the prefrontal cortex during working memory. Trends in Cognitive Sciences. 2003;9:415–423. doi: 10.1016/s1364-6613(03)00197-9. [DOI] [PubMed] [Google Scholar]
- Elliot R, Dolan RJ. Differential neural responses during performance of matching and nonmatching to sample tasks at two delay intervals. Journal of Neuroscience. 1999;19:5066–5073. doi: 10.1523/JNEUROSCI.19-12-05066.1999. [DOI] [PMC free article] [PubMed] [Google Scholar]
- Franconeri SL, Alvarez GA, Enns JT. How many locations can be selected at once? Journal of Experimental Psychology: Human Perception & Performance. 2007;33:1003–1012. doi: 10.1037/0096-1523.33.5.1003. [DOI] [PubMed] [Google Scholar]
- Friston J, Holmes AP, Worsley KJ, Poline JP, Frith CD, Frackowiak RSJ. Statistical parametric maps in functional imaging: A general linear approach. Human Brain Mapping. 1995;3:165–189. [Google Scholar]
- Griffin IC, Nobre AC. Orienting attention to locations in internal representations. Journal of Cognitive Neuroscience. 2003;15:1176–1194. doi: 10.1162/089892903322598139. [DOI] [PubMed] [Google Scholar]
- Jha AP, McCarthy G. The influence of memory load upon delay-interval activity in a working-memory task: An event-related functional MRI study. Journal of Cognitive Neuroscience. 2000;12:90–105. doi: 10.1162/089892900564091. [DOI] [PubMed] [Google Scholar]
- Jolicoeur P, Dell'Acqua R. The demonstration of short-term consolidation. Cognitive Psychology. 1998;36:138–202. doi: 10.1006/cogp.1998.0684. [DOI] [PubMed] [Google Scholar]
- Jonides J, Lacey SC, Nee DE. Processes of working memory in mind and Brain. Current Directions in Psychological Science. 2005;14:2–5. [Google Scholar]
- Kastner S, Ungerleider LG. Mechanisms of visual attention in the human cortex. Annual Review of Neuroscience. 2000;23:315–341. doi: 10.1146/annurev.neuro.23.1.315. [DOI] [PubMed] [Google Scholar]
- LaBar KS, Gitelman DR, Parrish TB, Mesulam M. Neuroanatomic overlap of working memory and spatial attention networks: A functional MRI comparison within subjects. Neuroimage. 1999;10:695–704. doi: 10.1006/nimg.1999.0503. [DOI] [PubMed] [Google Scholar]
- Landman R, Spekreijse H, Lamme VAF. Large capacity storage of integrated objects before change blindness. Vision Research. 2003;43:149–164. doi: 10.1016/s0042-6989(02)00402-9. [DOI] [PubMed] [Google Scholar]
- Lepsien J, Griffin IC, Devlin JT, Nobre AC. Directing spatial attention in mental representations: Interactions between attentional orienting and working-memory load. Neuroimage. 2005;26:733–743. doi: 10.1016/j.neuroimage.2005.02.026. [DOI] [PubMed] [Google Scholar]
- Lepsien J, Nobre AC. Attentional modulation of object representations in working memory. Cerebral Cortex. 2007;17:2072–2083. doi: 10.1093/cercor/bhl116. [DOI] [PubMed] [Google Scholar]
- Leung HC, Seelig D, Gore JC. The effect of memory load on cortical activity in the spatial working memory circuit. Cognitive Affective & Behavioral Neuroscience. 2004;4:553–563. doi: 10.3758/cabn.4.4.553. [DOI] [PubMed] [Google Scholar]
- Linden DEJ, Bittner RA, Muckli L, Waltz JA, Kriegeskorte N, Goebel R, et al. Cortical capacity constraints for visual working memory: Dissociation of fMRI load effects in a fronto-parietal network. Neuroimage. 2003;20:1518–1530. doi: 10.1016/j.neuroimage.2003.07.021. [DOI] [PubMed] [Google Scholar]
- Makovski T, Jiang YV. Distributing versus focusing attention in visual short-term memory. Psychonomic Bulletin & Review. 2007;14:1072–1078. doi: 10.3758/bf03193093. [DOI] [PubMed] [Google Scholar]
- Makovski T, Sussman R, Jiang YV. Orienting attention in visual working memory reduces interference from memory probes. Journal of Experimental Psychology: Learning Memory and Cognition. 2008;34:369–380. doi: 10.1037/0278-7393.34.2.369. [DOI] [PubMed] [Google Scholar]
- Matsukura M, Luck SJ, Vecera SP. Attention effects during visual short-term memory maintenance: Protection or prioritization? Perception & Psychophysics. 2007;69:1422–1434. doi: 10.3758/bf03192957. [DOI] [PMC free article] [PubMed] [Google Scholar]
- Pashler H. Familiarity and visual change detection. Perception & Psychophysics. 1988;44:369–378. doi: 10.3758/bf03210419. [DOI] [PubMed] [Google Scholar]
- Pessoa L, Gutierrez E, Bandettini PA, Ungerleider LG. Neural correlates of visual working memory: fMRI amplitude predicts task performance. Neuron. 2002;35:975–987. doi: 10.1016/s0896-6273(02)00817-6. [DOI] [PubMed] [Google Scholar]
- Phillips WA. On the distinction between sensory storage and short-term visual memory. Perception & Psychophysics. 1974;16:283–290. [Google Scholar]
- Sligte IG, Scholte HS, Lamme VAF. Are there multiple visual short-term memory stores? PloS ONE. 2008;3:e1699. doi: 10.1371/journal.pone.0001699. [DOI] [PMC free article] [PubMed] [Google Scholar]
- Smith EE, Jonides J, Koeppe RA, Awh E, Schumacher EH, Minoshima S. Spatial versus object working memory: PET investigations. Journal of Cognitive Neuroscience. 1995;7:337–356. doi: 10.1162/jocn.1995.7.3.337. [DOI] [PubMed] [Google Scholar]
- Sternberg S. High-speed scanning in human memory. Science. 1966;153:652–654. doi: 10.1126/science.153.3736.652. [DOI] [PubMed] [Google Scholar]
- Talairach J, Tournoux P. In: Co-planar stereoaxis atlas of the human brain. Rayport M, translator. NY: Thieme Medical; 1988. [Google Scholar]
- Todd JJ, Marois R. Capacity limit of visual short-term memory in human posterior parietal cortex. Nature. 2004;428:751–754. doi: 10.1038/nature02466. [DOI] [PubMed] [Google Scholar]
- Treisman A, Zhang W. Location and binding in visual working memory. Memory & Cognition. 2006;34:1704–1719. doi: 10.3758/bf03195932. [DOI] [PMC free article] [PubMed] [Google Scholar]
- Tresch MC, Sinnamon HM, Seamon JG. Double dissociation of spatial and object visual memory: Evidence from selective interference in intact human subjects. Neuropsychologia. 1993;31:211–219. doi: 10.1016/0028-3932(93)90085-e. [DOI] [PubMed] [Google Scholar]
- Ungerleider LG, Courtney SM, Haxby JV. A neural system for human visual working memory. Proceeding of the National Academy of Sciences of the United States of America. 1998;95:883–890. doi: 10.1073/pnas.95.3.883. [DOI] [PMC free article] [PubMed] [Google Scholar]
- Vogel EK, Woodman GF, Luck SJ. Storage of features, conjunctions and objects in visual working memory. Journal of Experimental Psychology: Human Perception & Performance. 2001;27:92–114. doi: 10.1037//0096-1523.27.1.92. [DOI] [PubMed] [Google Scholar]
- Vogel EK, Woodman GF, Luck SJ. Time course of consolidation in visual working memory. Journal of Experimental Psychology: Human Perception & Performance. 2006;32:1436–1451. doi: 10.1037/0096-1523.32.6.1436. [DOI] [PubMed] [Google Scholar]
- Wheeler ME, Treisman A. Binding in short-term visual memory. Journal of Experimental Psychology: General. 2002;131:48–64. doi: 10.1037//0096-3445.131.1.48. [DOI] [PubMed] [Google Scholar]
- Xu Y, Chun M. Dissociable neural mechanisms supporting visual short-term memory for objects. Nature. 2006;440:91–95. doi: 10.1038/nature04262. [DOI] [PubMed] [Google Scholar]
- Yoon JH, Curtis CE, D'Esposito M. Differential effects of distraction during working memory on delay-period activity in the prefrontal cortex and the visual association cortex. Neuroimage. 2006;29:1117–1126. doi: 10.1016/j.neuroimage.2005.08.024. [DOI] [PubMed] [Google Scholar]
- Zarahn E, Aguirre G, D'Esposito M. A trial-based experimental design for fMRI. Neuroimage. 1997;6:122–138. doi: 10.1006/nimg.1997.0279. [DOI] [PubMed] [Google Scholar]