Abstract
Right ventricular dysfunction is one of the more common causes of heart failure in patients with congenital heart defects. Use of computer-assisted procedures is becoming more popular in clinical decision making process and computer-aided surgeries. A 3D in vivo MRI-based RV/LV combination model with fluid-structure interaction (FSI), RV-LV interaction, and RV-patch interaction was introduced to perform mechanical analysis for human right ventricle with potential clinical applications. Patient-specific RV/LV morphologies were acquired by using planar tagged MRI. The 3D RV/LV FSI model was solved using a commercial finite element package ADINA. Our results indicated that flow and stress/strain distributions in the right ventricle are closely related to RV morphology, material properties and blood pressure conditions. Patches with material properties better matching RV tissue properties and smaller size lead to better RV function recoveries. Computational RV volumes showed very good agreement with MRI data (error < 3%). More patient studies are needed to establish baseline database so that computational simulations can be used to replace empirical and often risky clinical experimentation to examine the efficiency and suitability of various reconstructive procedures in diseased hearts and optimal design can be found.
Keywords: Human right ventricle, heart model, blood flow, fluid-structure interaction, MRI
1. Introduction
Heart disease is the number one killer in the United States. Heart attacks kill nearly a million Americans a year - rich and poor, the famous and the forgotten. In fact, cardiovascular disease is so common that 64 million Americans suffer from some form of it (and 39 million of these people are age 65 or younger). Right ventricular dysfunction is one of the more common causes of heart failure in patients with congenital heart defects. Computational modeling and medical imaging technologies have made considerable advances in biological and clinical research in recent years [1,5,12–13]. Use of computer-assisted procedures is becoming more and more popular in clinical decision making process and computer-aided surgeries. Early 3D models for blood flow in the heart include Peskin’s model which introduced fiber-based LV model and the celebrated immersed boundary method to study blood flow features in an idealized geometry with fluid structure interactions [9]. More recent efforts included MRI-based fluid-only or structure-only 3D models and some basic flow and stress/strain behaviors were investigated [10–11,15]. McCulloch et al provided an excellent review and also performed extensive research for 3D ventricular geometry and myofiber architecture of the rabbit heart. Their work included experimental and modeling studies of 3D cardiac mechanics and electrophysiology [8, 14–15]. In a special issue, Westerhof and papers cited in the editorial provided up-to-date reviews for various aspects of cardiovascular research including clinical significance of local stress/strain analysis and material parameter sensitivity analysis using ventricular models [16]. Due to the complexity of human heart structure and difficulties involved in acquiring human heart data and building models with both flow and structure included, patient-specific heart models with fluid-structure interactions (FSI) are still lacking in the literature.
In this paper, a 3D MRI-based patient-specific FSI model for human right ventricle (RV) was introduced to analyze flow and structure stress/strain distributions and assess RV functions for optimal surgery design. The left ventricle (LV) was included in our model (therefore it is called a RV/LV combination model) so that the RV structure can be set in a more realistic supporting environment and RV-LV interactions can be investigated when patient data becomes available. Different patches were put on the RV to evaluate their effects on 3D blood flow velocity, pressure, and detailed stress/strain distributions in the right ventricle. The RV/LV FSI model was solved by ADINA (ADINA R & D, Watertown, MA), a commercial finite element package which is especially suitable for problems with fluid-structure interactions and large strain and deformations. Based on the solutions, mechanical analysis was performed to analyze cardiac functions of the right ventricle. This computational simulation could be used to replace empirical and often risky clinical experimentation to examine the efficiency and suitability of various reconstructive procedures in diseased hearts so that optimal design could be found. Our final goal is to apply this methodology in computer-aided cardiac surgery planning to reach optimal design in patients with right ventricular dysfunction from congenital heart defects.
2. Models and Methods
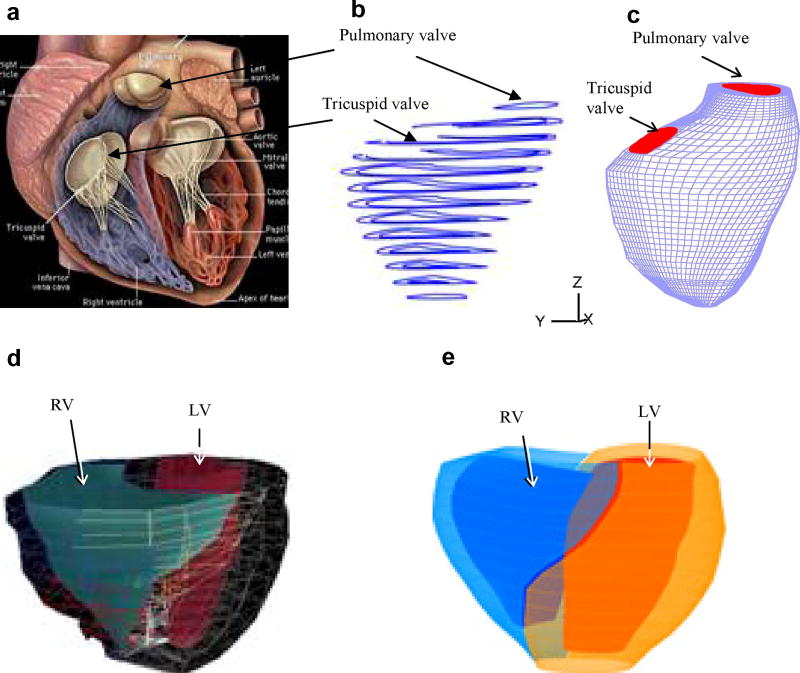
RV/LV morphology of a healthy human volunteer was acquired by using planar tagged MRI. Segmentation and 3D motion reconstruction were performed following procedures described in [5]. 10 positions of the RV/LV were acquired during one cardiac cycle, with each position containing 10–14 planar slices. 3D geometry of the RV/LV combination and computational mesh were constructed following the procedures in [12]. Fig. 1 shows a figure of a human heart, segmented MRI contour plot of a right ventricle, RV valve positions and 3D FE mesh, and the re-constructed 3D geometry of the RV/LV combination model. The RV/LV material was assumed to be hyperelastic, isotropic, nearly-incompressible and homogeneous. The nonlinear Mooney-Rivlin model was used to describe the nonlinear material properties of the muscle with parameters chosen to match experimental data available [6,11]. The strain energy function for the modified Mooney-Rivlin model is given by [2,11]:
| (1) |
| (2) |
where I1 and I2 are the first and second strain invariants, C =[Cij] = XTX is the right Cauchy-Green deformation tensor, X=[Xij] = [∂xi/∂aj], (xi) is current position, (ai) is original position, ci and Di are material parameters chosen to match experimental measurements [6,11]. The 3D stress/strain relations can be obtained by finding various partial derivatives of the strain energy function with respect to proper variables (strain or stretch components). In particular, setting material density ρ = 1 g • cm−3 and assuming,
Figure 1.
Basic plots showing the modeling procedure. (a) A human heart sketch showing left and right ventricles with valve positions; (b) segmented RV MRI contour plots; (c) 3D finite element mesh for the right ventricle showing valve positions; (d) RV/LV geometry from MRI; (e) the re-constructed 3D geometry of the RV/LV combination model.
| (3) |
where λ1, λ2 and λ3 are stretch ratios in the (x,y,z) directions respectively, the uni-axial stress/stretch relation for an isotropic material is obtained from Equation (1),
| (4) |
The parameter values and stress-stretch curves fitting the experimental data are given by Fig. 2.
Figure 2.
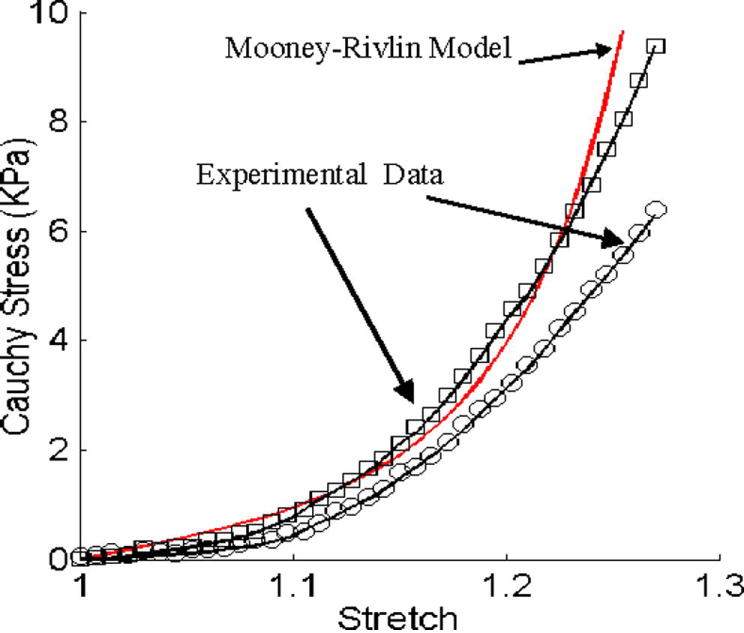
Experimental data for RV material properties and the stress-stretch curve derived from the Mooney-Rivlin model with parameters selected to fit experimental data. Parameter values used for the Mooney-Rivlin model: c1 = 3600 dyn/cm2, D1=818 dyn/cm2, c2 = 0, D2 = 12.
For problems with moving meshes, the physical observation that conservation of flux is needed is important; and indeed for mass and momentum on the mesh as the mesh changes or the nodes change positions. This requirement is well fulfilled using the FCBI elements and the FSI formulation in ADINA. Details of FCBI elements and the techniques achieving conservation of flux can be found fro [3,4].
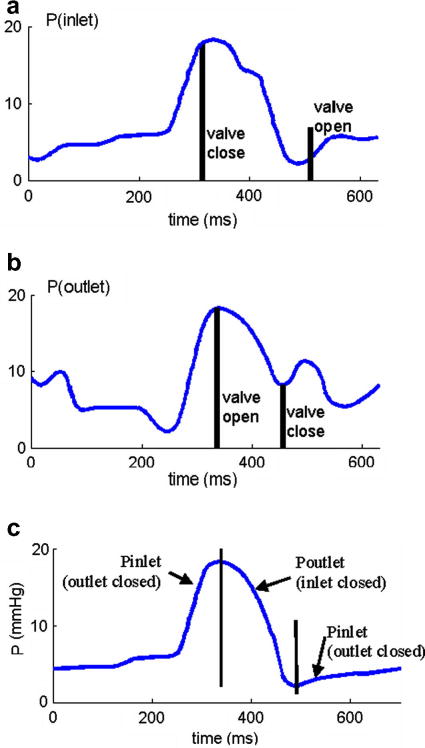
Blood flow in the right ventricle was assumed to be laminar, Newtonian, viscous and incompressible. The Navier-Stokes equations with ALE formulation were used as the governing equations. Computational pressure conditions were prescribed at the tricuspid (inlet) and pulmonary (outlet) valves matching recorded experimental data [7]. The recorded and imposed numerical pressure conditions are given in Fig. 3. To simplify the computational model, the cardiac cycle was split into two phases:
Figure 3.
Recorded and prescribed pressure conditions at the tricuspid (inlet) and pulmonary (outlet) valves. Prescribed numerical pressure conditions and valve close/open times were modified from the recorded data so that pressure conditions were as consistent with the recorded data as possible. The vertical bars in (c) indicate valve open/close switch time.
The filling phase when blood was flowing into RV, the inlet was kept open and the outlet was closed;
The ejection phase when blood was ejected out of RV, the outlet was kept open and the inlet was closed.
When the inlet or outlet was closed, flow velocity was set zero at the valve and pressure was left unspecified:
| (5) |
| (6) |
Blood flow in LV was not included in our model to reduce the size of the computational code and total CPU time. A uniform pressure was specified inside LV to keep its shape. No-slip boundary conditions and natural force boundary conditions [2] were specified at all interfaces to couple fluid, RV, LV, and the patch models together.
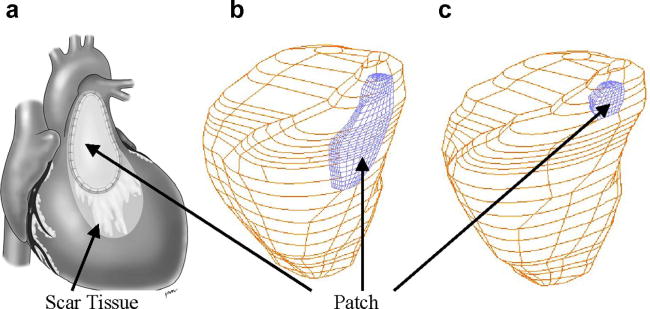
Fig. 4 shows a RV with patches put at a location below the pulmonary valve (outlet) which is where a patch is needed associated with pulmonary valve replacement surgeries. The location, size and shape of a patch on the right ventricle were designed based on experience and guidance from Dr. Del Nido, a cardiovascular surgeon with 20 years of experience and practice. The modified Mooney-Rivlin model was also used for the patch material with parameters adjusted to reflect the stiffness variations.
Figure 4.
RV patch shape and locations. (a) A diseased RV with a patch and scar tissues; (b) RV with a large patch; (c) RV with a small patch.
The fully-coupled RV/LV FSI model which consists of the fluid model, RV, LV, and patch models and all the associated boundary conditions and material constitutive laws were solved by ADINA using unstructured finite elements and the Newton-Raphson iteration method. ADINA uses nonlinear incremental iterative procedures to handle fluid-structure interactions. ADINA has been tested by hundreds of real-life applications and has been used by Tang to solve many FSI models. Details for the models and solution methods are given in [2, 4, 12].
3. Results
Our simulation cycle actually starts when RV has its smallest volume corresponding to the minimum inlet pressure (t=480 ms). As the inlet pressure increases (inlet is kept open), blood fills into RV and its volume increases. When time comes to the “switch” point, tricuspid valve (inlet) closes and pulmonary valve (outlet) opens up. Blood gets ejected out and RV volume decreases. That completes the cycle. While the mechanism driving the RV motion in our model is different from the real heart, we can still make the simulated RV motion, deformation, and fluid flow to match measured patient-specific data with proper pressure conditions and material parameters. Simulations were conducted under various pressure and material conditions, with variations in patch geometry and stiffness to investigate their effects on RV functions.
3.1 Baseline solutions from the RV/LV FSI model without patch
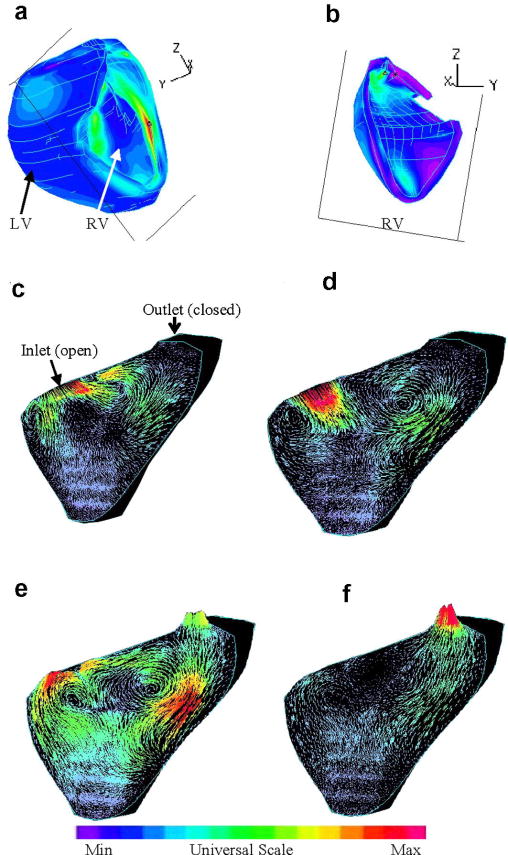
Preliminary results from our baseline RV/LV FSI model without patch are given below to demonstrate the basic features of the solutions. While the entire 3D solution domain will need to be carefully searched to seek and identify critical information which may be useful in surgical planning and surgery optimization, Figures 5(a)-(b) show the position of a cut-surface chosen to present our results in this paper. Since 3D solutions have complex behaviors, using selected cut-surfaces to show results is common. Figures 5(c)-(f) give some interesting flow patterns in the filling-ejection cycle. At t=0.1s, the pressure gradient is small, filling is slow. As the pressure gradient increases, flow velocity at the inlet increases which drives the flow in the RV and two vortices are observed (t=0.35s). When the inlet closes and outlet just opens up (t=0.37s), another vortex forms near the inlet and flow starts to eject from the outlet. At t=0.39 s, ejection becomes stronger.
Figure 5.
Velocity plots on a cut surface at different phases showing interesting flow patterns. (a)-(b) The position of the cut-surface, left and right views; (c) beginning of the filling phase; (d) flow patterns just before the ending of filling phase; (e) beginning of the ejection phase. The inlet was just closed. The outlet valve is open; (f) ejection continues.
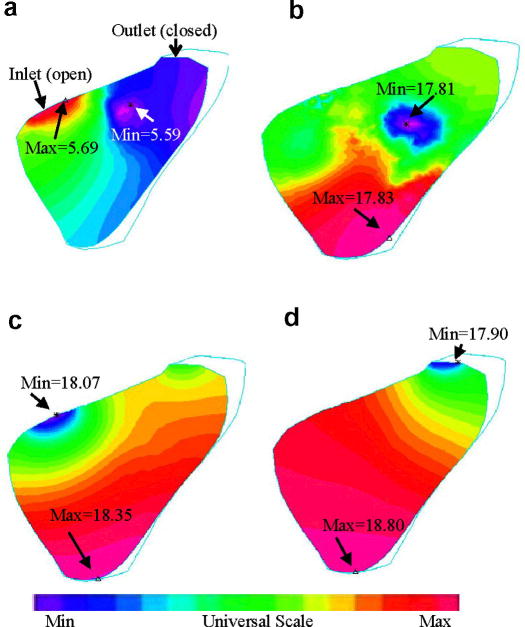
Fig. 6 gives pressure contour plots on the cut-surface corresponding to the velocity plots given by Fig. 5. At t=0.1s, maximum pressure is found at the inlet. Minimum pressure was found at the inlet when it was closed and ejected started. At t=0.39 s, minimum pressure was found at the outlet as ejection continued.
Figure 6.
Contour plots of pressure distributions on the cut surface corresponding to different RV filling and ejection phases as shown in Fig. 5. Unit for pressure: mmHg.
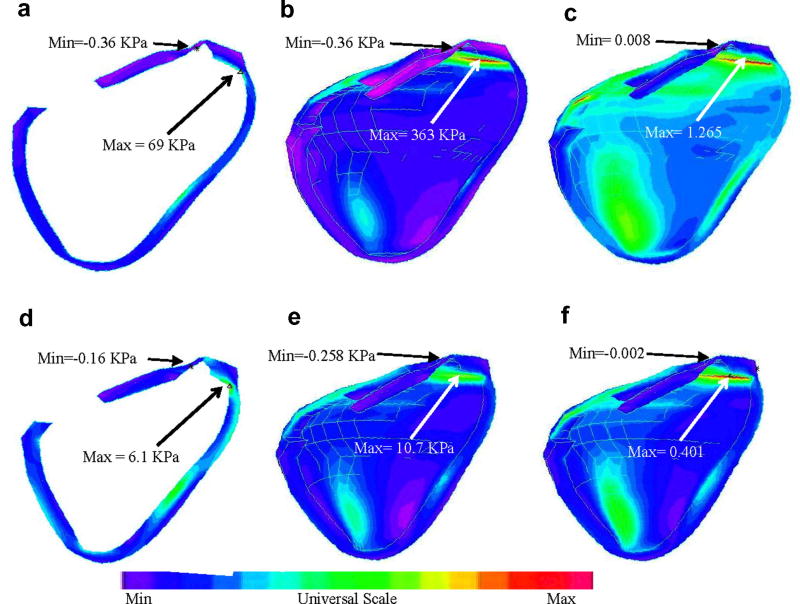
Stress/strain distributions on the transverse view as well as on the inner surface of the cut portion corresponding to both maximum and minimum pressure conditions are given by Fig. 7. The figures were flipped horizontally so that they could have the same positions as those in Figures 5–6. Maximum stress and strain conditions were found near the outlet (Figures 7(b–c) & (e–f)) and where surface curvature was large (see Figures 7(a) & (d)). Maximum of the maximum principal stress distribution (Stress-P1) from Fig. 7(b) is 33 times higher than that from Fig. 7(e). Maximum Strain-P1 (maximum principal strain) from Fig. 7(c) is almost 3 times of the maximum Strain-P1 value from Fig. 7(f). The large variation of stress/strain values indicates that there are a lot of information contained in the stress/strain distributions with the potential to be used for mechanical analysis of patch design and RV function analysis.
Figure 7.
Stress/strain distributions in the RV may provide useful information for mechanical analysis and disease state assessment. (a) Transverse view of Stress-P1 under maximum pressure; (b) Stress-P1 on the inner surface of RV under maximum pressure; (c) Strain-P1 on the inner surface of RV under maximum pressure; (d)-(f) Stress/Strain plots corresponding to minimum pressure condition.
3.2. The patched RV/LV FSI model
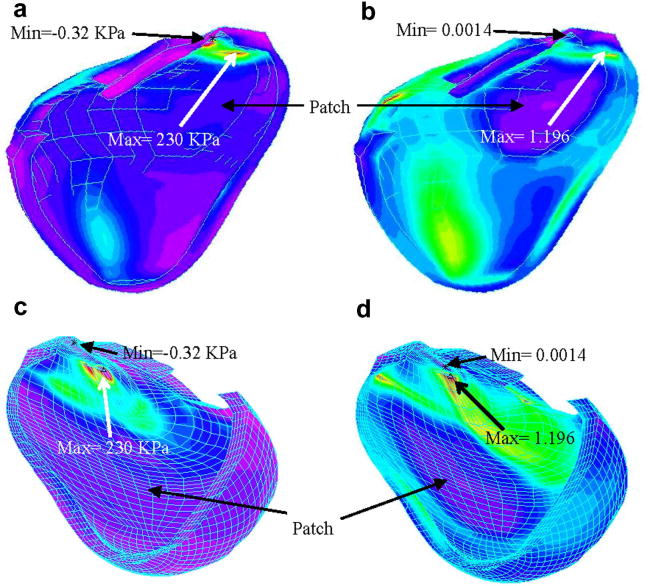
Fig. 4 gave a drawing of a diseased RV with scar tissues and a patch (Fig. 4(a)) and a computational patch model with patch at a similar location (Fig. 4(c)). The patch material was made 10 times stiffer than the RV muscle material. Our results indicated that flow patterns and pressure distributions in the patched RV were similar to that in the RV without patch, with reduced total RV volume variations. Fig. 8 gives Stress-P1 and Strain-P1 distributions obtained from the patched FSI model indicating that the maximum of Stress-P1 on the cut-surface is about 37% lower than that from the RV without patch. Maximum Strain-P1 is also slightly lower (about 5% lower). These results indicate that the maximum-value approach may not lead to critical information needed to analyze the effects of a patch on RV functions and mechanical conditions.
Figure 8.
Stress-P1 and Strain-P1 distributions in the RV with a patch.
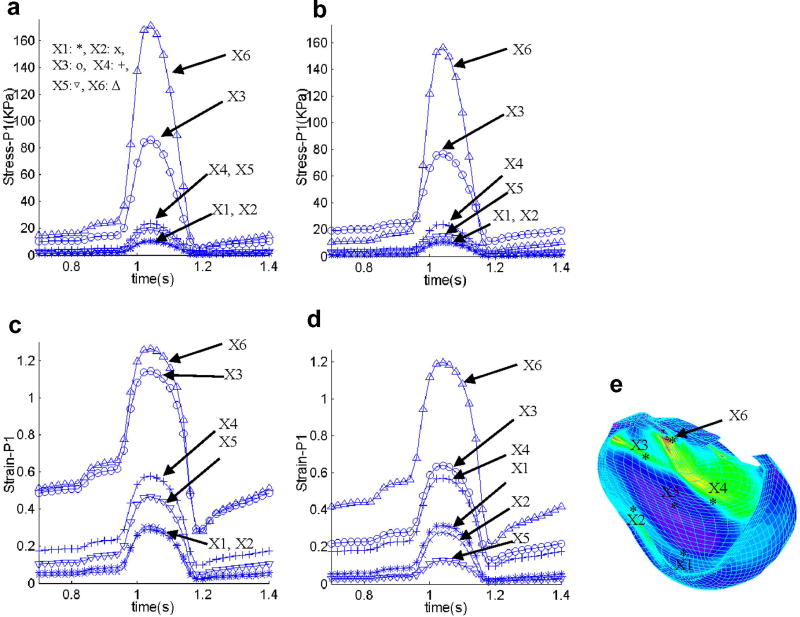
Using a critical site tracking (CST) method introduced in our atherosclerotic plaque mechanical analysis and assessment [13], we turn our attention to local stress/strain behaviors in the RV. This critical site tracking method reduces the 3D data mining to stress/strain analysis at selected sites and may be computationally essential in the process of identifying critical stress/strain information useful for patch design and optimization. 6 locations (see Fig. 9(e)) were selected to track stress/strain variations, with 4 sites located at the 4 sides of the patch (X1 – X4), and 1site at the center of the patch (X5), and one site near the maximum Strain-P1 location (X6). Fig. 6 gives Stress-P1 and Strain-P1 tracked at the 6 selected sites from the no-patch model and the patch model over a cardiac cycle providing local stress/strain behaviors. Differences of stress/strain variations at different locations can be as much as 1000% (10 times) in one cardiac cycle giving rich information for RV and patch analysis and assessment. Stress/strain behaviors are closely related to RV geometry, valve locations, patch size, location and stiffness parameters.
Figure 9.
Stress-P1 and Strain-P1 tracked at 6 selected sites from the no-patch model and the patch model over a cardiac cycle providing local stress/strain behaviors. Differences of stress/strain variations at different locations can be as much as 1000% (10 times) in one cardiac cycle giving rich information for RV and patch analysis and assessment.
3.3. RV cardiac function analysis, RV volume and ejection fractions
The main function of the heart is to provide blood to human body. Two major measures of RV functions are its volume variations and ejection fractions. Stroke volume (SV) and ejection fraction (EF) are defined as:
| (7) |
| (8) |
where RVEDV= RV diastolic (maximal) volume and RVESV= RV systolic (minimal) volume. Simulations were conducted for 5 cases: Case 1, the baseline model without a patch, the healthy RV; Case 2, RV with scar tissue and old patch as shown by Fig. 4(a) (illustrative), the diseased RV needing surgery. Patch and scar stiffness were chosen to be 10 and 5 times of that of RV tissue, respectively. Scar tissue material was made stiffer reflecting its loss of contractibility; Case 3, RV with a new patch (Fig. 4(b)); Case 4, RV with a smaller patch (Fig. 4(c)); Case 5, RV with a softer patch better matching RV tissue compliance, patch shape is the same as in Case 2, patch stiffness is only 2 times stiffer than RV tissue. SV, EF values and their relative improvements with different patches are listed in Table 1. The time-dependent RV volume curves for the 5 cases are compared in Fig. 10. Our results indicate that the healthy RV has the highest SV and EF, followed by the soft patch, small patch, the large patch case, and the pre-operative case with scar tissue/patch. From these computations we concluded that and RV patch of smaller size and material compliance closer to RV tissue leads to greater improvements in RV function. The soft patch resulted in an impressive 72% EF and 71% SV relative recovery rate, respectively. These results (verifiable by MRI data, see Section D) provide clear measurement of critical RV function indices, and give initial evidence that the proposed surgical procedures and modeling approach may lead to realistic improvement of RV cardiac function following RV remodeling surgery. The results should be interpreted very carefully with consideration given to our FSI model assumptions. More will be given in the discussion section.
Table 1.
Comparison of ejection fraction and stroke volume for five cases considered. Case 1: the healthy RV; Case 2: the diseased RV needing surgery; Cases 3–5: different patch choices leading to various degrees of RV function recovery.
| Cases considered: | Case 1 | Case 2 | Case 3 | Case 4 | Case 5 |
|---|---|---|---|---|---|
| Normal Tissue | Scar+old Patch | New Patch | Small Patch | Soft Patch | |
| Ejection Fraction (%) | 52.7 | 44.9 | 47.7 | 48.6 | 50.5 |
| EF Recovery | 100% | 0% | 35% | 49% | 72% |
| Stroke volume (ml) | 39.7 | 28.5 | 32.2 | 33.5 | 36.4 |
| SV Recovery | 100% | 0% | 33% | 45% | 71% |
Figure 10.
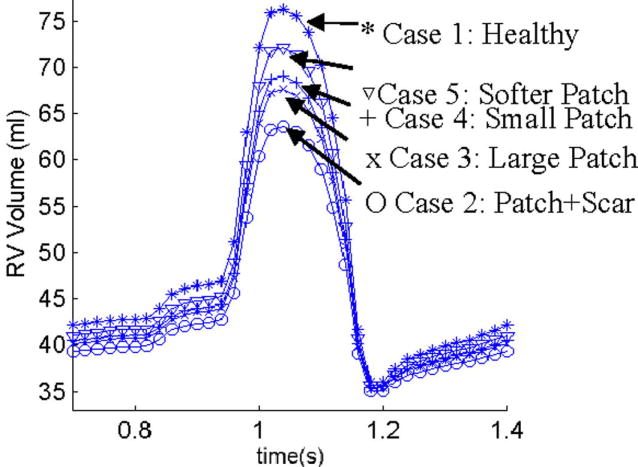
Comparison of RV volumes for 5 cases showing patches with matching material properties and smaller size lead to higher stroke volume and better RV EF recovery. Cases are defined in the text.
3.4. Patient-specific studies and model validation by MRI data
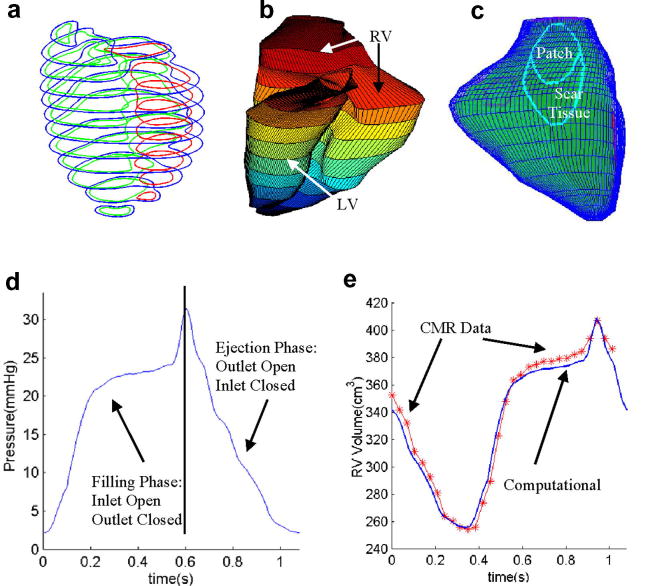
Initial model validation was performed using patient-specific RV/LV morphology, pressure and RV volume data obtained by cardiac MR data (NIH project 5P50HL074734, PI - Geva, Tal; Co-Investigator – del Nido). Fig. 11 gives the RV/LV contours, re-constructed geometries, locations of patch and scar, specified pressure and comparison of computational and CMR volume curves. The agreement is very impressive (error < 3%).
Figure 11.
Model validation using patient-specific data. (a) Segmented RV/LV contours from patient-specific CMR data; (b) Reconstructed RV-LV Geometries; (c) Locations of patch and scar tissues; (d) Specified pressure conditions; (c) Computational RV volume compared with CMR data showing good agreement (error < 3%).
4. Discussion
4.1 Model limitations and possible future improvements
This is our first step to introduce fluid-structure-interactions into patient-specific RV/LV/Patch models aimed for computer-aided surgical design and optimization. Several improvements can be added to our models if needed for better accuracy and applicability: a) Valve mechanics and pulmonary regurgitation. While exact valve motion and mechanics are not included in the current model, the valve opening/closing can be controlled and adjusted to simulate pulmonary regurgitation. Our model can be adjusted so that the outlet can be made partially open in the diastole period with proper pressure conditions specified to reach measured flow and RV volume variation data. b) Fiber orientation and anisotropic models. Patient-specific fiber orientation data cannot be measured with the current technology. However, single and multi-layer (epicardium, mid-layer, and endocardium) anisotropic models could be introduced to seek possible improvement in computational prediction accuracies. ADINA has the option for anisotropic models so switching to single-layer anisotropic model will have a bearable cost (modeling effort and computing time). Anisotropic material models could be used for each layer to account for fiber orientations. It should be noted that this will lead to increased model complexity and computational cost, especially for multi-layer models. We expect that our current model and the anisotropic models would be at similar accuracy level for RV stroke volume and ejection fraction calculations since model parameters and specified conditions have to be adjusted for both models to fit CMR volume data. The potential gains and associated cost are controversial issues and it is not clear whether we have compelling reasons to adopt anisotropic models for our clinical-oriented purposes. c) Active contraction model. One way to add active contraction into our model is to introduce an external force field which is tied with fiber structure and orientations. Measurement and validation of the external force field are not currently available. We expect that the SV and EF predictions by our current model and a heart model including active contractions would again be at the same accuracy level. With the above discussions, it is reasonable to use our current model in our RV remodeling optimization process. However, we are prepared to adjust our models if necessary for further improvements.
Accuracy of in vivo measurements of RV morphology and flow data is limited with current technology. That has considerable effect on the accuracy of computational results and analysis. Clinical experience of cardiac surgeons will be important and caution should be exercised when interpreting the computational predictions.
4.2. Next step: patient-specific modeling for optimal surgery design
Patient-specific 3D MRI-based RV/LV/Patch combination models with fluid-structure interactions will be used to assess and optimize RV remodeling surgical procedures and RV outflow patch design with the ultimate goal of improving recovery of RV function after surgery. The designing procedures require four steps: (a) Upon receiving pre-operative data, a pre-operation model will be constructed. Patient-specific material parameters will be determined using measured RV pressure and volume data so that computational and CMR volume data reach good agreement (see Fig. 11). (b) Using the patient-specific model validated by pre-operation data and with guidance from Dr. del Nido, different patch models will be constructed to make predictions for post-operation outcome. (c) Computational mechanical analysis and predicted RV cardiac function improvements will be provided to Drs. del Nido and Geva for their consideration in their surgical procedure design. (d) Post-operative data will be obtained from the same patient six months after the operation to serve as short-term validation of the proposed surgical procedures. The predictive model will be adjusted (morphology, material properties, patch and scar information, pressure conditions) to improve the accuracy of computational predictions. Clinical observations and post-surgery patient recovery record will be the ultimate gold standard for validation of computational assessment and predictions. Clinical relevance and the meaning of computational findings need to be established based on large scale comparative patient studies and follow-up observations. This paper is presenting a model with the potential to be used in such clinical studies.
5. Conclusions
An in vivo MRI-based RV/LV combination model with fluid-structure, RV-LV, and RV-patch interactions was introduced to perform mechanical analysis for human right ventricle with potential clinical applications. Our preliminary results indicated that flow and stress/strain distributions in the right ventricle are closely related to RV morphology, material properties and patient blood flow/pressure conditions. Computational and CMR-measured RV volumes and ejection fractions have very good agreement (RV volume error < 3%) which shows the potential predicting power of the model. More patient studies are needed to establish reasonable baseline database so that computational results can be interpreted correctly and used in patient-specific surgical planning.
Acknowledgments
This research was supported in part by NIH – HL63095 (PJdN), 5P50HL074734 (PI - Geva, Tal; Co-Investigator – del Nido, Pedro) and NSF-China Project Nonlinear PDEs in Geometry (10371001).
Footnotes
Publisher's Disclaimer: This is a PDF file of an unedited manuscript that has been accepted for publication. As a service to our customers we are providing this early version of the manuscript. The manuscript will undergo copyediting, typesetting, and review of the resulting proof before it is published in its final citable form. Please note that during the production process errors may be discovered which could affect the content, and all legal disclaimers that apply to the journal pertain.
References
- 1.Axel L. Biomechanical dynamics of the heart with MRI. Annu Rev Biomed Eng. 2002;4:321–347. doi: 10.1146/annurev.bioeng.4.020702.153434. [DOI] [PubMed] [Google Scholar]
- 2.Bathe KJ. Finite Element Procedures. Prentice Hall; 1996. [Google Scholar]
- 3.Bathe KJ, Hou Z. A flow-condition-based interpolation finite element procedure for incompressible fluid flows. Computers & Structures. 2002;80:1267–1277. [Google Scholar]
- 4.Bathe KJ, Hou Z. Finite element developments for general fluid flows with structural interactions. Int Journal for Numerical Methods in Engineering. 2004;60:213–232. [Google Scholar]
- 5.Haber I. Three-dimensional motion reconstruction and analysis of the right ventricle from planar tagger MRI. Univ. of Pennsylvania; 2000. [DOI] [PubMed] [Google Scholar]
- 6.Humphrey JD. Cardiovascular Solid Mechanics. Springer-Verlag; New York: 2002. [Google Scholar]
- 7.Kuehne T, et al. Magnetic resonance imaging analysis of right ventricular pressure-volume loops. Circ. 2004;110:2010–16. doi: 10.1161/01.CIR.0000143138.02493.DD. [DOI] [PubMed] [Google Scholar]
- 8.May-Newman K, McCulloch AD. Homogenization modeling for the mechanics of perfused myocardium. Prog Biophys Mol Biol. 1998;69(2–3):463–81. doi: 10.1016/s0079-6107(98)00020-0. [DOI] [PubMed] [Google Scholar]
- 9.Peskin CS. Mathematical Aspects of Heart Physiology. Lecture Notes of Courant Institute of Mathematical Sciences; New York: 1975. [Google Scholar]
- 10.Saber NR, Gosman AD, Wood NB, Kilner PJ, Charrier CL, Firman DN. Computational flow modeling of the left ventricle based on in vivo MRI data: initial experience. Annals of Biomech Engng. 2002;29:275–283. doi: 10.1114/1.1359452. [DOI] [PubMed] [Google Scholar]
- 11.Sacks MS, Chuong CJ. Biaxial mechanical properties of passive right ventricular free wall myocardium. J Biomech Eng. 1993;115:202–205. doi: 10.1115/1.2894122. [DOI] [PubMed] [Google Scholar]
- 12.Tang D, Yang C, Zheng J, Woodard PK, Sicard GA, Saffitz JE, Yuan C. 3D MRI-Based Multi-Component FSI Models for Atherosclerotic Plaques a 3-D FSI model. Annals of Biomedical Engineering. 2004;32(7):947–960. doi: 10.1023/b:abme.0000032457.10191.e0. [DOI] [PubMed] [Google Scholar]
- 13.Tang D, Yang C, Zheng J, Woodard PK, Saffitz JE, Petruccelli JD, Sicard GA, Yuan C. Local Maximal Stress Hypothesis and Computational Plaque Vulnerability Index for Atherosclerotic Plaque Assessment. Annals of Biomedical Engineering. 2005;33(12):1789–1801. doi: 10.1007/s10439-005-8267-1. [DOI] [PMC free article] [PubMed] [Google Scholar]
- 14.Vetter FJ, McCulloch AD. Three-dimensional analysis of regional cardiac function: a model of rabbit ventricular anatomy. Prog Biophys Mol Biol. 1998;69(2–3):157–83. doi: 10.1016/s0079-6107(98)00006-6. [DOI] [PubMed] [Google Scholar]
- 15.Vetter FJ, McCulloch AD. Three-dimensional stress and strain in passive rabbit left ventricle: a model study. Annals of Biomech Engng. 2000;28:781–792. doi: 10.1114/1.1289469. [DOI] [PubMed] [Google Scholar]
- 16.Westerhof N. Special issue on mechanics of the cardiovascular system, Editorial. Journal of Biomechanics. 2003;36:621–622. doi: 10.1016/s0021-9290(02)00439-6. [DOI] [PubMed] [Google Scholar]


