Abstract
Previously, we have developed and characterised a procedure for the deposition of thin silica films by a plasma enhanced chemical vapour deposition (PECVD) procedure using tetraethoxysilane (TEOS) as the main precursor. We have used the silica coatings for improving the corrosion resistance of metals and for enhancing the bioactivity of biomedical metallic implants. Recently, we have been fine-tuning the PECVD method for producing high quality and reproducible PECVD-silica (PECVD-Si) coatings on metals, primarily for biomaterial applications. In order to understand the interaction of the PECVD-Si coatings with biological species (such as proteins and cells), it is important to first analyse the properties of the silica films deposited using the optimised parameters. Therefore, this current investigation was carried out to analyse the characteristic features of PECVD-Si deposited on Ti substrates (PECVD-Si-Ti). We determined that the PECVD-Si coatings on Ti were conformal to the substrate surface, strongly adhered to the underlying substrate and were resistant to delamination. The PECVD-Si surface was composed of stoichiometric SiO2, showed a low carbon content (below 10 at.%) and was very hydrophilic (contact angle <10°). Finally, we also showed that the PECVD-Si coatings contain functional hydroxyl groups.
Keywords: Biomaterial, Hydroxyl groups, Plasma enhanced chemical vapour deposition, Silica films
1. Introduction
A common approach for enhancing the performance of Ti orthopaedic implants is to coat the metal surface with a silica-containing film such as Bioglass® (the composition of 45S5 type Bioglass® by weight % is 45% SiO2, 24.5% Na2O, 24.5% CaO, 5% P2O5). Bioglass® is not only biocompatible with the body but also displays potent bioactive properties [1–3].
The bioactivity of Bioglass® (and other bioactive glasses having variations in the elemental composition to that of Bioglass®) has been reported to occur through several mechanisms. In physiological environments, bone is able to bond strongly to bioactive glass through an intermediate apatite cement layer that is formed on the implant surface [4a-b].
Apatite growth begins at the Si-OH nucleation sites of the glass ceramic surface. Ionic species such as Na+ and Ca2+ are released from the glass ceramic into the surrounding biological fluid, which increases the degree of supersaturation with respect to the apatite and accelerates the rate of apatite nucleation. Apatite continues to grow spontaneously by consuming Ca2+ and PO43− in the biological fluid. This process has been described in more detail elsewhere [4b, 5]. Interestingly, calcium and phosphorous species may not necessarily be an integral constituent of the glass ceramic because in the presence of simulated body fluid, even pure SiO2 material (without Ca, P or Na) can form bone-like apatite beginning at the Si-OH nucleation sites [6]. Because bioactive glass is too brittle for use in load-bearing applications, the material is usually used as a coating over the surface of metals such as Ti, which provides the structural support. The common techniques for generating bioactive glass ceramic coatings on Ti include enamelling, electrophoresis, sol-gel and plasma spraying. However, bioactive glass ceramic coatings possess some disadvantages such as poor adhesion to the substrate surface [7].
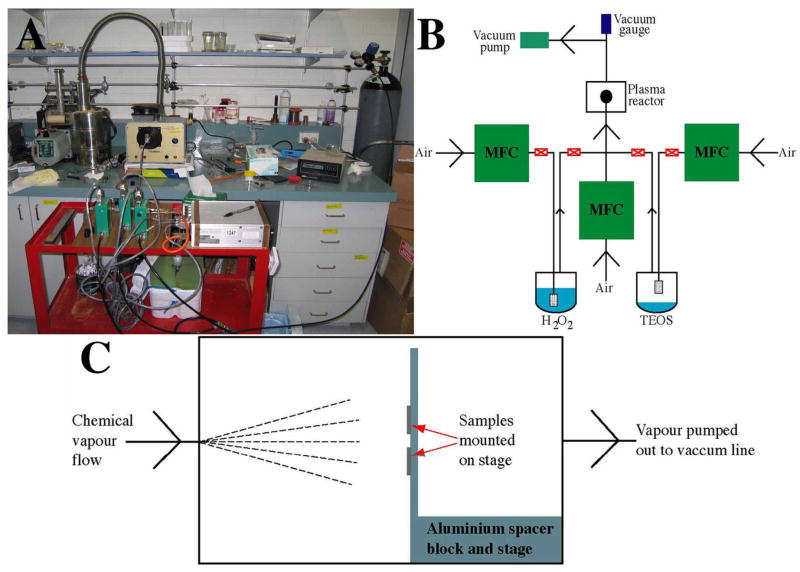
In an attempt to improve the adhesion of bioactive silica on Ti, a low temperature plasma process for depositing silica was developed by R.St.C. Smart [8–9]. Here, silica is deposited by a plasma enhanced vapour deposition (PECVD) technique. The plasma (partially ionised gas) is generated in a commercially available Harrick radio-frequency plasma chamber that is typically operated at 100 W and 13.56 MHz. A controlled flow of vapour into the reactor is maintained with the aid of 3 mass flow controllers (MFCs), which deliver air and mixtures of tetraethoxysilane (TEOS) and air or H2O2 and air into the reaction chamber at defined flow rates (Fig. 1A and B). In the first step, an air plasma is generated to remove surface impurities and increase the thickness of the Ti oxide layer. Silica is then deposited from TEOS/air plasma (the reaction layer is formed by silicon-oxygen species produced in the gas phase such as SiO−, O− and SiO radicals becoming embedded in the Ti oxide layer). The third step uses air/H2O2 plasma for surface hydroxylation to increase the density of surface silanol groups. The process produces a compositionally and structurally graded metal/oxide/silicate/silica surface layer that strongly adheres to the material substrate. PECVD-Si films have already been used by our research team as a corrosion resistance coating, a scaffold for growing hydroxyapatite (HA) or HA-like layers and as a surface coating for Ti biomedical implants [8–11]. Since it’s development, we have been fine-tuning the parameters of the PECVD process to enable the production of high quality and reproducible PECVD-Si coatings. However, we have not yet provided a complete study of the properties of the optimised PECVD-Si coatings. Therefore, in this report, we provide a comprehensive investigation of the characteristic features of PECVD-Si films deposited on Ti substrates using the optimised PECVD parameters.
Fig. 1.
The PECVD experimental set-up that was used for coating PECVD-Si films on Ti substrates. A photograph of the set-up is shown in (A). An illustration of the vapour delivery system is shown in (B). MFC denotes mass flow controller. An illustration of Ti samples (for PECVD-Si coating) mounted on the stage in the glass chamber of the Harrick radio-frequency plasma generator is shown in (C).
2. Experimental details
2.1 Substrate preparation
Ti with a purity of 99.7% and a thickness of 0.25 mm was purchased from Sigma. The metal was carefully cut into small discs with a diameter of 15 mm. The substrates were cleaned by ultrasonication (Soniclean 160HT) in a 0.5% (w/v) Pyroneg (Diversey) detergent solution, prepared in water, at 60°C for 40 min. The samples were washed 6 times in water and ultrasonicated for a further 20 min in water at 60°C. After washing another 3 times in water, each specimen was dried under a stream of N2 and stored in a plastic Petri dish under vacuum. The water used here, as well as for the subsequent experiments, was purified in a Labconco WaterPro PS system equipped with a carbon and 3 deionisation cartridges. The unit was operated at a resistivity of 18.2 Mega Ω·cm and the water was dispensed through a 0.2 μm hollow fiber filter supplied by the manufacturer.
2.2 PECVD of silica on titanium
A photograph of the PECVD system shown in Fig. 1a and a schematic of the set-up is shown in Fig. 1b. The system consists of a vacuum line, plasma generator, and a vapour delivery system. A radio-frequency plasma generator (model # PDC-32G) made by Harrick was operated at 100 W and 13.56 MHz. An external fan located at the top unit cooled the plasma chamber. The glass chamber of the Harrick unit is defined by a length of 18 cm and a diameter of 7 cm. The samples were positioned 7 cm from the rear of the chamber and parallel to the centre of the inlet valve located on the chamber lid (Fig. 1C). The chamber could be isolated from the vapour delivery system by closing the inlet valve and was opened 1/2 a turn during plasma processing. The Ti substrates were held to the stage by a small piece of Scotch 3M double-sided adhesive. Six 15 mm diameter Ti discs were coated in each run to ensure all samples were located close to the optimal position for silica deposition.
The flow of vapour into the plasma chamber was controlled by 3 MKS MFCs, which were connected to an MKS digital readout module (model # 247D). The middle MFC in Fig. 1A and c purged air (BOC; Instrument Grade) into the plasma chamber at a set flow rate of 10 sccm. After the pressure stabilised (to 2 × 10⁻¹ Torr), the plasma switched on for 20 min. After treatment, the plasma was turned off. Air was then purged into a vessel containing tetraethoxysilane (TEOS) at 2 sccm. The 2-stemmed vessel was 11 cm in height with a diameter of 4 cm. A glass frit, where the air was purged through, was situated 1 cm from the bottom of the vessel. The vessel was filled with 5 ml of 98% pure TEOS (Sigma) kept in crushed ice (0°C). The mixed air/TEOS vapour was slowly introduced into the chamber (by slowly opening the manual valve located on the left side of the vessel as shown in Fig. 1B) to obtain a pressure of 3 × 10⁻¹ Torr and the plasma was switched on for 30 min. The plasma and the middle and right MFCs were then turned off. The left MFC (shown in Fig. 1A and B) was then used to purge air into a 100 ml 2-stemmed round bottom flask round bottom filled with 40 ml of an aqueous solution of 30% H2O2 (Chem-Supply) so the frit was submerged in the liquid. The vessel was kept at 25°C and the flask was covered with aluminium foil to shield it from ambient light. The plasma was then switched on (for 1–15 min) after the pressure had stabilised (to 3.2 × 10⁻¹ Torr). Before removing the samples the system was allowed to cool to ambient temperature under vacuum. All samples were stored in a plastic desiccator under vacuum.
The vacuum line consisted of a Javac rotary pump (model # DD150) filled with chemically inert oil (Fomblin). A cold trap cooled in liquid N2 was connected between the pump and the plasma chamber to prevent the possibility of back-streaming of contaminating hot oil vapour from the pump to the samples and the pressure was recorded between the cold trap and the plasma chamber with a piranhi gauge (MKS) (Fig. 1A and B).
2.3 Characterisation of functional hydroxyl groups
Hydroxylation of PECVD-Si-Ti surfaces were characterised by 3 methods as outlined below.
Trifluoroacetic anhydride (TFAA) derivatisation
Samples were incubated in TFAA (Sigma) solution at 25°C for 5 and 60 min time periods in 20 ml glass vials (Crown Scientific). The samples were washed with methanol, dried under N2 and kept under vacuum. The samples were analysed by means of X-ray photoelectron spectroscopy (XPS).
Alkoxysilane labeling
3,3,3-trifluoropropyl trimethoxysilane (FPTMS) (Fluka) was used to label the hydroxyl groups on PECVD-Si-Ti. The silanes were dissolved in toluene to a concentration of 100 mM. The samples were then refluxed in 5 ml of the reaction solution at 120°C for 1 h and heated at 90°C for an additional 12 h (under an atmosphere of dry N2). All samples were washed in toluene and dried under a stream of N2. The samples were analysed by means of XPS.
Contact angle measurements
Contact angle measurements were performed on a custom-built stage that allowed the sample to be positioned in the x, y and z directions. Samples were spotted with 2 μl of water with a mechanical pipette in an ambient atmosphere. Images were then quickly recorded on a Panasonic WV BP550 CCTV camera to minimise any effects as a result from water evaporation. Processing was performed using Scion Image v4.0.2 software. Measurements were taken on the left and right side of the water droplet from 2 samples (total of 4 measurements per sample type).
2.4 Pull-off force measurements
Eduardo to write
2.5 Delamination test
The stability of the PECVD-Si film coated on Ti was tested by incubating PECVD-Si-Ti in boiling toluene at 120°C for 12 h. After this, the sample was washed in toluene, dried under a stream of N2 and stored under vacuum before XPS analysis.
2.6 X-ray photoelectron (XPS) analysis
XPS analysis was performed on two instruments (depending on the availability of the instruments). The first was a Physical Electronics PHI 5600 ESCA system. Spectra were acquired using the non-monochromated Mg Kα X-ray (hv =1253.6 eV) source at a base pressure lower than 10−8 Torr, an accelerating potential of 15 kV and a take-off angle of 45°. The other instrument was a Kratos Axis Ultra DLD. Spectra were recorded on this instrument using the monochromated Al Kα (hv =1486.6 eV) X-ray source at a base pressure better than 10−9 Torr, accelerating potential of 15 kV and a take-off angle of 45°. The pass energy for a survey spectrum was 93.9 eV on the Physical Electronics PHI 5600 ESCA and 160.0 eV on the Kratos Axis Ultra DLD spectrometers. Elements on the surfaces were identified from the survey spectrum. Atomic concentrations were calculated from the integral peak intensities of the main photoelectron peak for each element identified in the spectrum using a Shirley-type background and the sensitivity factors supplied by the manufacturers’ of the instruments.
2.7 Infrared spectroscopy analysis
Fourier transform-IR (FT-IR) spectroscopy was performed on a Nicolet Avatar® 370MCT, using a smart apertured grazing angle (SAGA) accessory supplied by the manufacturer. This accessory allows information to be obtained for thin films ranging from 1 nm to 1 μm in depth. Before analysis, the detector was cooled with liquid N2 for 15 min and samples were placed face down on the aperture of the SAGA accessory. The instrument was allowed to purge with purified dried air for 1 h before analysis. The air was purified in a Norgren hydrocarbon vapour adsorption filter and dried in a Parker FT-IR purge gas generator at 10 scfh before entering the instrument. Background spectra were taken on cleaned uncoated Ti substrates. The spectrum was recorded at a resolution of 4 wavenumbers/cm and 64 scans.
2.8 Atomic force microscopy (AFM) analysis
Samples were analysed using a Nanoscope 4 Multimode microscope (Digital Instruments) in Tapping Mode. High frequency commercial silicon cantilevers (TESP, Veeco Instruments, USA) were used. Root mean square (RMS) roughness values were calculated from height images using the Nanoscope 5.12r3 software (Digital Instruments).
2.9 Scanning electron microscopy analysis
Images of samples were taken on a Phillips XL30 operated at 10 kV. All samples were coated with a thin layer of platinum to a thickness of 2 nm to prevent charging effects during analysis.
3. Results and Discussion
3.1 Characterisation of Step 1of the PECVD procedure: Air plasma cleaning/oxidation
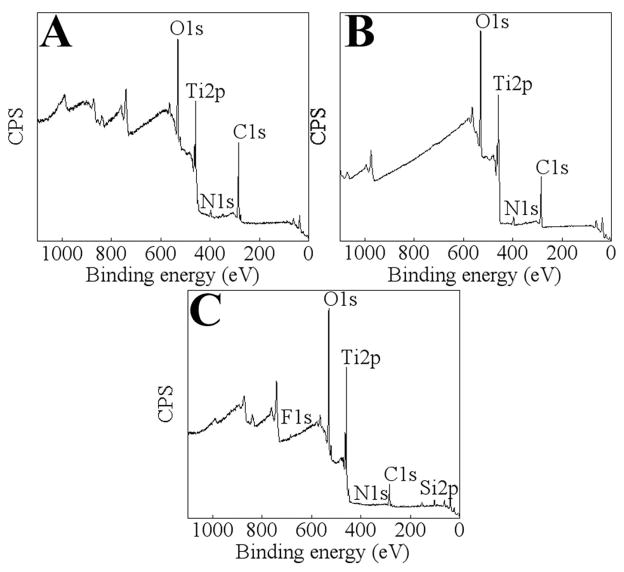
The surface chemical compositions of the Ti surfaces were analysed by XPS. Representative survey spectra are shown for untreated Ti, detergent cleaned Ti and detergent cleaned Ti after air plasma processing (Fig. 2). Elemental atomic percentages for each surface are shown in Fig. 3. Typically, there is a large amount of carbon (55 atomic % (at.%) mainly in the form of hydrocarbon contamination, acquired during the manufacturing process and subsequent handling. Also, there was a small amount of nitrogen (4 at.%) and a weak Ti signal (below 10 at.%) detected. The Ti signal was partially quenched by a contaminating layer (mainly in the form of hydrocarbons) that was present on the surface. After cleaning the substrates in detergent, the level of carbon was reduced by approximately 40% and the nitrogen signal remained below 10 at.%. Also, the Ti signal increased to 14 at.% due to the reduced thickness of the contaminating layer. Oxygen increased from 33 to 47 at.% after cleaning, indicating an increase in the thickness of the Ti oxide layer that corresponded with a decrease in the hydrocarbon layer.
Fig. 2.
Representative XPS survey spectra of untreated Ti (A); after cleaning Ti in Pyroneg detergent (B) and after subjecting cleaned Ti to 20 min of air plasma treatment (C).
Fig. 3.
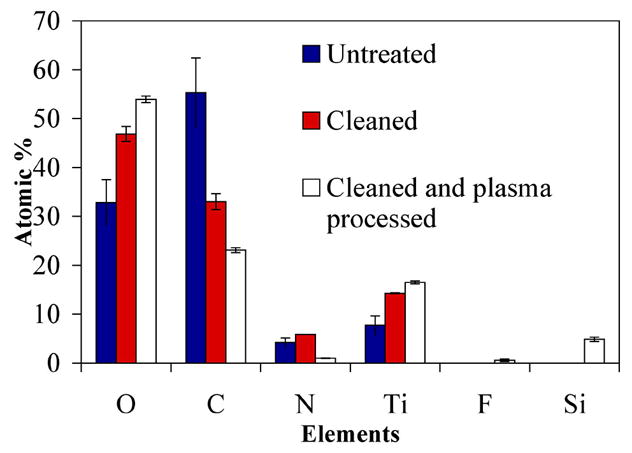
Elemental atomic % data of Ti surfaces (determined through XPS analysis) of untreated, detergent-cleaned and cleaned/plasma-processed (20 min of air plasma) samples.
The detergent cleaned Ti substrates were then processed by air plasma. This step served to further clean the surface by plasma etching and increase the thickness of the surface oxide layer. This was important because the process requires the slow growth of the coating beginning in the titanium oxide layer in order to produce a graded metal/oxide/silicate/silica layer that strongly bonds to the metal’s surface. The level of carbon decreased by 30% on Ti after processing detergent-cleaned Ti substrates in air plasma and the Ti signal was increased to 17 at.%, indicating that the hydrocarbon contaminating layer had decreased in thickness (compare Fig. 2C to B and refer to Fig. 3). Also, the level of oxygen increased by 14 at.%, which can be attributed to an increase in the thickness of the Ti oxide layer. Contamination from nitrogen was also present at ~ 6.0 at.%. However, 76% of the nitrogen from untreated Ti (surface contamination derived possibly from the manufacturing process of the Ti sheet) was removed by the air plasma cleaning step, which otherwise could not be removed by the detergent-cleaning procedure. In addition, 5 at.% of silicon was detected. The silicon signal indicates that a small amount of silica was deposited on the surface, probably from TEOS-derived species (TEOS was used as a precursor for the PECVD of silica) that had adsorbed to the walls of the vapour delivery lines or the walls of the plasma chamber from previous experiments. Finally, oxygen increased by another 7 at.% after air plasma treatment, indicating that the Ti oxide had further increased in thickness.
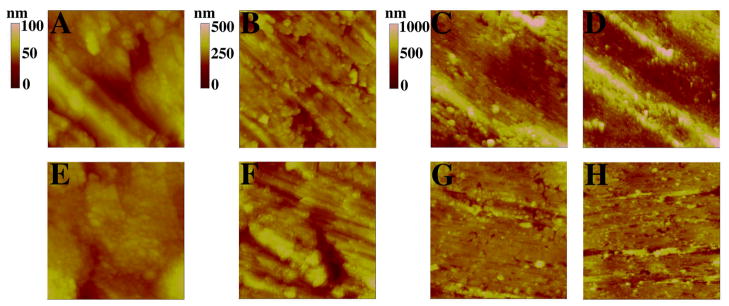
The morphological characteristics of detergent-cleaned Ti before and after being processed by air plasma (the first treatment step of the PECVD procedure) were analysed by AFM. Step height AFM images are shown in Fig. 4 and RMS values are shown in Fig. 5. Typically, there are large morphological features present on Ti before plasma processing (Fig. 4A-D). Some of the larger features were removed from the surface after processing of Ti with air plasma (compare Fig. 4G-H to C-D). Apart from this observation, the air plasma treatment step did not significantly change the morphological characteristics of the Ti surface because the measured RMS values (at scanned areas of 1, 10, 50 and 100 μm2), were not significantly different to that of clean, non-plasma processed Ti (Fig. 5).
Fig. 4.
AFM height images of Ti surfaces. A–D represents detergent-cleaned Ti and E–H was taken on detergent-cleaned Ti subjected to 20 min of air plasma processing. Scanned areas of 1 μm2 have a height (z) scale bar of 100 nm (A and E); at 10 μm2 the scale bar is 500 nm (B and F); at 50 μm2 (C and G) and 100 μm2 (D and H) the scale bar is 1000 nm.
Fig. 5.
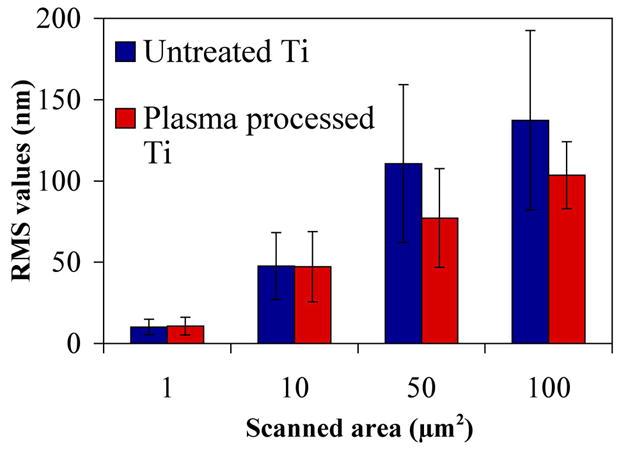
RMS values (nm) taken on detergent-cleaned Ti (referred to as Untreated Ti in the figure) and detergent-cleaned Ti subjected to 20 min of air plasma processing (Plasma processed Ti).
3.2 Characterisation of Step 2 of the PECVD procedure: Silica deposition
Next, silica was deposited onto the cleaned and oxidised Ti substrates in the second step of the PECVD process in an air/TEOS plasma. Silica is grown on Ti from Si-O species, formed in the air/TEOS plasma, becoming embedded as silicate species in the plasma grown Ti oxide layer [8]. Interestingly, the water present in the air supply acts as a catalyst in the hydrolysis of TEOS through a possible hydrolysis reaction shown below:
Alkoxysilanes readily hydrolyse in water and the hydrolysed TEOS species can condense with each other in the gas phase or react with surface hydroxyl groups [12]. Also, other species such as SiO− ions and SiO radicals formed in the air/TEOS plasma can react and become embedded in the Ti oxide [8–9].
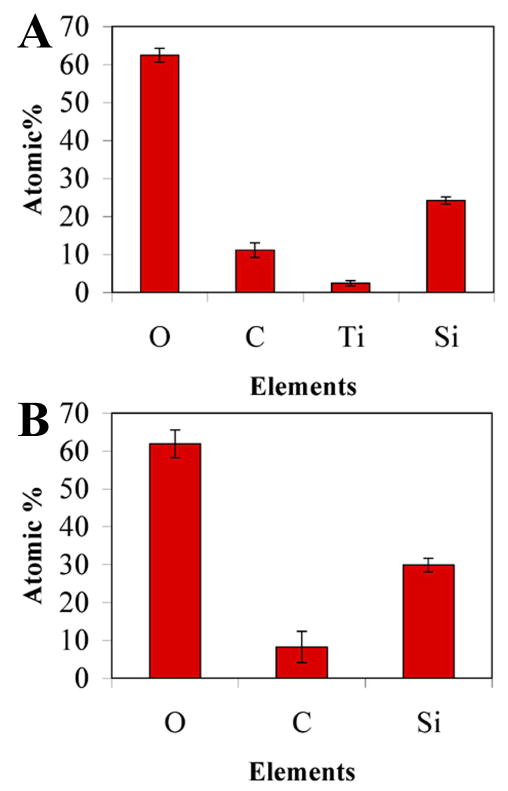
In one set of experiments, the air carrier gas was exchanged for pure oxygen. Interestingly, silica was deposited onto Ti at a slower rate in an oxygen atmosphere compared to air. A small Ti signal (~2 at.%) is still found on the substrate surface after silica deposition in an oxygen atmosphere (Fig. 6A and Fig. 7A). Also, the level of silicon was found to be about 20% lower on PECVD-Si-Ti when PECVD-Si was grown in an oxygen atmosphere compared to those films grown using air (compare Fig. 7A to B). This data indicates that a thinner layer of silica was deposited in an oxygen atmosphere compared to air under the same PECVD parameters.
Fig. 6.
Representative XPS survey spectra of PECVD-Si-Ti in which silica was deposited in an oxygen atmosphere (A) and in an air atmosphere (B).
Fig. 7.
Elemental atomic percentages of the surface of PECVD-Si-Ti in which silica was deposited in an oxygen atmosphere (A) and in an air atmosphere (B).
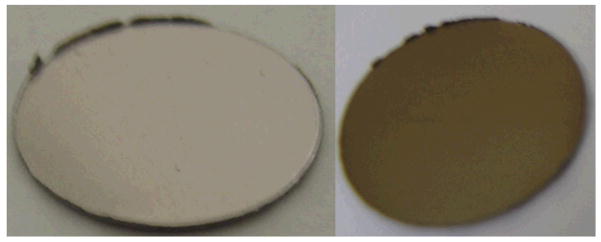
For the remainder of the experiments, silica was deposited in an air atmosphere. The elemental composition of these surfaces comprised approximately of 60 at.% oxygen, 10 at.% carbon and 30 at.% silicon (Fig. 7B), which is similar to previous reports obtained using this technique [8–10]. The oxygen/silicon ratio of 2.1±0.2 is close to 2.0 expected for silicon dioxide. Importantly, there is a complete attenuation of the underlying titanium signal, indicative of a continuous silica layer covering the substrate (Fig. 6B). PECVD-Si coatings on Ti are bronze in colour, in comparison to the uncoated grey Ti surface, attributed to optical reflective interference effects from the coating (Fig. 8).
Fig. 8.
A photograph of an uncoated Ti disc (left image) and of a PECVD-Si-Ti sample (right image).
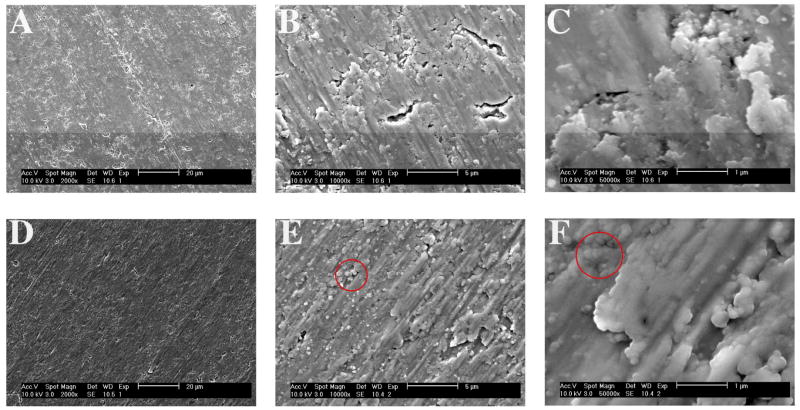
Micrographs of PECVD-Si-Ti were taken by scanning electron microscopy (SEM) and compared to detergent-cleaned, non-plasma processed Ti surfaces at low (Fig. 9A and D), medium (Fig. 9B and E) and high (Fig. 9C and F) magnifications. At low magnifications, the PECVD-Si-Ti surface appeared slightly smoother than an uncoated Ti surface (compare Fig. 9A to D). Images taken at medium and high magnifications support this observation (compare Fig. 9B-C to Fig. 9E-F). Additionally, the PECVD-Si coating has filled cracks that are present on the Ti surface (compare Fig. 9B to E). There are also globular nanostructures present on PECVD-Si-Ti, which are highlighted in Fig. 9E to F. These may correspond to silica nanoparticles deposited during the PECVD process due to possible gas phase nucleation and growth. This is a reasonable conclusion since the formation of nanoscale aggregates is common during silica mineralisation [13–18].
Fig. 9.
SEM micrographs of clean, uncoated Ti (A–C) and PECVD-Si-Ti (D–F). For both sample types, images were taken at low (A and D), medium (B and E) and high (C and F) magnifications. The red circles in E and F highlight small, globular particles that were observed only on the plasma silica films.
An important feature of PECVD-Si coatings is the ability of the film to adhere strongly to the Ti implant. We discovered that the PECVD-Si films coated on Ti can withstand pull-off loads in excess of 27 MPa (Fig. 10). This is much higher than that observed for the Ti/apatite and the bone/apatite interfaces formed during the osseointegration process (the direct structural and functional connection between the implant’s surface and the living bone tissue), which have been reported to fail under loads of 12 MPa and 17 MPa, respectively [8–10, 19]. Because the Ti/PECVD-Si interface can withstand higher loads than the bone/apatite interface, a PECVD-Si-Ti implant is unlikely to fail at the interface between the substrate surface and the coating.
Fig. 10.

An illustration of the apparatus and method used for testing the adhesion (pull off force) of PECVD-Si coatings on Ti substrates (A) and photographs of PECVD-Si-Ti after testing the adhesion strength of the PECVD-Si coatings (B and C). At forces of 21 and 27 MPa, failure occurred between the screw and glue interface and not at the PECVD-Si and Ti interface (B and C), indicating that PECVD-Si coatings on Ti can withstand loads in excess of 27 MPa.
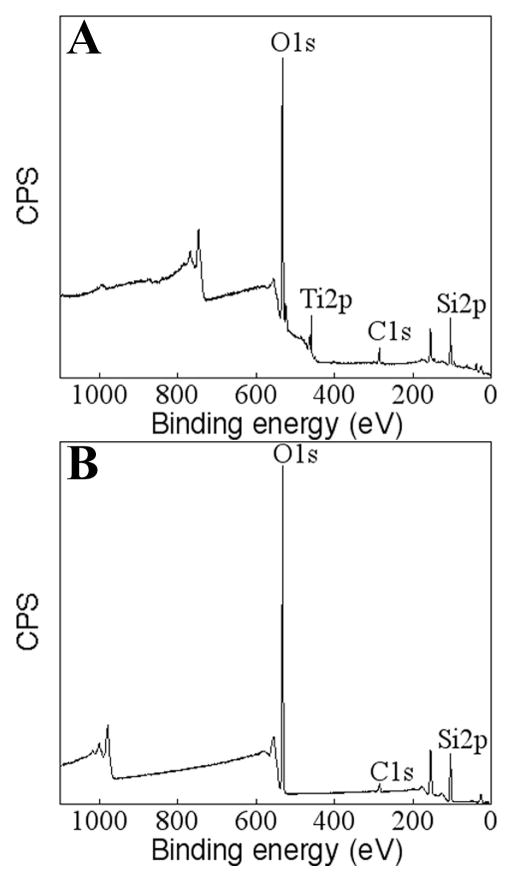
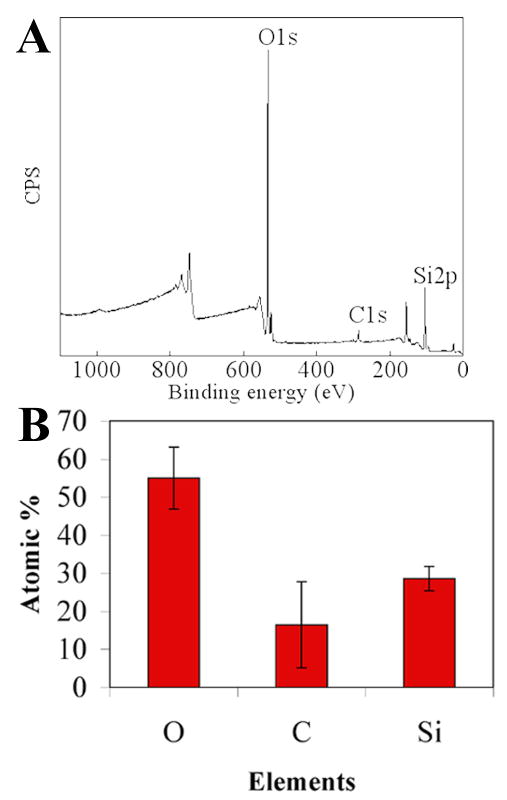
The PECVD-Si coatings were also found to be resistant to delamination. After exposing PECVD-Si-Ti substrates to a boiling solvent (toluene) for 12 h, the underlying Ti surface could still not be detected by XPS (Fig. 11A and B). Therefore, these results confirmed that the sample was prepared appropriately and the plasma processing parameters were adequate for obtaining robust silica films on Ti.
Fig. 11.
XPS data of PECVD-Si-Ti taken after boiling the samples in toluene at 120°C for 12 h. A survey spectrum is shown in A and B shows the elemental atomic % of the surface.
3.3 Characterisation of Step 3 of the PECVD procedure: Hydroxylation
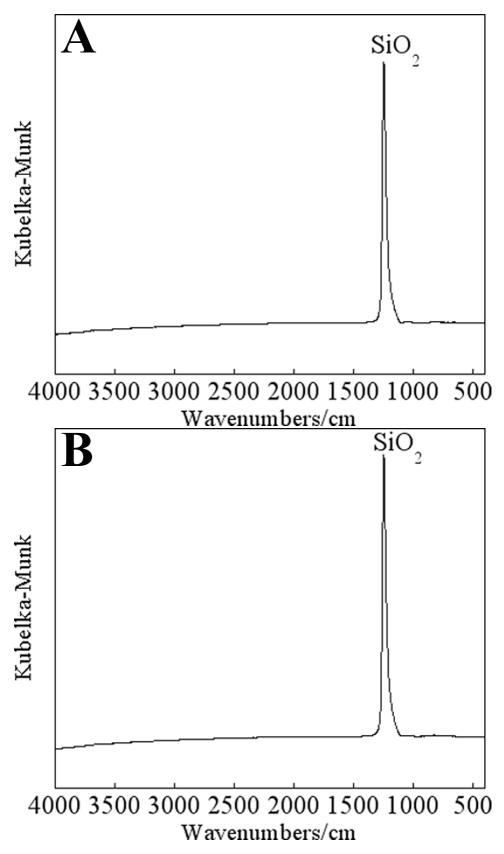
Step 3 of the PECVD procedure involved treating the PECVD-Si in an air/H2O2 plasma. This treatment served to increase the density of surface silanol groups. Silanol groups are an important feature of these bioactive PECVD-Si coatings for inducing apatite precipitation from biological fluid [8]. From XPS analysis, PECVD-Si-Ti not treated with air/H2O2 plasma was found to contain the same surface chemical composition compared to PECVD-Si-Ti that was treated with air/H2O2 plasma (data not shown). Also, no additional information could be obtained on PECVD-Si-Ti (not treated and treated with 5 min of air/H2O2 plasma) substrates by infrared spectroscopy on a Nicolet Avatar® 370MCT spectrometer equipped with a smart apertured grazing angle (SAGA) accessory, which was capable of analysing the chemistry of thin films ranging from 1 nm to 1 μm in thickness (Fig. 12A and B). The broad hydroxyl-stretching band expected at approximately 3400 cm−1 was not detected and both spectra were rather featureless apart from the narrow SiO2 band near 1250 cm−1 [20]. Therefore, we chose to assess the surface coverage of hydroxyl groups through contact angle (CA) measurements, derivatisation with TFAA and labeling with FPTMS.
Fig. 12.
Infrared spectra of PECVD-Si-Ti (A) and after treating PECVD-Si-Ti with 5 min of air/H2O2 plasma (B). The spectra were acquired on a Nicolet Avatar® 370MCT spectrometer equipped with a smart apertured grazing angle (SAGA) accessory.
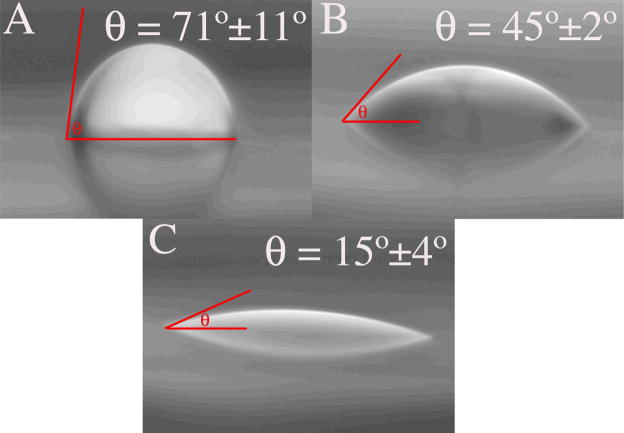
The first method involved measuring three-phase CAs at the interface of small (2 μl) water droplets and the material’s surface in air. This technique gave an indication of the interfacial energy at the solid-liquid interface. For a surface with a high energy, the water droplet will spread, that is, the surface will be easily wetted. This is typical for a hydrophilic surface such as one containing a high density of hydroxyls [21–22]. We found that the CA on Ti decreased after each treatment step. The average CA for untreated Ti was 71±11° indicating that the surface was hydrophobic, which was probably due to the surface being contaminated with high amounts of saturated hydrocarbon (Fig. 13A). After Ti was cleaned in detergent, the CA was reduced to 45±2° (Fig. 13B). The increase in hydrophilicity can be explained by some of the contaminating layer being removed and an increase in the thickness of the Ti oxide layer.
Fig. 13.
Photographs of water droplets (2 μl) on untreated Ti (A), after cleaning Ti in detergent (B) and on PECVD-Si-Ti treated with 5 min of air/H2O2 plasma (C). The contact angle (θ) was measured on the left (shown) and the right side of the water droplet.
Surprisingly, the water droplet completely spread on the PECVD-Si-Ti surface (not treated with air/H2O2 plasma) and could not be imaged by the charge-coupled device (CCD). This is indicative of a highly hydrophilic surface with a high hydroxyl group density. Interestingly, after treating PECVD-Si-Ti with 5 min of air/H2O2 plasma, the contact angle was now 15±4° (Fig. 13C). This result suggests that the air/H2O2 plasma post-treatment reduces the hydroxyl group density on the surface [21].
Therefore, we next chose to label the surface hydroxyl groups with FPTMS. A simplified schematic of FPTMS attached to a surface containing hydroxyl groups is shown below:

After the reaction, the surface becomes terminated with three fluorine atoms per silane molecule. Since fluorine is absent on both PECVD-Si-Ti and cleaned, uncoated Ti surfaces, fluorine could be used as a distinct marker element to indicate that FPTMS had attached on the surfaces (by XPS analysis). This labeling procedure was used to compare the coverage of hydroxyl groups on PECVD-Si treated with 0, 1, 5 and 15 min of air/H2O2 plasma.
After FPTMS was grafted on PECVD-Si-Ti treated for 1 min with air/H2O2 plasma, 1.7 at.% of fluorine was detected (Table 1). The fluorine signal increased to 4.3 at.% on PECVD-Si-Ti treated with 5 min of air/H2O2 plasma. No significant increase in fluorine was detected on the sample treated with 15 min of air/H2O2 plasma. This result indicated that the surface density of hydroxyl groups on PECVD-Si-Ti had increased after 5 min of air/H2O2 plasma treatment (compared to PECVD-Si-Ti treated with 1 min of air/H2O2). However, no further increase in the density of hydroxyl groups was observed on PECVD-Si-Ti treated with 15 min of air/H2O2 plasma. However, the highest amount of fluorine (5.4 at.%) and therefore the highest coverage of FPTMS molecules was achieved on PECVD- Si-Ti not treated with air/H2O2 plasma. These results suggest that air/H2O2 plasma processing of PECVD-Si-Ti does not increase the density of surface hydroxyl groups. Possibly, the surface density of hydroxyl groups was reduced in the early stages of the air/H2O2 plasma treatment (≤1min) before new hydroxyl groups were formed following longer processing times (≥5 min) [21]. Finally, we attempted to derivatise hydroxyl groups on PECVD-Si-Ti. These experiments were performed on PECVD-Si-Ti not treated with air/H2O2 plasma because this surface was shown to contain the highest density of hydroxyl groups. TFAA reacts with surface hydroxyls to form an ester with 3 terminal fluorine atoms that can be detected by XPS as shown below:
Table 1.
Elemental atomic percentages of FPTMS-labeled PECVD-Si-Ti that had been treated with different times of air/H2O2 plasma, as indicated in the table.
| Air/H2O2 plasma treatment time | O at.% | C at.% | N at.% | F at.% | Si at.% |
|---|---|---|---|---|---|
| 0 min | 58.1 | 10.7 | 0.2 | 5.4 | 25.6 |
| 1 min | 52.1 | 15.9 | 1.2 | 1.7 | 29.1 |
| 5 min | 59.3 | 9.8 | 0.1 | 4.3 | 26.5 |
| 15 min | 53.9 | 13.0 | 0.0 | 4.4 | 28.7 |

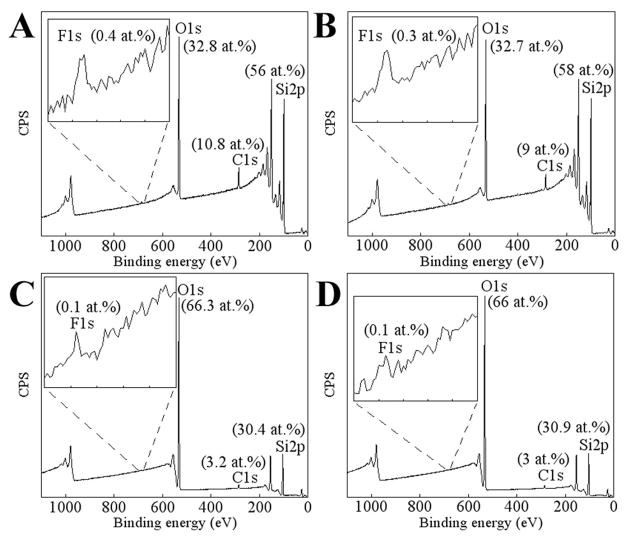
The samples were allowed to incubate in TFAA solution for reaction times of 5 min and 1 h. The reaction on PECVD-Si-Ti (treated with 5 min of air/H2O2 plasma) was compared to commercially available silicon (used as a control surface). After the TFAA reaction, the silicon surface produced a low fluorine signal of 0.4 at.% and 0.3 at.% for 5 min and 1 h reaction times, respectively (Fig. 14A–B). Corresponding fluorine signals on PECVD-Si-Ti were both at 0.1% (Fig. 14C–D). Only trace levels of fluorine were detected on silicon and PECVD-Si-Ti, which may be an indication that there were only few surface hydroxyl groups available to react with the TFAA molecule, the reaction did not proceed very efficiently, or that there is a side reaction that degrades the PECVD-Si film and the generated ester with it. The latter two possibilities are more probable considering that the surface of PECVD-Si-Ti (not treated and treated with 5 min of air/H2O2 plasma) was shown to be hydrophilic (from the CA data) and that the silica surface was expected to have 2.5–3.0 OH groups per nm2, suggesting that it does not adequately represent the surface hydroxyl concentration [23]. Previously, Dang et al. attempted to derivatise silanol groups using TFAA [24]. They too found that the reaction did not occur effectively on silica, and the data obtained here corroborated their results.
Fig. 14.
XPS survey spectra on commercial silicon and PECVD-Si-Ti (treated with 5 min of air/H2O2 plasma) after a TFAA reaction in solution. A spectrum of silicon reacted with TFAA for 5 min is shown in A and for 1 h in B and spectra of PECVD-Si-Ti reacted with TFAA for 5 min and 1 h are shown in C and D, respectively. The silicon used in this experiment was purchased from Virginia Semiconductor Inc. (Virginia). and was boron doped to a resistivity of 0.0005–0.001 Ω·cm.
4. Conclusions
The surface of PECVD-Si-Ti, on which silica had been deposited in an air atmosphere, is in the form of a silicon dioxide and the films adhered strongly to the Ti substrate. Identification of hydroxyl groups could not be achieved by labeling the groups with TFAA for subsequent XPS analysis because the reaction does not proceed well on oxidised silicon or on PECVD-Si-Ti surfaces. However, by measuring the CA of PECVD-Si-Ti surfaces and by labeling the hydroxyl groups with an alkoxysilane (FPTMS), we showed that the density of hydroxyl groups is highest on PECVD-Si-Ti not treated with air/H2O2 plasma. Therefore, treatment with air/H2O2 plasma is not essential for the generation of surface silanol groups on PECVD-Si-Ti.
Acknowledgments
This work was supported by TGR Biosciences and the Australian Research Council. Eduardo Saiz acknowledges the support from NIH/NIDCR Grant No. 1R01DE11289.
References
- 1.Hench LL. J Am Chem Soc. 1991;74:1487. [Google Scholar]
- 2.Oonishi H, Kushitani S, Yasukawa E, Iwaki H, Hench LL, Wilson J, Tsuji E, Sugihara T. Clin Orthop Relat Res. 1997;334:316. [PubMed] [Google Scholar]
- 3.Hench LL, Wilson J. Science. 1984;226:630. doi: 10.1126/science.6093253. [DOI] [PubMed] [Google Scholar]
- 4.J.E. Davies, Bone Engineering, Rainbow graphic and printing Ltd., Hong Kong, 2000. a. J. Sodek, S. Cheifetz, 31. b. T. Kokubo, H.M. Kim, M. Kawashita, T. Nakamura, 190.
- 5.Coreno J, Martinez A, Bolarin A, Sanchez F. J Biomed Mater Res. 2001;57:119. doi: 10.1002/1097-4636(200110)57:1<119::aid-jbm1150>3.0.co;2-p. [DOI] [PubMed] [Google Scholar]
- 6.Li P, Ohtsuki C, Nakanishi K, Soga N, Nakamura T, Yamamuro T. J Am Chem Soc. 1992;75:2094. [Google Scholar]
- 7.Teghil R, D’Alessio LD, Ferro D, Barinov SM. J Mater Sci Lett. 2002;21:379. [Google Scholar]
- 8.Stevenson M, Arora PS, Smart RStC. Surf Interface Anal. 1998;26:1027. [Google Scholar]
- 9.Arora PS, Smart RStC. Surf Interface Anal. 1996;24:539. [Google Scholar]
- 10.Zhang H, Simpson D, Kumar S, Smart RStC. Colloids Surf, A. 2006;291:128. [Google Scholar]
- 11.Abbott JR, Smart RStC, Henneberg M, Yuen T, Skinner W, Leigh CM, Hermanis GM, David DJ. J Craniofacial Surg. 2001;8:17. [Google Scholar]
- 12.Halliwell CM, Cass AEG. Anal Chem. 2001;73:2476. doi: 10.1021/ac0010633. [DOI] [PubMed] [Google Scholar]
- 13.Moon JH, Shin JW, Kim SY, Park JW. Langmuir. 1996;12:4621. [Google Scholar]
- 14.Heiney PA, Grunberg K, Fang J. Langmuir. 2000;16:2651. [Google Scholar]
- 15.Shlyakhtenko LS, Gall AA, Filonov A, Cerovac Z, Lushnikov A, Lyubchenko YL. Ultramicroscopy. 2003;97:279. doi: 10.1016/S0304-3991(03)00053-6. [DOI] [PubMed] [Google Scholar]
- 16.Jesionowski T, Krysztafkiewicz A. Appl Surf Sci. 2001;172:18. [Google Scholar]
- 17.Kim T, Suh SM, Girshick SL, Zachariah MR, McMurry PH, Rassel RM, Shen Z, Campbell SA. J Vac Sci Technol, A. 2002;20:413. [Google Scholar]
- 18.Bierbaum K, Grunze M, Baski AA, Chi LF, Schrepp W, Fuchs H. Langmuir. 1995;11:2143. [Google Scholar]
- 19.Soballe K. Acta Othop Scand. 1993;255:1. doi: 10.3109/17453679309155636. [DOI] [PubMed] [Google Scholar]
- 20.Hu SM. J Appl Phys. 1980;51:5945. [Google Scholar]
- 21.Sakai N, Fujishima A, Watanabe T, Hashimoto K. J Phys Chem B. 2003;107:1028. [Google Scholar]
- 22.Stevens N, Priest CI, Sedev R, Ralston J. Langmuir. 2003;19:3272. [Google Scholar]
- 23.Iler RK. The Colloid Chemistry of Silica and Silicates. Ithaca, New York: Cornell V.P; 1955. [Google Scholar]
- 24.Dang TA, Gnanasekaran R. Surf Interface Anal. 1990;15:113. [Google Scholar]


