Introduction
Chronic hemodialysis requires a vascular access that provides high flow rates for the extracorporeal recirculation of blood. Although the arteriovenous (AV) fistulas created by the anastomosis of a native artery to a native vein is the preferred access, synthetic polytetrafluoroethylene (PTFE) AV grafts are also widely used in the U.S. Both access types succumb to premature failure due to clotting caused by underlying neointimal hyperplasia formation, although synthetic grafts have a higher rate of failure. The construction or revision of hemodialysis accesses are among the most commonly performed vascular surgery procedures in the U.S (1). Access failure results in significant morbidity in the hemodialysis patient population and currently there is no effective therapy to prevent access failure (2, 3). Synthetic AV grafts could be the preferred access for hemodialysis if the high occurrence of hyperplasia could be prevented, as they generally have larger luminal diameters and shorter waiting times before use than native fistulas. Thus research is ongoing to develop strategies to inhibit hyperplasia and prevent graft failure.
Porcine models of AV graft have been developed for the study of the pathogenesis of hyperplasia and treatment modalities. These models recapitulate the pattern of hyperplasia development observed in clinically failed AV grafts, with hyperplasia developing in an accelerated manner (4–7). Thus these models are very useful for studying strategies to prevent AV graft hyperplasia. Analysis of hyperplasia development in the pig model typically involves survival of the animals for 4–8 weeks after graft placement followed by euthanasia and histological analysis of the graft-vessel anastomoses. Hyperplasia occurs most often at the juncture of the graft and vessel but it is also observed within the native vessels, upstream, and downstream of the anastomoses (8). Therefore, histological sampling of multiple sections of the anastomosis and attached vessels is required for a thorough evaluation of hyperplasia development and of treatment effects. Histological analysis provides information regarding the cellular nature of the lesion. Histology from our group and others has shown the lesion consists primarily of cells with smooth muscle cell-like properties, and numerous macrophages and macrophage-derived foreign body cells. The lesion is also a site of conspicuous angiogenesis and deposition of extracellular matrix (4, 5, 9–11). Unfortunately, histological analysis suffers from a number of shortcomings (12). Because of its labor-intensive nature and expense, only a limited number of samples are typically obtained around the graft/vessel anastomosis. Thus, the access region is generally not completely evaluated. Also, the fixation of tissue for histology results in shrinkage and some distortion of vessel structure from the in vivo condition. In addition, artifacts often occur during preparation of thin histology slices due to differences in cutting resistance between the soft vascular tissues and the more resilient sutures and grafts. The graft often becomes detached from the tissue during processing, making the tissue histology difficult to analyze. Another obvious disadvantage to histological analysis is that the animals must be euthanized to obtain the tissue, precluding any further in vivo studies. For these reasons, a technique that readily yields information regarding hyperplasia development throughout the graft and attached vessels in vivo is needed. Development of such a technique could prove useful for evaluating hyperplasia development in patients as well.
Some investigators have used intravascular ultrasound or contrast (x-ray) angiography to characterize hyperplasia development in animal models (7, 13–15). Angiography usually requires intravascular catheter placement, and involves exposure of staff to some levels of radiation, as well as the administration of contrast agent to the animal. It also usually provides only two-dimensional images. More importantly, it provides information on the lumen diameter but not the tissues that cause the stenosis. Intravascular ultrasound provides excellent images of the vessel wall with fairly detailed information about the intimal and medial layers but is also invasive, requiring intravenous catheter placement, significant technical skill and expensive non-reusable ultrasound probes. Computed tomography (CT) can provide 3 dimensional images of the lumen but again this technique involves radiation exposure and provides limited information about the hyperplastic tissue.
Magnetic resonance imaging (MRI) has previously been used to detect stenoses within AV fistulas and grafts in patients (16–24). These previous investigations used contrast enhanced-MRI to yield luminal images of the vascular tree but no attempts were made to visualize the hyperplastic tissues per se. Recently, MRI has been used to visualize angioplasty-induced coronary lesions in a porcine model and the images were compared to ex vivo MRI and histological specimens from the same animals (25). Good agreement was observed for measurements of vessel wall thickness and area from the MR images and matched histology sections. Here we report the use of MRI to visualize not only the lumen, but also the development of hyperplastic tissue itself in hemodialysis AV grafts in vivo in a porcine model of AV graft failure.
Materials and Methods
Porcine AV graft model
Yorkshire cross-domestic pigs, weighing approximately 30 kg, were used for graft implantation. The animals were initially anesthetized with an intramuscular injection of xylazine (4 mg/kg) (Lloyd Laboratories, Shenandoah IA), tiletamine/zolazepam (telazol) (4 mg/kg) (Fort Dodge Animal Health, Fort Dodge, IA), and ketamine (4 mg/kg) (Hospira Inc., Lake Forrest, IL), then intubated and anesthesia was maintained with 1–3% isoflurane. Under sterile conditions, 7-cm long, 6-mm internal diameter, spiral-reinforced expanded polytetrafluoroethylene (PTFE) grafts (Bard Peripheral Vascular Inc., Tempe, AZ) were placed between the common carotid artery and the ipsilateral external jugular vein bilaterally, as previously described (6). In brief, after surgical exposure of the blood vessels, microvascular clamps were placed on the jugular vein proximal and distal to the incision site and an 8-mm longitudinal incision was made. The graft end, cut at a 55° angle, was then attached with 6.0 sutures to the vessel wall creating an end-to-side anastomosis. An 8-mm incision was also made in the carotid artery and the other end of the graft, also cut at a 55° angle, was similarly attached such that the graft loop lay in the cranial direction. The clamps were then removed and the anastomoses inspected for patency and hemostasis. The procedure was repeated on the contralateral side. A total of 100–150 units/kg sodium heparin (Baxter, Deerfield, IL) was given during the surgery. Aspirin EC (81 mg/day) (Phamaceutical Formulations, Edison, NJ), clopidogrel (225 mg/day) (Bristol-Myers Squibb, New York, NY) and enrofloxacin (5mg/kg) (Baytril, Bayer, Pittsburgh, PA) were administrated perioperatively. All animal work was performed under protocols approved by the Institutional Animal Care and Use Committee of the University of Utah and Veterans Affairs Salt Lake City Healthcare System and conformed to the guidelines established by the Guidelines for the Care and Use of Laboratory Animals (NIH Publication No. 85–23, revised 1996).
Magnetic resonance imaging
The animals were anesthetized with an intramuscular injection of xylazine (4 mg/kg), telazol (4 mg/kg), and ketamine (4 mg/kg), intubated, and placed in a recumbent supine position in the MRI scanner (Siemens 3T TRIO Siemens Medical Solutions, Erlangen Germany). Animals were imaged with bilateral radio frequency (RF) receive-only phased-array coils. The majority of imaging studies were performed with 8 total coil elements forming 2 sets of bilateral pair array coils. Four of the coil elements (2 bilateral paired arrays) were each 5×7 cm and were placed directly over the surgical sites (26). The other 4 coil elements (2 additional bilateral paired arrays) were each 9.5×11.5 cm and were placed on the sides of the neck to enhance overall image quality (27). Some scans were performed with only the 4 smaller elements. A localization scan was carried out using Axial 2D time of flight (TOF), echo time/repetition time (TE/TR) =5.9/25 ms. To obtain improved vessel-wall definition and suppress flow-related artifacts, black-blood images were then obtained using a 3D turbo spin echo (TSE) sequence (the primary imaging sequences and parameters used in this study are listed in Table 1). To obtain 3D images of the graft-vascular geometry based on blood flow, 3D TOF was applied to yield white-blood images. 2D T2 weighted images were obtained by using a T2 TSE sequence. These images were compared with the 3DTSE images to clarify lumen area in the event of flow artifacts. 2D black blood images with high in-plane resolution at the anastomoses were obtained using a TSE sequence with double inversion preparation. Longitudinal vessel geometry was determined from axial 2DTOF images (TE/TR=5.9/30 ms) at baseline, and by oblique coronal-reformatted images from 3D contrast-enhanced FLASH scans (slice thickness 800 μm, TE/TR=1.5/5.0 ms). In the animals that were serially imaged, the entire protocol was repeated at 1, 2, 3, 5 and 7 weeks post-graft placement.
Table 1.
Imaging sequences and parameters Imaging
| sequence | Purpose | Imaging parameters |
|---|---|---|
| 3D TSE | To obtain blackblood images of vessel wall and suppress flow-related artifacts | TE/TR=11/665 ms, readout bandwidth of 140Hz/pixel, 17 ETL, FOV=192×156 mm2, imaging matrix of 384×312, 0.5×0.5×0.5 mm3 voxel dimensions |
| 3D TOF | To obtain 3D whiteblood images of graft vascular geometry based on blood flow. | TE/TR=4.0/25.0 ms, readout bandwith 190 hz/pixel, FOV=130×130 mm2 or 150×150 mm2, imaging matrix of 384×312×64, 0.3×0.45×0.6 mm3 voxel dimensions |
| 2D T2 TSE | For comparison with 3D TSE images to clarify lumen area | TE/TR=63/5000 ms, readout bandwith=210 hz/pixel, 15 ETL, FOV=180×180, imaging matrix of 256×256, 0.7×0.7×1.5 mm3 voxel dimensions. |
| TSE with double inversion preparation | To obtain 2D black blood images with high in-plane resolution at the anastomoses. | TE/TR=13/700 ms, readout bandwidth=250hz/pixel, 9 ETL, FOV=150×150, imaging matrix of 328×328, 0.48×0.48×2mm voxel dimensions. |
| Axial 2D TOF | To obtain white blood images of longitudinal vessel geometry | TE/TR=5.9/30 ms, readout bandwith=72hz/pixel, FOV 160×160mm, 3mm thickness, imaging matrix of 256×256 |
A total of eight animals were used for these studies. One animal received a baseline scan prior to surgery but did not undergo further MR studies due to surgical complications. One animal was scanned at three weeks, one at four weeks and three animals were scanned at six weeks post-graft placement. Two animals underwent sequential scanning at one, two, three, five and seven weeks after graft placement. The images were imported into OsiriX medical imaging software (v 2.5.1) on a Mac PowerBook G4 for further analysis. To register MR images with histological slices, multi-planar reconstruction was carried out on the 3D TSE images using the Osirix 2D multi-planar reconstruction tool.
Histological analysis
At various time points after graft placement, the animals were euthanized and the grafts with adjacent tissues were explanted for histological analysis in order to make comparisons with MR images. In brief, after surgical exposure of the grafts and attached vessels in anesthetized animals, heparin was administered (200 units/kg), then the artery and veins distal and proximal to the anastomosis were ligated. The artery was cannulated, a drain incision was made in the proximal vein, and the lumen of the grafts and adjoining arteries and veins were then rinsed with saline. The animals were then euthanized using pentobarbital sodium (80–100 mg/kg) injected intravenously and the grafts and vessels were perfused immediately in situ with 10% zinc formalin. The native vessels were then dissected at ~3 cm distal and proximal to the graft anastomoses. The arterial and venous segments and graft were explanted en bloc and fixed in 10% zinc formalin overnight. The graft and vessels were cut into five 5-mm blocks perpendicular to the blood vessel long axis to yield lumen cross sections, with one block containing the graft-vessel anastomosis, two blocks containing the contiguous upstream vessel regions and two blocks containing the contiguous downstream vessel regions. The slice direction is indicated by the solid-dotted black line in the line drawings in Figure 2. These blocks were then embedded in paraffin and 5-μm thick sections were stained with H&E, Masson’s trichrome stain, or EVG (Richard Allan Scientific, Kalamazoo, MI). JPEG images of the histological cross-sections were imported into NIH ImageJ (http://rsb.info.nih.gov/ij) where hyperplasia surface areas were measured for comparison with areas acquired in MR images.
Figure 2. Longitudinal vessel geometry.
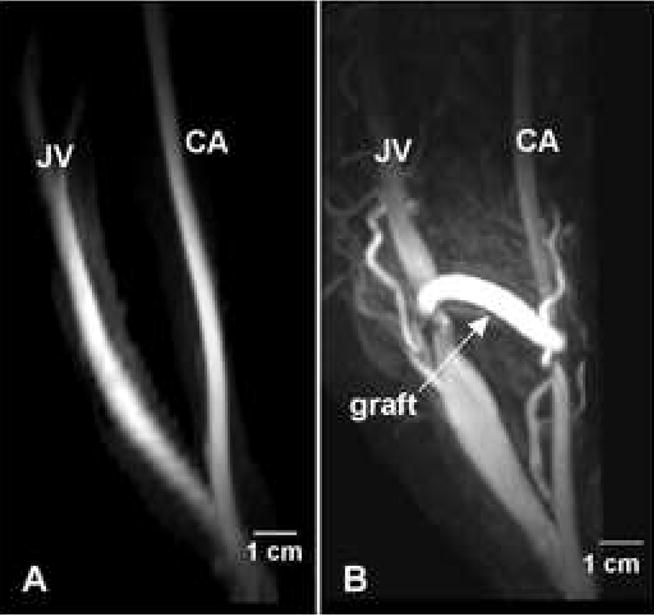
(A) MRI of the carotid artery (CA) and jugular vein (JV) obtained one week prior to graft placement. (B) MRI of the CA and JV of the same animal at two weeks after graft placement.
Correlation of surface areas collected from MR images or histology
MR images collected using the 3D TSE pulse sequence were registered with the corresponding histology sections obtained from the graft-venous anastomoses by viewing the MR cross-sectional image series simultaneously with the 3D coronal reformatted image series. The MR cross-section could then be pinpointed to the location within the anastomosis from which the histological section had been obtained. The angle of the cross-sectional slice could be adjusted using multiplanar reconstruction to identify the angle at which the histology slice was obtained. If the image collected by TSE MRI with double inversion preparation was from the same location from which the histology was collected, this image was used for surface area calculations due to its superior in-plane resolution. However, as this sequence produced only a 2 mm thick slice, the resulting image at times did not cover the location from which the histology was obtained. In addition, multiplanar reconstruction of the 2 mm slice was not useful for identifying the histology slice angle. In those instances the images from the 3D TSE sequences were used as described above. Surface area values of hyperplasia obtained from MR images using Osirix software were correlated with surface area values obtained from histology sections from the same animal by Pearson’s correlation (2-tailed and p value at 0.05 level of signficance).
Results
Histology of AV graft hyperplasia
Figure 1 shows two color histology sections taken from venous anastomoses of the porcine model of AV graft stenosis. The tissue section shown in (A) was processed with EVG that stains the elastic lamina black. Although some intimal hyperplasia is observed in the native vessel wall, the majority of the hyperplasia typically occurs within the graft as depicted here. Many cells that make up the hyperplasia express alpha-smooth muscle actin, indicating they are smooth muscle cells and/or myofibroblasts (10). As has been reported elsewhere, staining with Masson’s trichrome indicated the lesion is also characterized by the presence of large amounts of extracellular matrix (data not shown). The tissue section shown in (B) has been stained with H&E and demonstrates the pitfalls of histology peculiar to the AV graft where the graft material often pulls away from the slide.
Figure 1.
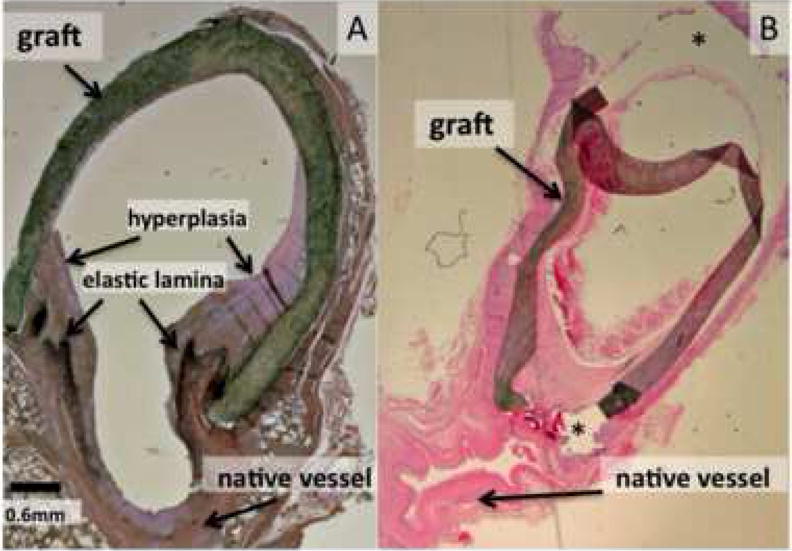
Histology sections from the porcine model of AV graft stenosis. (A) A tissue section taken at four weeks after graft placement and stained with EVG as described in the Methods section. The elastic lamina is stained dark black and hyperplasia is stained lighter purple. (B) A tissue section taken at six weeks after graft placement then stained with H&E. The graft has partially pulled away from the slide in the areas indicated by the asterisks (*).
Comparison of in vivo MR image and corresponding ex vivo histological section
Figure 2A shows a maximum intensity projection (MIP) MR image of the lumen of a common carotid artery and external jugular vein in a normal pig prior to graft placement. A baseline MRI was collected on another animal as well, with the carotid artery and external jugular vein geometry appearing very similar to that in Figure 1A (data not shown). However, this animal was discontinued from the study due to surgical complications and further MRIs were not collected. Figure 2B shows the vessel geometry in the same animal two weeks after graft placement. The jugular vein was markedly enlarged in both the proximal and distal segments but appeared narrowed at the anastomosis. This narrowing at the vein-graft anastomosis likely arises due to scar formation at the site of suturing. Similar changes were observed in all animals regardless of the imaging time point, indicating the vein becomes engorged early after graft placement. This engorgement is similar to what is observed in human patients and occurs because the vein walls do not have the muscular medial layer of the arteries and are stretched by the high volume arterial flow.
Figure 3A–3C shows the MR image of a venous anastomosis obtained without contrast injection from an animal at 6 weeks post graft placement. Using 2D multi-planar reconstruction to select the angle, appropriate reformatted MR images of the anastomosis could be obtained (Figure 3D) for accurate comparison with histology (Figure 3E). In this manner, MR images collected from various regions of the anastomosis based on the orthogonal views could be compared accurately with corresponding histological sections obtained post-mortem within hours of the final MRI. The line drawings of the graft in Figure 3 illustrate the location in the graft from which the MR image and histological section were taken. In the histology section shown in (3E) the graft has partially pulled away, illustrating the difficulty in obtaining AV graft tissue sections that are not influenced by preparation artifacts. In addition, the narrow vein lumen, although patent in the in vivo MRI (2D), has partially collapsed during tissue processing (2E). Typically, hyperplasia at the graft anastomosis is analyzed histologically within three different locations; the “toe” region, the “middle” region, and the “heel” region”, as shown in Figure 3. Figure 3D, 3F and 3H show cross-sectional MR images from the toe, middle and heel regions of the same graft anastomosis respectively. The corresponding histological sections are shown in Figure 3E, 3G and 3I. In this series of images, the MR shows hyperplasia forming along all sections of the graft juxtaposed to the vessel wall and the hyperplasia is confirmed in the corresponding histological sections. Examples of MR cross-sectional images of the graft anastomoses and the corresponding histological sections from other animals are shown in Figure 4. These observations illustrate the similarity between the hyperplasia shape and magnitude obtained in vivo by MRI, and hyperplasia obtained ex vivo by histology in the same animals.
Figure 3. Serial MR images and corresponding histology along an AV graft taken at 6 weeks after graft placement.
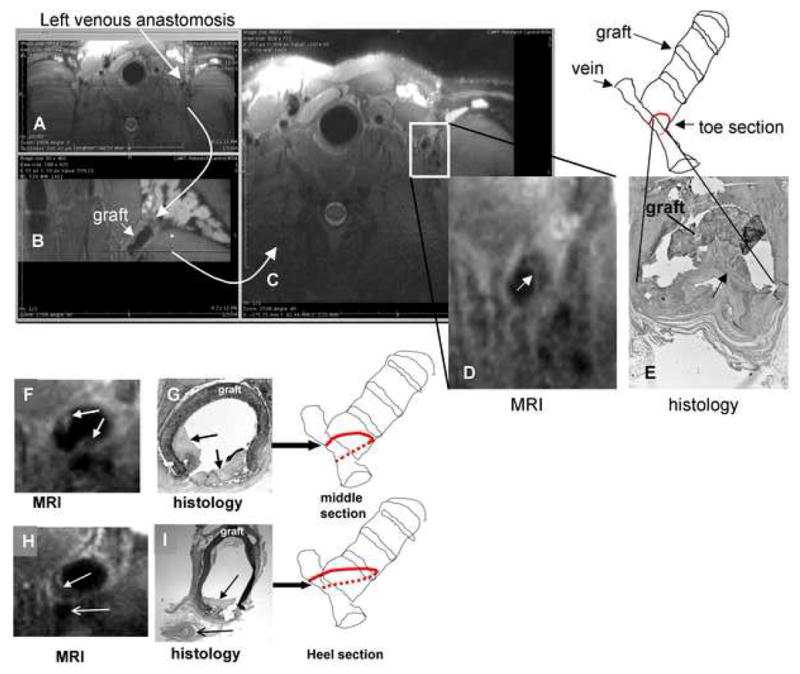
The axial MR image (a 3D volume collected by 3D TSE) of the left venous anastomosis in a pig (A) underwent 2D multi-planar reconstruction to yield (B) and (C). (B) provides a view orthogonal to the vertical dotted line dissecting the anastomosis in (A). (C) provides a view orthogonal to the horizontal dotted line dissecting (B). The view in (B) provides orientation of the angle and location at which the image in (C) was collected, allowing accurate registration of the MR image with the histological image in (E). (D) shows the enlarged image of the venous anastomosis collected in (C) with the closed arrow pointing to the hyperplastic tissue lining the graft. The line drawing represents the graft image in (B) and the location from which the MR image in (D) and histological section in (E) were obtained. (F) and (H) show respective MR images obtained from the sequential middle and heel sections of the same venous anastomosis presented in (A), while (G) and (I) are the corresponding histological sections (stained with H&E). The open arrows in (H) and (I) indicate an adjacent blood vessel. Closed arrows in this figure indicate hyperplastic tissue.
Figure 4. Examples from additional animals comparing MR images with histology.
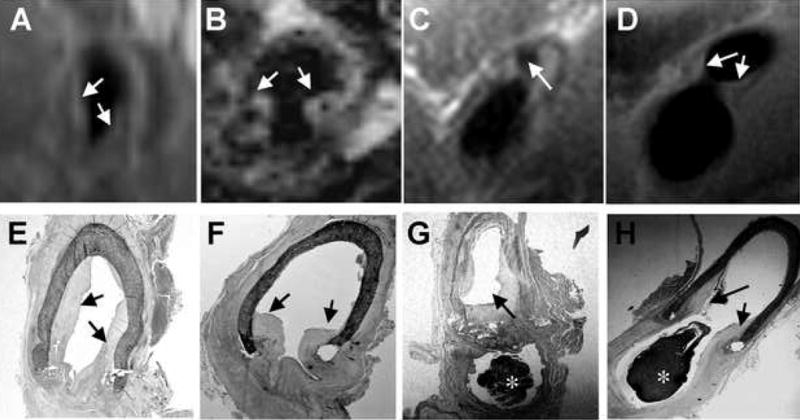
In vivo MR images (A–D) obtained without contrast injection, and the corresponding postmortem histological sections (E–H) were obtained within the same day. A, E and B, F are from two different animals; C, G and D, H are from the same animal but different sections of the right venous anastomosis. * indicates clot formed post-mortem.
Comparison of 2D black-blood TSE images and 3D black-blood TSE images
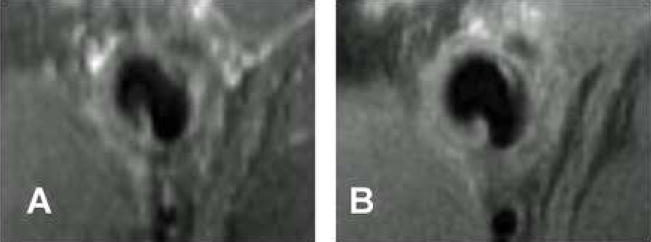
2D black-blood TSE MRI was performed on the anastomoses after carrying out 3D black-blood TSE. A comparison of the images obtained by 2D TSE and 3D TSE is shown in Figure 5. The 2D TSE yields an anisotropic image, that is, the image resolution is higher in-plane than through-plane. Thus the 2D TSE pulse sequence provided higher in-plane resolution as shown in Figure 5B, than the 3D TSE sequence (Figure 5A) but through-plane resolution was lower. Although higher in-plane resolution was obtained with 2D TSE, it was not always possible to localize the 2D TSE scan region at precisely the same region of the anastomosis that was collected for histological analysis. Thus, in some instances, it was necessary to compare the images acquired by 3D TSE, which covered a larger longitudinal area, to the sections acquired for histological analysis. In addition, the 3D TSE images allowed for 2D multiplanar reformatting, permitting more accurate registration of the image with histology.
Figure 5. Comparison of 3D black-blood TSE (A) and 2D black-blood TSE (B) for visualizing hyperplasia within the AV graft.
Images were taken from the venous anastomosis of the same animal at the same location at two weeks post-graft placement. No contrast was injected for these images. The 2D blackblood TSE yields higher in-plane resolution.
Serial MR imaging of arteriovenous graft hyperplasia development
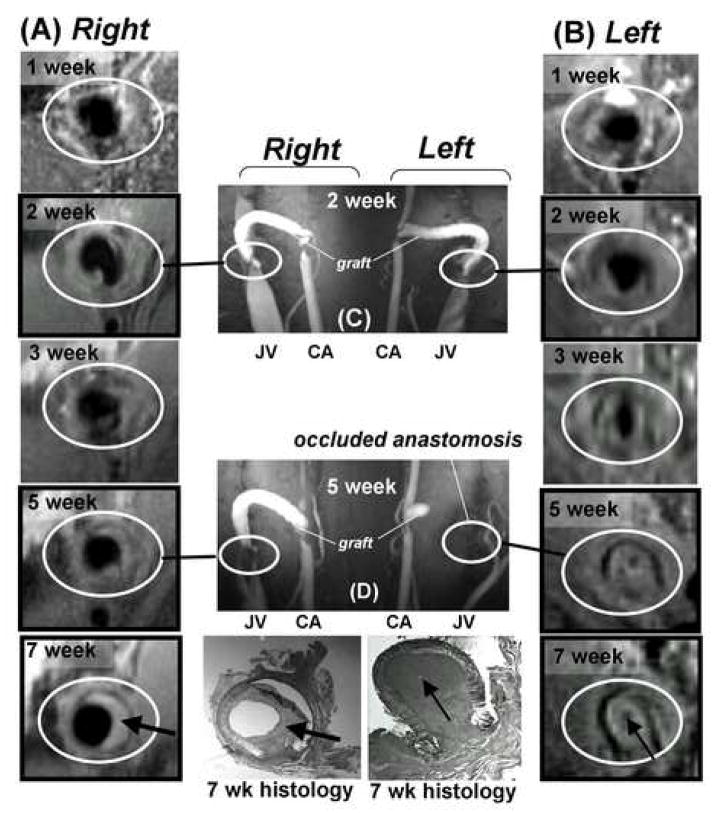
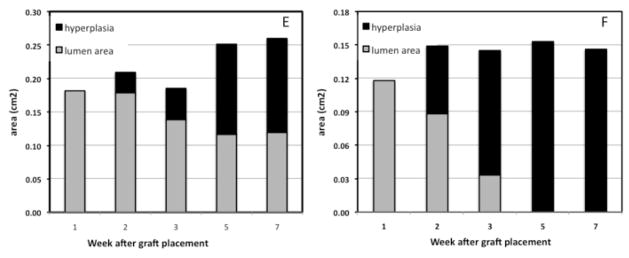
A main advantage of radiographic modalities is that they allow for repeated monitoring without sacrificing the animal. To illustrate this point, serial MRIs on two animals were performed to follow hyperplasia development over a period of seven weeks after graft placement. On one of these animals, a baseline MRI scan was carried out at one week prior to graft placement (shown in Figure 2A). Figure 6 shows sequential MR images of the right (A) and left (B) venous anastomoses (encircled in white) taken at one, two, three, five and seven weeks after graft placement in a single animal. Small amounts of hyperplasia could be observed as early as two weeks after graft placement. By week five, the left venous anastomosis was almost completely occluded whereas the right venous anastomosis was still patent (Figure 6). The findings in the MR images at week seven were confirmed by histology on the tissues collected immediately after imaging. These MR images clearly demonstrated that this technique is very useful for monitoring hyperplasia formation over time, which is not possible using histology. This data also reveals that variable amounts of hyperplasia formation occur within different locations in a graft from the same animal, in addition to the variable amount of graft hyperplasia that is observed between animals. The uneven formation of hyperplasia within one graft further supports the need for complete examination throughout a graft for hyperplasia formation instead of in a few representative slices that are typically obtained by histology.
Figure 6. MR imaging of hyperplasia development in one animal over time.
(A) and (B) show cross-sectional MR images obtained in the absence of contrast injection at the venous anastomoses of the right and left AV grafts in the same animal at the same location and angle over a period of 1–7 weeks. Images in frames without black border (1 and 3 weeks) were obtained with 3D black-blood TSE; images in frames with black border (2, 5 and 7 weeks) were obtained with 2D black-blood TSE. The two bottom histology sections correspond to the respective MR images (7 weeks) at the time of euthanasia. (C) and (D) show coronal vessel geometry collected at 2 and 5 weeks after graft placement by MRI with gadolinium contrast injection. Graft, jugular vein (JV) and carotid artery (CA) are indicated. Black-blood images in (A) and (B) were collected before contrast injection. The two column grafts at the bottom of the figure illustrate the changes in lumen area and hyperplasia area for the right (E) and left (F) sides.
Acquisition of MR images also allowed for the examination of the same AV graft from various angles, something that is not possible using histological sections from a tissue block. An MR image of a coronal view along the length of an AV graft that was in place for seven weeks is shown in Figure 7. The hyperplasia is clearly discernible at the venous anastomosis extending up the inside curve of the graft. This image again illustrates that the hyperplasia formation is not always uniform within the graft.
Figure 7.
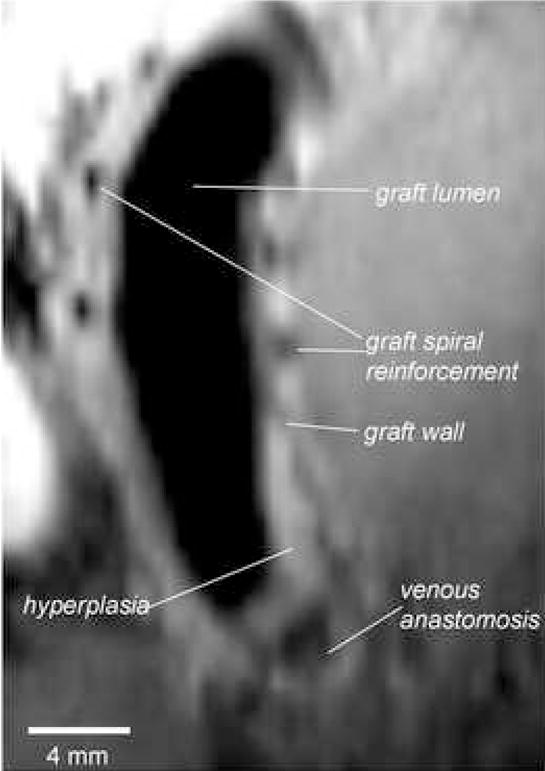
MR image collected with 3D TSE showing a longitudinal cross-sectional view of an AV graft at seven weeks after placement. The external plastic spiral reinforcements of the PTFE graft were detected by the absence of signal.
Quantification of hyperplasia surface areas by MR imaging and histology
The surface areas of hyperplasia in MR image sections and the corresponding histology sections were quantified using Osirix software and ImageJ, respectively and the findings are shown in Table 2. The areas obtained from histology and from MR images were significantly correlated (r=0.932, p=0.02).
Table 2.
Area of hyperplasia determined by histology and MR images
| * Hyperplasia area (mm2) | ||
|---|---|---|
| section no. | histology | MR image |
| 1 | 8.4 | 8.4 |
| 2 | 14.2 | 16.5 |
| 3 | 15.6 | 18.8 |
| 4 | 10.6 | 16.1 |
| 5 | 5.4 | 7.3 |
AV grafts were explanted and fixed with formalin directly after MR image acquisition. Hyperplasia surface areas were obtained from MR images using Osirix software and from histology using ImageJ. r = 0.932, p= 0.02, n = 5 different anastomoses from 3 animals.
Discussion
We have shown in these studies the utility of MR imaging performed without contrast agent to follow longitudinal hyperplasia development, in a large animal model of AV graft stenosis. We report a good correlation of hyperplasia area measurements obtained by MRI with those obtained by histology. Misra et al. recently reported the use of contrast-enhanced MR angiography to monitor the lumen in a porcine iliac artery-to-iliac vein graft model up to 14 days after graft placement (28). However, the hyperplastic tissue itself was not assessed using that methodology. In another study, contrast-enhanced MRA has also been shown to be an accurate, sensitive technique for detecting stenoses in AV grafts and fistulas in patients, but again there was no attempt to visualize the hyperplastic tissues (18).
Recently, excellent images of atherosclerotic or injured coronary arteries in animal models and patients have been produced utilizing a 1.5T magnet in the absence of contrast agent. For example, in a rabbit model of atherosclerosis, fibrotic and lipidic areas could be delineated separately and measured in MR images, yielding values that correlated well with those obtained by histology from the same animals (29). In a porcine model of arterial injury, mean vessel wall thicknesses and vessel wall areas obtained from MRI were comparable to values derived from the associated histology (25). In contrast, as hyperplasia that forms in AV grafts in both human patients and animal models is typically not characterized by lipid-rich regions but rather is primarily fibrotic in nature, we did not observe different MR signal intensities from fatty streaks and fibrotic tissue in the AV graft lesion (30, 31). Fatty streaks were also not observed in the histological sections in the current study. The lesion is primarily made up of extracellular matrix and smooth muscle cell-like cells and not by lipid. Although MRI can differentiate between atherosclerotic plaque and healthy tissue in arteries, and can detect calcium-laden vessels, 3T MRI currently lacks the resolution to clearly differentiate, unassisted by contrast agent, fibrotic and normal tissue in veins.
We are actively investigating methods to improve the ability of MR to differentiate the various components that make up the stenotic lesion. For example, delayed contrast enhancement has been used to image heart tissue damaged after myocardial infarction. It is possible this technique could enhance the fibrotic lesion that occurs in the AV graft. In addition, high resolution multicontrast MRI including T1w, T2w, proton density or diffusion weighted imaging, may improve the ability of MR to differentiate various tissue components in the hyperplastic region. This remains to be tested.
Numerous macrophages were observed in the histology as expected from our previous studies. The influx of macrophages could be monitored by MRI if the monocytes are labeled in vivo by uptake of superparamagnetic iron oxide particles (32, 33). We propose to use this methodology to study the effects of drug treatment on macrophage recruitment to the graft and to examine the correlation of macrophage recruitment with development of stenosis. Also, Ke et al recently reported the use of an Arg-Gly-Asp (RGD) peptide incorporated onto a gadolinium-polymer conjugate for in vivo detection of neoplastic tissues by MRI (34). RGD binds to αvβ3 integrins which are highly expressed on proliferating endothelial cells. As the AV graft stenosis is marked by angiogenesis, it may be possible to use such a biomarker-targeted contrast agent to enhance imaging of the AV graft pathology. In addition, MR imaging of the hyperplasia and lumen could be combined with spatially- and temporally-resolved blood velocity data obtained by cine-phase contrast MRI to investigate the effect of flow on stenosis development.
A novel aspect of the present study is the MR imaging of hyperplasia in a non-atherosclerotic vein, rather than an atherosclerotic artery. In addition, the longitudinal development of the hyperplastic tissues over time was monitored and the surface areas of the hyperplasia could be quantified and compared to those obtained from histology. A tendency for measurements of hyperplasia in MR images to be slightly greater than those from histology, as shown in Table 2, is similar to what is reported in published coronary artery studies. Two phenomena likely contribute to this discrepancy. Shrinkage of tissue after fixation, likely gave rise to low estimates of hyperplasia by histology, and volume averaging across an imaging slice likely contributed to over-estimation of hyperplasia by MRI.
Although the MR provides high-resolution 3D images of longitudinal development of hyperplasia undistorted by tissue processing, there are drawbacks to this method. A 3T scanner was used to obtain the detailed images of hyperplasia shown in this report. Such high field magnets are not available to many investigators. In addition, MRI is a relatively expensive technique, as well as time consuming, typically requiring over one hour to perform the necessary pulse sequences. This technique requires partnership with individuals with comprehensive expertise in magnetic resonance imaging as well. Although this study showed good correlation of the hyperplasia area between histology and MR images, the sample size was small due to technical issues with the AV graft histology. Further study is required to confirm these initial findings.
An important feature of MR imaging is the ability to view the AV graft from multiple angles yielding a more complete picture of hyperplasia throughout the graft and attached native vessels than that provided by histology. Our present data showed that hyperplasia formation was not uniform within the graft lumen. Such non-uniform development emphasizes the need for a more complete analysis of the graft than can be readily achieved with histological analysis alone. Although the luminal geometry and blood flow rates will be of ultimate interest for clinical purposes, the ability to identify the geometry of the hyperplastic tissues and quantify the tissue volume throughout the graft would be of importance in assessing the efficacy of anti-proliferative interventions, such as drugs or radiation. Thus MRI can be a useful modality in such studies.
Acknowledgments
The authors express thanks to Tadashi Kuji, M.D., Bonnie Kwan, M.D., and Mr. Ilya Zhuplatov for expert technical assistance with animal surgery, and Ms. Melody Johnson for her expert assistance with the MR imaging. We thank Ms. Emilee Shaw for help with the MRI coils.
Funding sources
This work was supported by the National Heart, Lung and Blood Institute (RO1HL067646 Prevention of hemodialysis vascular access stenosis and RO1 HL57990 High resolution cervical carotid imaging), Medical and Research Services of the Department of Veterans Affairs, and the Dialysis Research Foundation, Ogden, UT. Expanded PTFE (Impra®) grafts were kind gifts of Bard Peripheral Vascular, Inc.
Footnotes
Disclosures
The authors have no conflicts to disclose.
Publisher's Disclaimer: This is a PDF file of an unedited manuscript that has been accepted for publication. As a service to our customers we are providing this early version of the manuscript. The manuscript will undergo copyediting, typesetting, and review of the resulting proof before it is published in its final citable form. Please note that during the production process errors may be discovered which could affect the content, and all legal disclaimers that apply to the journal pertain.
References
- 1.US Renal Data System: USRDS 2000 Annual Data Report. Bethesda, MD: The National Institutes of Health, National Institute of Diabetes and Digestive and Kidney Diseases; 2000. [Google Scholar]
- 2.Schwab SJ. Hemodialysis vascular access: the Achilles’ heel remains. Kidney Int. 2007;72:665–666. doi: 10.1038/sj.ki.5002470. [DOI] [PubMed] [Google Scholar]
- 3.Li L, Terry CM, Shiu Y-T, et al. Neointimal hyperplasia associated with hemodialysis grafts. Kidney International. 2008 doi: 10.1038/ki.2008.318. in press. [DOI] [PMC free article] [PubMed] [Google Scholar]
- 4.Rotmans JI, Velema E, Verhagen HJ, et al. Rapid, arteriovenous graft failure due to intimal hyperplasia: a porcine, bilateral, carotid arteriovenous graft model. J Surg Res. 2003;113:161–171. doi: 10.1016/s0022-4804(03)00228-2. [DOI] [PubMed] [Google Scholar]
- 5.Kelly BS, Heffelfinger SC, Whiting JF, et al. Aggressive venous neointimal hyperplasia in a pig model of arteriovenous graft stenosis. Kidney Int. 2002;62:2272–2280. doi: 10.1046/j.1523-1755.2002.00684.x. [DOI] [PubMed] [Google Scholar]
- 6.Kuji T, Masaki T, Goteti K, et al. Efficacy of local dipyridamole therapy in a porcine model of arteriovenous graft stenosis. Kidney Int. 2006;69:2179–2185. doi: 10.1038/sj.ki.5000383. [DOI] [PubMed] [Google Scholar]
- 7.Johnson MS, McLennan G, Lalka SG, et al. The porcine hemodialysis access model. J Vasc Interv Radiol. 2001;12:969–977. doi: 10.1016/s1051-0443(07)61578-4. [DOI] [PubMed] [Google Scholar]
- 8.Asif A, Gadalean FN, Merrill D, et al. Inflow stenosis in arteriovenous fistulas and grafts: a multicenter, prospective study. Kidney Int. 2005;67:1986–1992. doi: 10.1111/j.1523-1755.2005.00299.x. [DOI] [PubMed] [Google Scholar]
- 9.Cheung AK, Terry C, Li L. Pathogenesis and local drug delivery for prevention of vascular access stenosis. J Ren Nutr. 2008;18:140–145. doi: 10.1053/j.jrn.2007.10.028. [DOI] [PMC free article] [PubMed] [Google Scholar]
- 10.Li L, Terry CM, Blumenthal DK, et al. Cellular and morphological changes during neointimal hyperplasia development in a porcine arteriovenous graft model. Nephrol Dial Transplant. 2007;22:3139–3146. doi: 10.1093/ndt/gfm415. [DOI] [PubMed] [Google Scholar]
- 11.Roy-Chaudhury P, Sukhatme VP, Cheung AK. Hemodialysis vascular access dysfunction: a cellular and molecular viewpoint. J Am Soc Nephrol. 2006;17:1112–1127. doi: 10.1681/ASN.2005050615. [DOI] [PubMed] [Google Scholar]
- 12.Terry CM, Blumenthal DK, Sikharam S, et al. Evaluation of histological techniques for quantifying haemodialysis arteriovenous (AV) graft hyperplasia. Nephrol Dial Transplant. 2006;21:3172–3179. doi: 10.1093/ndt/gfl366. [DOI] [PubMed] [Google Scholar]
- 13.Rotmans JI, Pattynama PM, Verhagen HJ, et al. Sirolimus-eluting stents to abolish intimal hyperplasia and improve flow in porcine arteriovenous grafts: a 4-week follow-up study. Circulation. 2005;111:1537–1542. doi: 10.1161/01.CIR.0000159332.18585.B5. [DOI] [PubMed] [Google Scholar]
- 14.Sun S, Beitler JJ, Ohki T, et al. Inhibitory effect of brachytherapy on intimal hyperplasia in arteriovenous fistula. J Surg Res. 2003;115:200–208. doi: 10.1016/s0022-4804(03)00253-1. [DOI] [PubMed] [Google Scholar]
- 15.McLennan G, Trerotola SO, Forney M, et al. Short-term patency and safety of an expanded polytetrafluoroethylene encapsulated endoluminal device at the venous anastomosis of a canine arteriovenous graft model. J Vasc Interv Radiol. 2001;12:227–234. doi: 10.1016/s1051-0443(07)61830-2. [DOI] [PubMed] [Google Scholar]
- 16.Bakker CJ, Peeters JM, Bartels LW, et al. Magnetic resonance techniques in hemodialysis access management. The journal of vascular access. 2003;4:125–139. [PubMed] [Google Scholar]
- 17.Zhang J, Hecht EM, Maldonado T, et al. Time-resolved 3D MR angiography with parallel imaging for evaluation of hemodialysis fistulas and grafts: initial experience. Ajr. 2006;186:1436–1442. doi: 10.2214/AJR.05.1351. [DOI] [PubMed] [Google Scholar]
- 18.Doelman C, Duijm LE, Liem YS, et al. Stenosis detection in failing hemodialysis access fistulas and grafts: comparison of color Doppler ultrasonography, contrast-enhanced magnetic resonance angiography, and digital subtraction angiography. J Vasc Surg. 2005;42:739–746. doi: 10.1016/j.jvs.2005.06.006. [DOI] [PubMed] [Google Scholar]
- 19.Froger CL, Duijm LE, Liem YS, et al. Stenosis detection with MR angiography and digital subtraction angiography in dysfunctional hemodialysis access fistulas and grafts. Radiology. 2005;234:284–291. doi: 10.1148/radiol.2341031859. [DOI] [PubMed] [Google Scholar]
- 20.Han KM, Duijm LE, Thelissen GR, et al. Failing hemodialysis access grafts: evaluation of complete vascular tree with 3D contrast-enhanced MR angiography with high spatial resolution: initial results in 10 patients. Radiology. 2003;227:601–605. doi: 10.1148/radiol.2272012079. [DOI] [PubMed] [Google Scholar]
- 21.Laissy JP, Menegazzo D, Debray MP, et al. Failing arteriovenous hemodialysis fistulas: assessment with magnetic resonance angiography. Invest Radiol. 1999;34:218–224. doi: 10.1097/00004424-199903000-00011. [DOI] [PubMed] [Google Scholar]
- 22.Bos C, Smits JH, Zijlstra JJ, et al. MRA of hemodialysis access grafts and fistulae using selective contrast injection and flow interruption. Magn Reson Med. 2001;45:557–561. doi: 10.1002/mrm.1075. [DOI] [PubMed] [Google Scholar]
- 23.Waldman GJ, Pattynama PM, Chang PC, et al. Magnetic resonance angiography of dialysis access shunts: initial results. Magn Reson Imaging. 1996;14:197–200. doi: 10.1016/0730-725x(95)02054-w. [DOI] [PubMed] [Google Scholar]
- 24.Smits JH, Bos C, Elgersma OE, et al. Hemodialysis access imaging: comparison of flow-interrupted contrast-enhanced MR angiography and digital subtraction angiography. Radiology. 2002;225:829–834. doi: 10.1148/radiol.2253010879. [DOI] [PubMed] [Google Scholar]
- 25.Worthley SG, Helft G, Fuster V, et al. Noninvasive in vivo magnetic resonance imaging of experimental coronary artery lesions in a porcine model. Circulation. 2000;101:2956–2961. doi: 10.1161/01.cir.101.25.2956. [DOI] [PubMed] [Google Scholar]
- 26.Hayes CE, Mathis CM, Yuan C. Surface coil phased arrays for high-resolution imaging of the carotid arteries. J Magn Reson Imaging. 1996;6:109–112. doi: 10.1002/jmri.1880060121. [DOI] [PubMed] [Google Scholar]
- 27.Hayes CE, Hattes N, Roemer PB. Volume imaging with MR phased arrays. Magn Reson Med. 1991;18:309–319. doi: 10.1002/mrm.1910180206. [DOI] [PubMed] [Google Scholar]
- 28.Misra S, Doherty MG, Woodrum D, et al. Adventitial remodeling with increased matrix metalloproteinase-2 activity in a porcine arteriovenous polytetrafluoroethylene grafts. Kidney Int. 2005;68:2890–2900. doi: 10.1111/j.1523-1755.2005.00763.x. [DOI] [PubMed] [Google Scholar]
- 29.Helft G, Worthley SG, Fuster V, et al. Atherosclerotic aortic component quantification by noninvasive magnetic resonance imaging: an in vivo study in rabbits. J Am Coll Cardiol. 2001;37:1149–1154. doi: 10.1016/s0735-1097(01)01141-x. [DOI] [PubMed] [Google Scholar]
- 30.Swedberg SH, Brown BG, Sigley R, et al. Intimal fibromuscular hyperplasia at the venous anastomosis of PTFE grafts in hemodialysis patients. Clinical, immunocytochemical, light and electron microscopic assessment. Circulation. 1989;80:1726–1736. doi: 10.1161/01.cir.80.6.1726. [DOI] [PubMed] [Google Scholar]
- 31.Sloop GD, Fallon KB, Zieske AW. Atherosclerotic plaque-like lesions in synthetic arteriovenous grafts: implications for atherogenesis. Atherosclerosis. 2002;160:133–139. doi: 10.1016/s0021-9150(01)00543-3. [DOI] [PubMed] [Google Scholar]
- 32.Corot C, Robert P, Idee JM, et al. Recent advances in iron oxide nanocrystal technology for medical imaging. Adv Drug Deliv Rev. 2006;58:1471–1504. doi: 10.1016/j.addr.2006.09.013. [DOI] [PubMed] [Google Scholar]
- 33.Herborn CU, Vogt FM, Lauenstein TC, et al. Magnetic resonance imaging of experimental atherosclerotic plaque: comparison of two ultrasmall superparamagnetic particles of iron oxide. J Magn Reson Imaging. 2006;24:388–393. doi: 10.1002/jmri.20649. [DOI] [PubMed] [Google Scholar]
- 34.Ke T, Jeong EK, Wang X, et al. RGD targeted poly(L-glutamic acid)-cystamine-(Gd-DO3A) conjugate for detecting angiogenesis biomarker alpha(v) beta3 integrin with MRT, mapping. International journal of nanomedicine. 2007;2:191–199. [PMC free article] [PubMed] [Google Scholar]


