Abstract
Nonlinear source-filter theory is applied to explain some acoustic differences between two contrasting male singing productions at high pitches: operatic style versus jazz belt or theater belt. Several stylized vocal tract shapes (caricatures) are discussed that form the bases of these styles. It is hypothesized that operatic singing uses vowels that are modified toward an inverted megaphone mouth shape for transitioning into the high-pitch range. This allows all the harmonics except the fundamental to be “lifted” over the first formant. Belting, on the other hand, uses vowels that are consistently modified toward the megaphone (trumpet-like) mouth shape. Both the fundamental and the second harmonic are then kept below the first formant. The vocal tract shapes provide collective reinforcement to multiple harmonics in the form of inertive supraglottal reactance and compliant subglottal reactance. Examples of lip openings from four well-known artists are used to infer vocal tract area functions and the corresponding reactances.
INTRODUCTION
Many of the pedagogical approaches to teaching singing styles are based on the concept that there are preferred vowel configurations for a given pitch (Appelman, 1967; Vennard, 1967; Miller, 1986, 2008). Speaking vowels are modified and adjusted not only to create a variety of timbres, but also to support the sound source in self-sustained oscillation by providing favorable acoustic reactance (Titze, 1988a; Fletcher, 1993). Because no source-vocal tract interaction is claimed in linear coupling, linear source-filter theory as traditionally applied to speech cannot account for source strengthening by vocal tract coupling, nor can it account for source instabilities and bifurcations in vocal fold oscillation related to vowel selection. In two recent investigations (Titze et al., 2008; Titze, 2008a) it has been shown that source energy in phonation (vocal fold vibration and the associated glottal airflow) can be significantly increased by vocal tract interaction. However, when any harmonic that carries a significant portion of the source energy passes through a formant (a vocal tract resonance), vocal fold vibration can also be destabilized. Pitch jumps, subharmonics, chaotic vocal fold vibration, and other bifurcations can occur that are (in part) attributable to acoustic loading by the vocal tract. Hence, it appears that a singer of harmonically-based singing styles may seek to obtain both stability and uniform reinforcement of the harmonics by carefully selecting a favorable vocal tract configuration.
An insightful exposition to contrasting styles was given by Schutte and Miller (1993). Focusing on the female voice in middle to high-pitch ranges, the authors observed that belters use vocal tract resonances (formants) differently from classically-trained (opera and art song) singers. In particular, the second harmonic was found to receive strong reinforcement by the first formant in belting, much more so than in the classically-trained style. Schutte and Miller (1993) went so far as to say that the entire characteristic of a belt is based on a strong second harmonic, combined with a high degree of glottal closure during vocal fold vibration. In a later investigation, Miller and Schutte (2005) demonstrated that successful bridging of registers in singing (perceptual discontinuities in the timbre of the sung tone) “may be more a consequence of skillful use of resonance than of muscular adjustments in the glottal voice source.” In the same year, Schutte et al. (2005) showed that some famous operatic tenors reinforce the third harmonic on a high Bb4 in a well-known operatic aria, “Celeste Aida.” They suggested that this is accomplished by elevating the second formant (F2).
Extending the investigations to a greater variety of male voices (basses, baritones, and tenors), Neumann et al. (2005) showed that in the male modal register (Hollien, 1974, 1983; Titze, 2000), the second and fourth harmonics dominate, one being resonated by the first formant and the other by the second formant. As the male singers transit through the primo passagio (a passage around F4 where a change occurs from modal register to a mixture of modal and falsetto registers), the third harmonic gains strength from the second formant, while the second harmonic loses energy. Neumann et al. (2005) also stated that supraglottal resonances play a greater role in register discrimination than subglottal resonances, reversing a former hypothesis by one of the current authors (Titze, 1988b).
The overall source spectrum distribution was studied by Stone et al. (2003). Studying a female that could sing several styles, they showed that the Broadway style (which often incorporates belt) has the greatest proportion of high-frequency energy, followed by the operatic style, and then by the normal speech of the subject. The subglottal pressure was higher in the Broadway style than in the operatic style, and the open quotient in the glottis was smaller. Overall, the formant frequencies were higher in Broadway style than operatic style.
What is not yet exposed in the above investigations is the interaction between source characteristics and vocal tract resonance. Traditional analysis has been guided by the long-standing linear source-filter theory (Fant, 1960), which assumes that the source and the filter operate independently, even though an explicit “correction” is given to the glottal waveform that carries vocal tract loading effects in the form of pulse skewing and formant ripple (Flanagan, 1968; Rothenberg, 1981; Fant, 1986, Fant and Lin, 1987). With such a flow source correction, source and filter can be combined or recombined (as in analysis—synthesis) spectrally to produce the mouth output, but interactions that increase the amplitude of vocal fold vibration or destabilize the source (i.e., major bifurcations in tissue movement) cannot be treated easily with such corrections.
Registers have generally been described in the domain of the sound source (for an up-to-date review, see Henrich, 2006), while voice quality and singing style have more often been described in the domain of vocal tract resonance (Estill, 1988; Yanagisawa et al., 1991; Miller, 2008; Story et al., 2001; Bergan et al., 2004). That variations in the source and the filter co-exist in the singing styles have clearly been recognized, but how they feed off each other (constructively and destructively) has only been described recently (for a popular review, see Titze, 2008b).
The current nonlinear source-filter theory for singing is based on the assumption that stored energy in the vocal tract can assist in vocal fold vibration through feedback. The stored energy is quantified in terms of acoustic reactance of the air column above or below the vocal folds. Thus, for certain singing styles, there can be a much closer analogy to wind instrument acoustics (Fletcher, 1993; Fletcher and Rossing, 1998) than has traditionally been claimed for speech. In fact, the analogy between lip vibration in brass acoustics and vocal fold vibration in vocal tract acoustics for singing is remarkable (Adachi and Sato, 1996; Ayers, 1998). Yet there is a major difference. In singing, multiple resonances of the vocal tract are not generally “tuned” to the harmonics of the source. Two factors prevent this: (1) the shortness of the tube (15–20 cm for a supraglottal vocal tract and 12–16 cm for a subglottal tract) and (2) the desire to communicate a verbal message with vowels and consonants along with the musical message.
Instead of formant-harmonic “tuning,” it is hypothesized that the singer learns to utilize supraglottal inertive reactance (and occasionally subglottal compliant reactance) to reinforce vocal fold vibration by choosing pitch-vowel combinations that keep several harmonics in favorable reactance regions simultaneously (Titze, 2008a), but not necessarily tuned to the formants. While ascending or descending in pitch, it appears that singers who want to maintain a stable harmonic spectrum learn to “lift” their harmonics over unfavorable reactance regions by adjusting formant frequencies. A weak voice and unstable nonlinear effects can thereby be avoided, such as excessive subharmonics or irregular vocal fold vibration. Although formant tuning to harmonics has been claimed in earlier work by Sundberg (1977) and later by Schutte and Miller (1993) and Neumann et al. (2005), their published data suggest that while harmonics are often near the center of the formant, they are not generally in the center. When formants are measured with an independent sound source during singing (Joliveau et al., 2004), the case for exact formant-harmonic tuning is also weak, even though harmonics and formants can move up and down together in close proximity.
The purpose of this paper is to contrast two vocal tract shapes in terms of source-filter interaction. These shapes resemble vowels modified for singing in the two contrasting styles mentioned. Specifically, the following questions are of interest: (1) Does the inverted megaphone mouth shape often used by singers of Western opera and art songs reinforce harmonics above the fundamental in favorable reactance regions above the first formant? (2) In contrast, does the megaphone mouth shape often used by belters reinforce both the fundamental and the second harmonic with favorable inertive supraglottal reactance below the first formant? Given the large number of possible pitch-vowel interactions and differences in male-female anatomy, the authors limit theirselves to a few male high-pitch productions. The female voice with the same stylistic differences will be discussed in a follow-up paper. In order to make this paper useful to a broad audience that includes singing pedagogues, some tutorial material on nonlinear source-filter interaction is included that leads to the case presentations.
PITCH-VOWEL INTERACTION
The degree of interaction between the source of sound (vocal fold vibration with its accompanying glottal flow) and the vocal tract filter depends on the relation between the source impedance and the vocal tract input impedance. As in electric circuit theory (Skilling, 1966), the source impedance is large compared to the vocal tract impedance, little interaction will occur. If the impedances are comparable, much interaction will occur. The underlying hypothesis is that reactive impedance, above and below the glottis, can store energy and feed it back to the source with delayed or advanced phase, thereby interfering (either constructively or destructively) with vocal fold vibration.
Interaction with wave-reflection algorithms
It has been customary to simulate vocal tract acoustics with a wave equation that is modified to include wall vibration, kinetic loss, viscous loss, and lip radiation (Lilljencrants, 1985; Story, 1995). The vocal tract is subdivided into many cylindrical sections, typically about 36 for the subglottal (tracheal) system and 44 for the supraglottal system for males. Reflection coefficients are computed at the boundaries of abutting sections and the loss terms are added as “corrections” to the basic scattering equations at the boundaries (Lilljencrants, 1985).
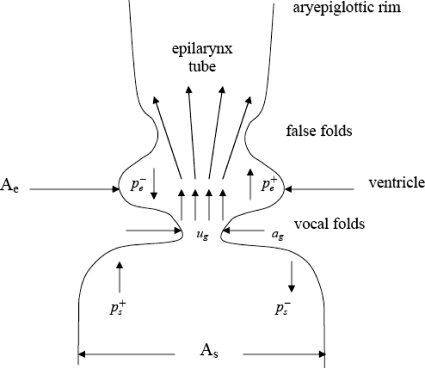
To account for source-tract interaction (Fig. 1), an analytical closed-form solution for glottal flow can be used (Titze, 1984), which has the following form:
| (1) |
Here ug is the interactive glottal flow, ag is the time-varying glottal area (computed where flow detachment occurs in the glottis and a jet is formed; see Fig. 1), c is the sound velocity, and kt is a transglottal pressure coefficient for modified Bernoulli flow through this glottis. Further, A* is an effective vocal tract area defined as
| (2) |
where As is the subglottal area and Ae is the epilaryngeal (supraglottal) area, which begins at the laryngeal ventricle (Fig. 1). Two reflection coefficients in Eq. 1 are defined as follows:
| (3) |
| (4) |
Finally, is the forward traveling acoustic wave pressure from the subglottis while is the backward traveling wave pressure from the supraglottis. (When added together, forward and backward traveling waves form the total acoustic pressure in any section of the vocal tract.)
Figure 1.
Diagram of vocal folds and lower vocal tract to illustrate source-filter interaction.
To complete the analytical calculation, the departing partial pressure waves from the subglottis and supraglottis, respectively, are
| (5) |
| (6) |
and the total subglottal and supraglottal acoustic pressures are
| (7) |
| (8) |
The only advancement in the above formulation over what was published previously (Titze, 1984; Titze et al., 2008) is the addition of the reflection coefficients rs and re, which were previously set to 1.0 but are now time-varying because of the time-varying glottal area ag. This refinement in the equations produces wave transmission losses through the glottis in both directions.
Special vocal tract shapes and their impedances
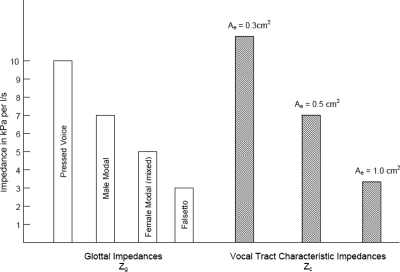
The acoustic input impedance of the vocal tract is frequency-dependent due to standing waves in the vocal tract (Fant, 1960; Flanagan, 1972), but the characteristic impedance is not frequency-dependent. Its value is ρc∕Ae, where ρ is the density of air, c is the sound velocity, and Ae is the entry area into the supraglottal vocal tract, known as the epilarynx tube area. [The epilarynx tube, which includes the laryngeal ventricle, the space between the ventricular (false folds), and the laryngeal vestibule, makes up the first 2–3 cm of the vocal tract above the vocal folds, terminated by the aryepiglottic rim, where the aryepiglottic folds are located.] If the vocal tract were infinitely long and of constant cross section Ae, no reflections would take place to create standing waves, and the input impedance would be the constant value ρc∕Ae, an acoustic resistance. An average value of Ae for speakers (Story, 2005) is about 0.5 cm2, which makes the characteristic impedance about 7.0 kPa per l∕s. This is in the middle of the range of glottal impedances gleaned from pressure-flow data in the literature (Holmberg et al., 1988; Dromey et al., 1992; Sundberg, 1995; Alipour et al., 1997; Stathopoulos and Sapienza, 1993, 1997; Sundberg et al., 2004). Figure 2 shows a bar graph of glottal resistances for pressed voice, male modal voice, female modal (mixed register) voice, and falsetto voice. The glottal resistances are shown with clear bars. Also shown are three solid bars for characteristic vocal tract impedances for Ae=0.3, 0.5, and 1.0 cm2. Note that there are many options for impedance matching and mismatching. For example, a 1.0 cm2 epilarynx tube matches well with falsetto voice, a 0.5 cm2 epilarynx tube matches well with male modal voice (and to a slightly lesser degree with mixed or female modal voice), and a 0.3 cm2 epilarynx tube matches well with pressed voice.
Figure 2.
Glottal impedances for different phonatory control (clear bars), and characteristic vocal tract input impedance Zc (cross hatched bars) for different cross sectional areas Ae of the epilarynx tube.
But the complete vocal tract is nonuniform in cross section and finite in length, which means that the characteristic tube impedance becomes only a scale factor for the frequency-dependent impedance (Fant, 1960; Flanagan, 1972; Stevens, 1999). Impedance values are complex, having both a real and an imaginary component, and can range from much smaller to much larger than the characteristic impedance at different frequencies.
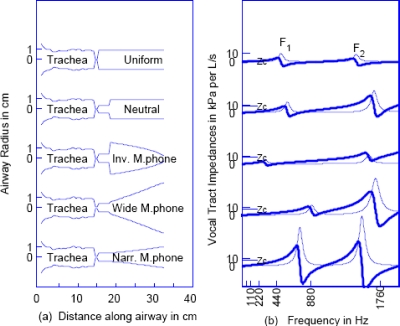
Figure 3 shows the vocal tract input impedance for a collection of artificial vocal tract shapes that the authors consider the beginning caricatures (not measured on humans) of some of the singing styles discussed later in this paper. The vocal tract shapes are shown in the left panel and the corresponding supraglottal impedances are shown on the right panel. Because acoustic impedance is a complex quantity, as mentioned, the right panel shows the resistive component (real part of the impedance) in thin lines and the reactance (imaginary part of the impedance) in thick lines. Characteristic impedances Zc are shown with short horizontal lines on the vertical axis (above or below the 10 kPa per l∕s tic mark). The complex impedances were computed with transmission line theory (cascade matrices for variable cross sections; Story et al., 2000) and include the radiation impedance, as well as viscous losses and wall vibration losses in all sections of the vocal tract (Sondhi and Schroeter, 1987; Story et al., 2000). For all cases except the uniform tube, the epilarynx tube was chosen to be 0.5 cm2. Note that impedance maxima can be as high as 50 kPa per l∕s for the narrow megaphone shape (at the bottom). For the inverted megaphone shape (middle), the impedance maxima are less than 20 kPa per l∕s, and for the uniform tube (top) they reach only about 10 kPa per l∕s. The characteristic tube impedance Zc is 7 kPa per l∕s for all shapes except the uniform tube, which does not have the narrowed epilarynx tube. Zc for the uniform tube is only 1.3 kPa per l∕s.
Figure 3.
(a) Vocal tract caricatures and (b) corresponding input impedances as a function of frequency; thick lines are reactances and thin lines are resistances.
The authors reason that, in terms of an average impedance level, the inverted megaphone and neutral shapes may match well with moderate glottal adduction, whereas a narrow megaphone shape may match well with a pressed glottal adduction, as in a shout or a belt. The uniform tube, which has an extremely low input impedance, is an unlikely configuration for a human vocal tract because it is difficult for anyone to widen their epilarynx tube to the same diameter as the pharynx. It would produce an impedance mismatch with anything but a very wide glottis, as perhaps in very breathy voice. Nevertheless, the uniform tube is shown as a reference configuration because it is so widely discussed in speech science. In fact, it becomes the asymptote for linear source-filter coupling, for which the vocal tract input impedance must by definition be much lower than the glottal impedance (Titze, 2008a).
Whereas vocal tract resistance is always positive, reactance can be both positive and negative, as Fig. 3 shows. Two formant (resonant) frequencies, F1 and F2, are identified on the top impedance curve. Frequency ranges linearly from 0 to 2000 Hz and standard frequencies for musical pitches A2–A6 are labeled at the bottom. The musical pitches are spaced logarithmically on the linear frequency scale. Formant frequencies are located where the resistance has a local peak. For the 17.5 cm long uniform tract, these formants are located at 500 and 1500 Hz. Positive (inertive) and negative (compliant) supraglottal reactances alternate to the left and right of the formants, respectively. Positive supraglottal reactance has been shown to assist in self-sustained vocal fold oscillation, whereas negative supraglottal reactance hinders self-sustained oscillation (Titze, 1988a; Fletcher, 1993; Titze, 2008a). In the subglottal system, the effect is reversed. Negative (compliant) subglottal reactance helps vocal fold vibration whereas positive (inertive) subglottal reactance hinders vocal fold vibration. A computer simulation of this interaction will now be given.
Effect of vocal tract shape on vocal fold vibration
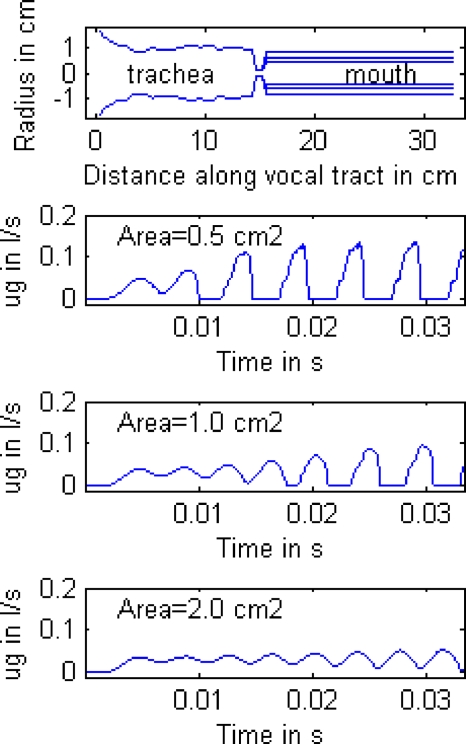
Given the many possible impedance curves with different vocal tract shapes, only a few special shapes can be chosen here to demonstrate source-tract interaction. Figure 4 shows simulations of glottal airflow with a well-described body-cover model of the vocal folds that self-sustains oscillation when a vocal tract is attached (Story and Titze, 1995; Titze and Story, 2002). The interaction is calculated with Eq. 1, in combination with a wave-reflection simulation of vocal tract acoustic pressures (Lilljencrants, 1985; Story, 1995). The top of Fig. 4 shows three uniform supraglottal tubes with different cross sectional areas (0.5, 1.0, and 2.0 cm2). All else in the model was kept identical; hence, the details of all other parameters will not be repeated here. The fundamental frequency was about 200 Hz, but varied slightly with vocal tract load. Note that the widest tube (2.0 cm2) resulted in oscillation barely above threshold (bottom curve). As the tube narrowed, the onset of vibration was quicker, pulse height was greater, and the flow declination prior to closure was more abrupt.
Figure 4.
Computer simulation of glottal airflow with a self-sustained oscillation vocal fold model that interacts with three uniform tubes as shown in the top graph.
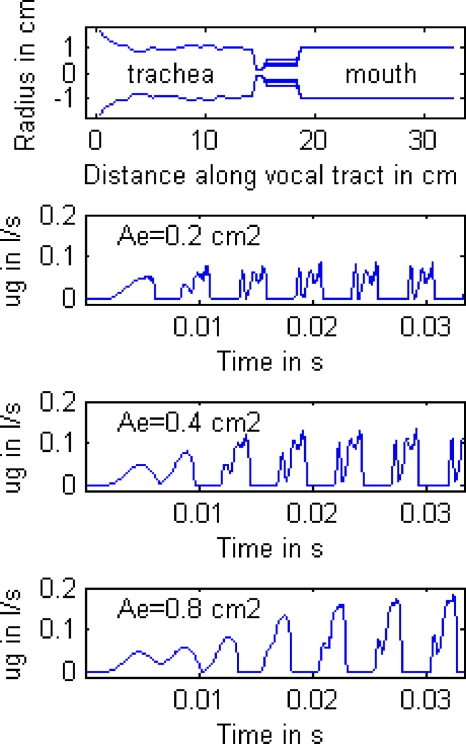
Figure 5 shows similar curves, but in this case the cross sectional area of the epilarynx tube was varied. There was more formant ripple on the glottal flow waveform. The flow amplitude decreased with a narrower epilarynx tube, but the maximum flow declination prior to glottal closure still increased. Oscillation onset was again fastest with the narrowest tube.
Figure 5.
Computer simulations of glottal airflow (bottom three panels) with a self-sustained oscillation vocal fold model that interacts with a neutral tube and three epilarynx areas Ae.
These two examples point out that vocal tract configuration can have a profound effect on the source. Singers may widen or narrow their vocal tracts for different styles, even in the presence of specific vowels. The authors suspect that they also learn to control the cross sectional area of the epilarynx tube, although the musculature used for this control is not clearly understood. Favorable or unfavorable source-filter interaction is likely to dictate which vocal tract shape works with which singing style.
An inertogram for frequency-dependent interaction
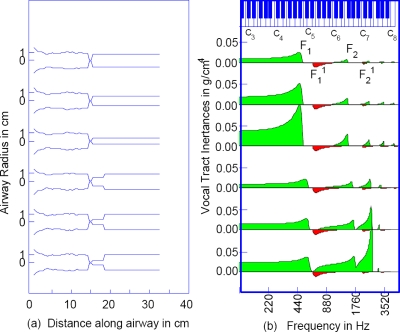
To view the F0-vowel interaction over large frequency ranges, it is useful to plot supraglottal vocal tract inertance (inertive reactance divided by the angular frequency ω=2πF). Inertance is a more evenly scaled quantity over a wide frequency range. Also, a logarithmic frequency scale is more suitable for matching frequency to keyboard pitches. Figure 6 shows a set of inertograms (supraglottal inertance versus frequency) for the six simple configurations chosen in the simulations of Figs. 45. The vocal tract shapes (three uniform tubes and three neutral tubes with different epilarynx diameters) are shown on the left, and inertance is shown in solid horizontal bars on the right. Negative supraglottal inertance (which would be compliance) is set to zero (producing only a baseline). Thus, whenever the supraglottal reactance as calculated in Fig. 3 goes negative, the inertance merges into a single line, its value being set to zero to simplify the graphs.
Figure 6.
Six tube shapes (left) and their corresponding inertograms (right).
Below the baselines one observes some small “tear-drops” that represent subglottal compliance, which for the constant tracheal configurations shown in Fig. 6 exists in the 600–800 Hz region, and to a much lesser extent in the 2000–2500 Hz region. This subglottal compliance may also be useful for the singer to reinforce a harmonic, but further discussion is beyond the scope of this paper.
The mks units of inertance are kg∕m4, but the authors prefer to plot inertance in g∕cm4, which agrees more with the dimensions of the system (1.0 g∕cm4=105 kg∕m4). Inertance can be thought of as density of an air column per unit length. Oscillation threshold pressures (Titze, 1988a; Chan and Titze, 2006; Jiang and Tao, 2007) and glottal flow pulse skewing (Rothenberg, 1981; Titze, 2006) have previously been quantified in terms of vocal tract inertance. The vertical tic marks in Fig. 6 (right panel) indicate that the low-frequency inertances range between 0.01 and 0.04 g∕cm4 for the collection of tubes. Conceptually, this means that the vocal tract air columns, with an air density of about 0.001 g∕cm3, have effective acoustic lengths of 10–40 cm, even though the actual vocal tract length is a constant value of 17.5 cm. The narrowed epilarynx tube increases the acoustic length. At selected frequencies, peak inertance can reach above 0.1 g∕cm4, as shown in the inertograms.
The supraglottal formants (resonances of the vocal tract) are identified as the locations where the inertance bars suddenly collapse to the baseline. Similarly, subglottal formants are at the beginning of the sudden downward trend of the tear-drops (see labels on top of inertogram). The first subglottal formant occurs at about 600 Hz (near E5) and the second subglottal formant occurs at about 1900 Hz (barely visible). Five supraglottal formants can be identified for the uniform tubes and four for the neutral tubes with a narrowed epilarynx tube. Note that changing the diameter of the uniform tube does not change the locations of the formants, but narrowing the epilarynx tube does. F1 and F2 are raised slightly, F3 stays about the same, and F4 is lowered slightly with epilarynx narrowing. The slight clustering together of F3 and F4 is known as singer’s formant clustering (Sundberg, 1974; Titze and Story, 1997). The clustering may also include F5, which is not seen here on the lower three inertograms.
The most important contrast between changing the entire tube diameter and changing only the epilarynx diameter is reflected at frequencies between 2000 and 3000 Hz. Note that inertance decreases monotonically with higher formants for the uniform shapes, but increases dramatically in the F2 to F3 region for the neutral tubes with a narrow epilarynx tube. This means that harmonics in the 2000–3000 Hz range can be strengthened with a narrowed epilarynx tube. The increased formant ripple in the previously discussed simulations of Fig. 5 (bottom to second from top) is evidence of this effect.
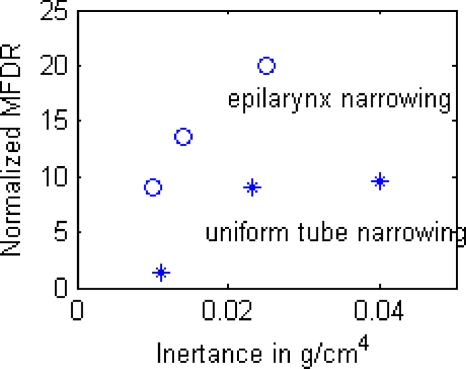
One way to quantify the acoustic benefit of source-tract interaction is to compute the maximum flow declination rate (MFDR) and compare it to the value it would have if the flow were sinusoidal. MFDR is known to correlate well with vocal intensity (Holmberg et al., 1988; Gauffin and Sundberg, 1989). The authors define the normalized MFDR as
| (9) |
where is the MFDR (the maximum negative derivative of the flow), ω is the angular frequency (2πF0), and Um is the peak glottal flow. For a sinusoid, this ratio is 1.0. Figure 7 shows a diagram of this ratio computed from the waveforms of Figs. 45. It is seen that epilarynx narrowing is generally more effective than overall tube narrowing in increasing MFDRn. The lowest value of MFDRn is obtained for the 3.0 cm2 uniform tube. Recall that the waveform for this case is nearly sinusoidal (Fig. 4, bottom), so a value near 1.0 for MFDRn is expected. A value of 20 is obtained for the tube with the narrowest epilarynx (0.2 cm2). The corresponding waveform was the least sinusoidal (Fig. 5, second from top). This confirms the earlier claim that nonlinear source-filter coupling increases the source strength, measured by MFDR, not simply the energy transfer through the vocal tract at selected frequencies.
Figure 7.
Normalized maximum flow declination rate (MFDRn) for the six simulations of Figs. 45.
Note that for all the shapes shown in the inertogram of Fig. 6, there is a “dead” spot just above F1. This occurs around 500–600 Hz. Singers experience difficulties when either F0 or 2F0 is in this region. The authors will now show how singers may manage the avoidance of this dead spot.
VOCAL TRACT SHAPES DERIVED FROM MALE SINGERS
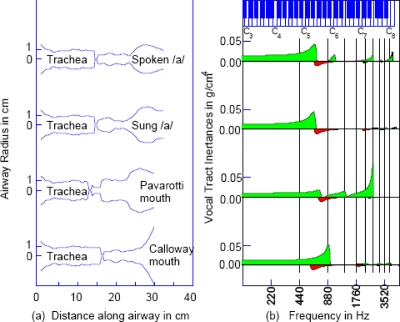
Magnetic resonance images (MRIs) of vocal tract shapes of a lyric baritone were obtained from Dr. Brad Story at the University of Arizona. The procedure followed work reported earlier (Story et al., 1996). The singer produced several vowels and consonants in both a speaking mode and a singing mode. Figure 8 (top two rows on the left) shows the measured vocal tract area functions for the spoken ∕ɑ∕ vowel and the sung ∕ɑ∕ vowel for this baritone. The corresponding inertograms are to the right. Vertical lines are harmonics of the A4 pitch, to be discussed later. The two shapes in the lower half of Fig. 8 will also be explained later.
Figure 8.
(Left) Vocal tract shapes derived from MRI data of a lyric baritone singer with various shape modifications, and (b) corresponding inertograms.
The lyric baritone was neither a belter nor an operatic singer. His professional singing styles were lieder, early music, and chanting. The main differences between his speaking and singing vocal tract were a wider mouth opening and a wider throat opening for the sung ∕ɑ∕. He did not produce much vocal ring, which is evidenced by the fact the he maintained a relatively wide epilarynx tube (0.8–1.0 cm2), even more so in singing than in speaking. So, one certainly needs to question whether his vocal tract shape is representative of an operatic singer.
A side-note about access to human subjects for singing research is in order. To the authors’ knowledge, premier opera singers and musical theater belters have not made themselves available for detailed three-dimensional (3D) MRI studies, which requires several hours of phonation in a supine position. The best singers have too busy a schedule in their prime years, and their agents prefer not to see them engaged in such intensive research activities. While amateur or low-rank professionals are available, their techniques are sometimes less convincing. Hence, the authors opted to combine some data from their semi-professional baritone with mouth shapes from star-quality professionals. Mouth shapes are relatively easy to obtain from artists on public access video and audio recordings. While two-dimensional (2D) imaging could have been used with professional singers, the vocal tract area functions derived from 2D images require assumptions about cross-dimensions that are no easier to justify than “morphing” mouth shapes to known 3D images.
Several video recordings were chosen to provide examples for analysis. For male operatic singing, the tenor Luciano Pavarotti singing the aria “Vesti La Giubba” from Leoncavallo’s opera I Pagliacci was analyzed. The video, a 1994 performance at the Metropolitan Opera, is freely available on YouTube as a high quality MP4 recording (Pavarotti, 1994). Because it was a live performance, the audio and video are synchronized; there is only one signal source. There is a negligible amount of background noise in the recording and, although the performance is accompanied by full orchestra, there is a brief unaccompanied segment of Pavarotti singing an A4 at 0:43 s into the recording. As a second example of operatic production, Roberto Alagna singing and A4 in the aria “E lucevan le stele” from Puccini’s opera Tosca was analyzed. The video, freely available on YouTube (Alagna, 2000), is from a filmed performance in the year 2000.
For one example of male belt production, simultaneous audio and video recordings of the jazz singer Cab Calloway singing “St. James Infirmary” were analyzed. This video, recorded live in 1964 on the Ed Sullivan Show, is also freely available on YouTube (Calloway, 1964). Here, Cab Calloway sings an unaccompanied A4 during a scalar run near the end of the song, 2:10 to 2:20 min into the recording. The A4 segment analyzed for this paper occurs at 2:13 of the performance. For the second example, the musical theater singer Tony Vincent is shown in a live performance in Beijing singing “Love changes everything” from Andrew Lloyd Webber’s musical “Aspects of Love.” The performance is from the 2008 Summer Olympics and is freely available on YouTube (Vincent, 2008).
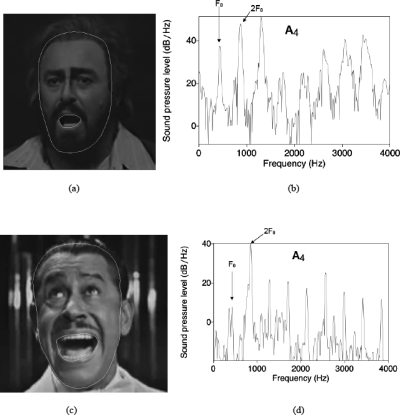
Figure 9a shows a video frame of Pavarotti singing an ∕ɔ∕ vowel on the pitch A4 from the phrase “sei tu forse un uom?” four bars before the beginning of “Vesti La Giubba.” The vowel is from the word uom, briefly sung while unaccompanied by the orchestra, from which the A4 is taken. The head shape and the mouth shape are highlighted with white lines. The images were processed using a MATLAB script that found the ratio of mouth area to frontally-projected head area by defining two polygons. From these, the absolute area of the mouth was estimated from mean head size measurements of ordinary individuals. Results are shown in Table 1 for this note and several other notes in the aria. For the A4 shown in the figure, the mouth∕head area ratio is 0.0291 or about 3%.
Figure 9.
(a) Mouth area and head area for Luciano Pavarotti singing A4 on an ∕ɔ∕ vowel. (b) Corresponding frequency spectrum. (c) Mouth area and head area for Cab Calloway singing A4 on an ∕a∕ vowel, and (d) corresponding frequency spectrum.
Table 1.
Mouth-to-head area ratios.
| Note | Ratio | Vowel |
|---|---|---|
| Male operatic (Luciano Pavarotti) | ||
| D#4 | 0.0137 | ∕e∕ |
| E4 | 0.0205 | ∕ɑ∕ |
| F#4 | 0.0288 | ∕ʊ∕ |
| G4 | 0.0290 | ∕ɑ∕ |
| A4 | 0.0291 | ∕ɔ∕ |
| Male belt (Cab Calloway) | ||
| 0.0170 | ∕u∕ | |
| E4 | 0.0364 | ∕o∕ |
| 0.0614 | ∕a∕-∕o∕ (diphthong) | |
| G4 | 0.0662 | ∕a∕ |
| A4 | 0.0840 | ∕a∕ |
Estimating a 350 cm2 head area for a slightly larger than normal male, the absolute mouth area for A4 is about 10 cm2. (Precision in this estimate is not important because the differences between the examples described here are very large).
The authors know little about the rest of the vocal tract of Pavarotti, other than he was a large man with a wide neck. Assuming his supraglottal vocal tract length to be about the same as that of the baritone (Pavarotti was a tenor, but larger than most), assuming a wider pharynx (about 4 cm2) and assuming a 0.3 cm2 narrowed epilarynx tube (because of a strong ring in his voice), the approximate 10 cm2 mouth area can be extrapolated backward from the general MRI shape of the lyric baritone. For results the authors return to Fig. 8, third row. This is obviously at best an intelligent guess, but it serves to produce one caricature of a classical male operatic singing shape, the inverted megaphone mouth shape. As an additional vocal tract modification for operatic singing, a slight larynx lowering (often taught in vocal studios) was included by shortening the trachea by 1.5 cm.
For the jazz singer Calloway, Fig. 9c shows the mouth shape on the same pitch and vowel. The mouth∕head area ratio is 0.084 (see also Table 1), nearly three times larger than that for Pavarotti. With a 30 cm2 mouth opening, a backward extrapolation from this mouth shape to a speech-like pharynx and epilarynx tube is shown in Fig. 8, bottom row. A slight larynx raising is part of a belt production, which was simulated by lengthening the trachea by 1.2 cm and shortening the supraglottal tract proportionately. The supraglottal tract was shortened because mouth-corner retraction is also part of belting.
Consider now the inertograms of Fig. 8 (right panel). Vertical lines are drawn for the pitch A4 (440 Hz) and eight higher harmonics. Note that F0 is safely in the inertance region below F1 for all four configurations. However, the second harmonic (880 Hz) is above F1 for all but the megaphone (Calloway) mouth shape. For the inverted megaphone mouth shape (the shape extrapolated from Pavarotti’s mouth), 2F0 is in both the subglottal compliance region and the supraglottal inertance region (below F2). Because the trachea is slightly shorter than for the speech vowel, the first subglottal resonance overlaps with the second supraglottal resonance (F2) to offer combined reinforcement to 2F0. The third harmonic (3F0) benefits from being near the highest inertance point on the upskirt of F2. In addition, the overall inertance in the 2500 Hz region is increased (relative to the original baritone inertograms) because of epilarynx narrowing. The sixth harmonic would be predicted to be strong.
For the Calloway mouth shape, 2F0 should receive an exceptionally large boost from the supraglottal inertance just below F1. The third harmonic is not expected to be strong with the megaphone mouth shape at this pitch.
The measured spectra from the two singers [Figs. 9b, 9d] confirm some of the predictions of the inertograms. All audio samples were in the AAC format, a high quality audio encoding scheme with a sampling rate of 44.1 kHz. These were analyzed with PRAAT (Boersma and Weenick, 2009) using a narrow band fast Fourier transform (FFT) with Gaussian windowing. The window length was set to 0.06 s, resulting in a 21.64 Hz bandwidth (narrow band) analysis. The dB threshold was set to 60 dB. Objections may be raised about performing spectral analyses on highly compressed and processed YouTube recordings. While these objections are generally valid, they do not affect the general conclusions reached here. The authors have uploaded male high-pitched singing sounds to YouTube and analyzed their spectral content pre- and postuploading, and then again after downloading. The major harmonic amplitudes differed only by 1–2 dB. Also, independently-extracted spectra from non-compressed original recordings by Schutte et al. (2005) confirm the spectra for one of the artists, Pavarotti.
The magnitude spectrum for Pavarotti in Fig. 9b shows that F0, 2F0, and 3F0 are all strong, particularly 2F0 and 3F0. Is this spectrum predicted by the inertograms of Fig. 8 (second from bottom)? As discussed above, the lower three harmonics are predicted to be reinforced by favorable supraglottal inertance (and subglottal compliance in the case of 2F0). But harmonics 6F0, 7F0, and 8F0 are also collectively strong in the recording. From Fig. 8, only 6F0 is predicted to be strong. Since the authors do not know the precise epilaryngeal dimensions of Pavarotti (length and diameter), it is possible that 7F0 and 8F0 may also be reinforced by the narrowed epilarynx tube and the clustering of F3, and F4 that produces the operatic ring (Bartholomew, 1934), but further exploration would be needed.
The spectrum of Calloway [Fig. 9d] shows an exceptionally strong second harmonic 2F0. It rises 30 dB above the energy of F0 and 20 dB above the energy of 3F0. (For Pavarotti, the energies in 2F0 and 3F0 were about 10 dB above the energy in F0.) Figure 8 (bottom right) predicts this strong second harmonic on the basis of a high larynx and a megaphone mouth shape.
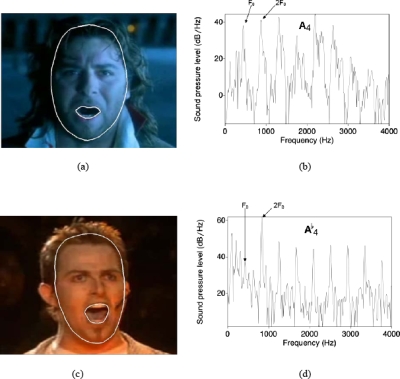
Figure 10 shows two more examples of males singing high pitches, opera singer Roberto Alagna, and musical theater singer Tony Vincent. Mouth-to-head area ratios were 0.0563 and 0.0289, respectively, an approximate 2:1 difference. The spectrum for Vincent is again characteristic of a strong second harmonic, little fundamental (basically in the noise), and only a moderate amount of energy in the singer’s formant cluster (harmonics 6–8). In contrast, Alagna has more balanced energy in the lower harmonics and a strong singer’s formant cluster to boost 5F0 and 6F0. Some difference in the harmonic energy distribution is not surprising on the basis of the inertogram of Fig. 8 because the inertance regions are broad and precise tuning of harmonics to formants is not necessary.
Figure 10.
(a) Mouth area and head area for Roberto Alagna singing A4 on an ∕ɔ∕ vowel. (b) Corresponding frequency spectrum. (c) Mouth area and head area for Tony Vincent singing A-flat4 on an ∕a∕ vowel, and (d) corresponding frequency spectrum.
HARMONIC LIFTING OVER FORMANTS
The authors return to some pedagogical issues. It is hypothesized that dealing with harmonic-formant interaction is an essential component of vocal technique. In classical voice pedagogy, the “lifting” of a harmonic over the formant when pitch is changed is part of managing the passaggi in the voice, “covering” the high notes, or “vowel modification” (Miller, 1986). Vocal instabilities (pitch jumps, subharmonics, or occasionally aperiodic vibration) can occur when a harmonic passes through a formant on a pitch change (Titze et al., 2008). As was seen in the data, the inertance changes quickly near the formants. If vocal fold vibration is highly facilitated by supraglottal inertance, a sudden change can destabilize the modes of vibration. Thus, a vocalist who relies on source-vocal tract interaction to boost the power of his voice must learn to modify the vowel to seek out as much reinforcement as possible for each harmonic.
For the cases studied here, the narrowed epilarynx tube for the operatic shape in Fig. 8 (second from bottom) has the effect of increasing supraglottal inertance over the entire frequency range. This gives the singer the opportunity to reinforce many harmonics on overlapping skirts between the formants. There are no wide “dead spots,” only a few small dips above the formants (recall Fig. 8, third inertogram versus the top inertogram). There is an expected asymmetry between the strength of a harmonic directly below a formant and one directly above a formant. Examination of 47 spectra of singers displayed in Miller (2008) reveals that 37 spectra show this asymmetry and only 10 show approximate symmetry. This is a strong verification of the nonlinear source-filter theory. In linear source-filter coupling, symmetry in harmonic energy around the formants is predicted because vocal tract reactance does not affect the source and the vocal tract transfer function is symmetric around the formant. Thus, whether reactance is positive or negative should have no effect on the strength of the harmonic. (A small asymmetry does exist because of the gradual spectral decay at the source, but that was taken into account when adding up the profound asymmetries in the above-mentioned 47 spectrograms.)
For jazz and theater belt productions, the second harmonic, which is characteristic of the male quality (and female belt quality) according to Schutte and Miller (1993) and Neumann et al. (2005), needs to be carefully managed by male singers in their high-pitch ranges. The vibration regime of the vocal folds could easily be destabilized by a sharp change in 2F0 reinforcement. The register could easily flip from modal to falsetto without second harmonic reinforcement (Titze, 2008a). Classically-trained singers prevent this possible destabilization by covering or modifying any vowels that would have a wide-open mouth shape (Appelman, 1967). Centralized vowels such as ∕ɔ∕, ∕ʊ∕, ∕ɛ∕, or ∕I∕ keep 2F0 in positive inertance territory below F2. An exercise used by Enrico Caruso, a famous tenor of the first half of the 20th century, is based on a gradual change from the ∕ɑ∕ vowel to the ∕ɔ∕ vowel for high notes (Coffin, 1987). Some vocal pedagogues have gone on record to describe “highly favored” vowels for classically-trained baritones and tenors as they transit into their highest pitches (Coffin, 1987).
Male belters, on the other hand, purposely do not modify toward these centralized vowels. With higher F0, they open the mouth ever further than for the speech ∕ɑ∕, all the while raising the larynx. The combined action raises F1 (Bjorkner, 2008), thereby keeping 2F0 below F1. There is an upper limit to this strategy, however. Belters generally break into falsetto register when F1 can no longer be raised in modal register, which by nature of its characteristic airflow requires a strong second harmonic (Sundberg et al., 1993). If the 2F0 interaction with F1 has not been smoothed out with much practice, a noticeable timbre change will occur.
By lowering the larynx, the tracheal compliance region can be raised in frequency to maintain a chest voice all the way to C5 (the trachea will be shortened). In Fig. 8, if the subglottal compliance tear-drop were to shift upward by about 200 Hz, 2F0 would benefit from tracheal reinforcement. Some very robust tenors sing their top notes with a lowered larynx and may make use of subglottal (chest) reinforcement. However, the detailed acoustic analysis of tracheal resonance in singing is left for a future study.
A HISTORICAL NOTE
In the year 1831, a revolution took place in the male singing voice in Italy. The French tenor Gilbert Duprez (1806–1896) presented a C5 in “chest” voice in Rossini’s opera William Tell. It was referred to as Do di petto, C in chest. Repeat performances in his own country with this production brought about much critique in the media, and legend has it that it ultimately led to the suicide of one of his rival tenors, Adolphe Nouritt, who could never produce this “chest” sound (Walker and Hibbard, 1992). Prior to this, male high voice was likely to be produced in a much lighter register, resembling more of what today would call a leggiero sound or even a tenorino production. Rossini did not care for Duprez’s sound, having himself led vocal pedagogy through the bel canto era. He referred to it as “the death throes of a chicken (Holland, 1999).” Other critics thought the sound was new and exciting, more capable of expressing extreme vocal drama. In 1840, the production became fashionable and was adapted by Verdi and other opera composers as the sound of a heroic male character. But the productions have now been highly groomed, and the authors do not know what the original sound was.
Featuring the belt quality described here over long and repeated notes may also be treacherous. Prolonged mouth and jaw stretching, along with muscular stretching in the vocal folds to maintain an extremely high pitch, can easily fatigue the voice. Duprez had a short career, retiring at age 49 to become a teacher for the remaining 41 years of his life. The authors do not know if his high C’s were belt-like (with a high larynx and a wide-open mouth) or in the operatic style described here (with a slightly lowered larynx, moderate mouth opening, and tracheal resonance). In Duprez’s day, the term belt had not been invented. In the last century and a half, the male singing voice has been cultivated to the point that any blend between falsetto (the boy voice that does not exhibit a strong second harmonic) and the male belt (which produces the strongest second harmonic) can be obtained with clever vowel modification and registration at the source. By lowering or raising the larynx, and by using either the megaphone or inverted megaphone shape, tenors and high baritones can have more freedom to explore a variety of sound spectra, producing both warmth and brilliance.
CONCLUSIONS
The linear source-filter theory, successfully applied to male speech, is likely to be applicable to male singing when pitches are low enough that significant harmonic-formant interaction does not occur. However, for a male singer with at least a two octave range, pitches in the higher octave, beginning around C4, may require special vocal tract shapes to enhance self-sustained vocal fold oscillation. Highly gifted singers, with a vocal fold layered structure that easily sustains vocal fold oscillation (Hirano, 1975), may not rely heavily on source-tract interaction. Any vowel shape is possible, but most singers choose caricatures of certain vowels to reinforce a collection of harmonics. This is no need for exact “tuning” of formants to harmonics, as in many man-made musical instruments, but rather a need to find regions between the formants where supraglottal inertive reactance and subglottal compliant reactance can be exploited. Some vowel articulation is then still possible, but around a specific vocal tract caricature. In jazz or theater belt, the vowels ∕æ∕ and ∕a∕ provide the highest F1 so that both F0 and 2F0 can always be kept below F1. In opera or art song, centralized vowels such as ∕ʊ∕ are often used to lower F1 so that 2F0 (and ultimately F0 itself) can be lifted over F1 with a pitch change. In a paper to follow, a similar analysis will be given for female singers across different styles.
ACKNOWLEDGMENTS
This work was supported by the National Institutes of Health Grant No. 5R01 DC004224-08 from the National Institute on Deafness and Other Communication Disorders. Special thanks are given to Dr. Brad Story who provided the vocal tract shapes of the baritone singer.
References
- Adachi, S., and Sato, M. (1996). “Trumpet sound simulation using a two-dimensional lip vibration model,” J. Acoust. Soc. Am. 99, 1200–1209. 10.1121/1.414601 [DOI] [Google Scholar]
- Alagna, R. (2000). “E lucevan le stele” from Puccini’s opera Tosca was analyzed. The video is from a filmed performance in 2000, freely available on YouTube retrieved from http://www.youtube.com/watch?v=f6urNGBR95w (Last viewed 2∕4∕2009).
- Alipour, F., Scherer, R. C., and Finnegan, E. (1997). “Pressure-flow relationships during phonation as a function of adduction,” J. Voice 11, 187–194. 10.1016/S0892-1997(97)80077-X [DOI] [PubMed] [Google Scholar]
- Appelman, D. R. (1967). The Science of Vocal Pedagogy: Theory and Application (Indiana University Press, Bloomington, IN: ). [Google Scholar]
- Ayers, D. (1998). “Observation of the brass player’s lips in motion,” J. Acoust. Soc. Am. 103, 2873–2874. 10.1121/1.421530 [DOI] [Google Scholar]
- Bartholomew, W. (1934). “A physical definition of good voice quality in the male voice,” J. Acoust. Soc. Am. 6, 25–33. 10.1121/1.1915685 [DOI] [Google Scholar]
- Bergan, C., Titze, I. R., and Story, B. (2004). “The perception of two vocal qualities in a synthesized vocal utterance: Ring and pressed voice,” J. Voice 18, 305–317. 10.1016/j.jvoice.2003.09.004 [DOI] [PubMed] [Google Scholar]
- Bjorkner, E. (2008). “Musical theatre and opera singing—Why so different? A study of subglottal pressure, voice source, and formant frequency characteristics,” J. Voice 22, 533–540. 10.1016/j.jvoice.2006.12.007 [DOI] [PubMed] [Google Scholar]
- Boersma, P., and Weenick, D. (2009). “Doing phonetics by computer,” retrieved from www.praat.org (Last viewed 2∕4∕2009).
- Calloway, C. (1964). “St. James Infirmary” video, recorded live in 1964 on the Ed Sullivan Show, freely available on YouTube retrieved from http://www.youtube.com/watch?v=DAmxXrjVVsM (Last viewed 2∕4∕2009).
- Chan, R., and Titze, I. R. (2006). “Dependence of phonation threshold pressure on vocal tract acoustics and vocal fold tissue mechanics,” J. Acoust. Soc. Am. 119, 2351–2362. 10.1121/1.2173516 [DOI] [PubMed] [Google Scholar]
- Coffin, B. (1987). Coffin’s Sounds of Singing: Principles and Applications of Vocal Techniques With Chromatic Vowel Chart, 2nd ed. (The Scarecrow, Metuchen, NJ: ). [Google Scholar]
- Dromey, C., Sathopoulos, E. T., and Sapienza, C. M. (1992). “Glottal airflow and electroglottographic measures of vocal function at multiple intensities,” J. Voice 6, 44–54. 10.1016/S0892-1997(05)80008-6 [DOI] [Google Scholar]
- Estill, J. (1988). “Belting and classic voice quality: Some physiological differences,” Med. Probl. Perform. Art. 3, 37. [Google Scholar]
- Fant, G. (1960). The Acoustic Theory of Speech Production (Moulton, The Hague: ). [Google Scholar]
- Fant, G. (1986). “Glottal flow: Models and interaction,” J. Phonetics 14, 393–399. [Google Scholar]
- Fant, G., and Lin, Q. (1987). “Glottal voice source-vocal tract acoustic interaction,” J. Acoust. Soc. Am. 81, S68. 10.1121/1.2024357 [DOI] [Google Scholar]
- Flanagan, J. L. (1968). “Source-system interaction in the vocal tract,” Ann. N.Y. Acad. Sci. 155, 9–17. 10.1111/j.1749-6632.1968.tb56744.x [DOI] [Google Scholar]
- Flanagan, J. L. (1972). Speech Analysis, Synthesis, and Perception (Springer-Verlag, New York: ). [Google Scholar]
- Fletcher, N., and Rossing, T. D. (1998). The Physics of Musical Instruments (Springer, New York: ). [Google Scholar]
- Fletcher, N. H. (1993). “Autonomous vibration of simple pressure-controlled valves in gas flows,” J. Acoust. Soc. Am. 93, 2172–2180. 10.1121/1.406857 [DOI] [Google Scholar]
- Gauffin, J., and Sundberg, J. (1989). “Spectral correlates of glottal voice source waveform characteristics,” J. Speech Hear. Res. 32, 556–565. [DOI] [PubMed] [Google Scholar]
- Henrich, N. (2006). “Mirroring the voice,” Logoped. Phoniatr. Vocol. 31, 3–14. 10.1080/14015430500344844 [DOI] [PubMed] [Google Scholar]
- Hirano, M. (1975). “Phonosurgery: Basic and clinical investigations,” Otologia (Fukuoka) 21, 239–440. [Google Scholar]
- Holland, B. (1999). Critics Notebook; New York Times Online; http://query.nytimes.com/gst/fullpage.html?res=9903EFDB1430F930A25753C1A96F958260 (Last viewed 2∕4∕2009).
- Hollien, H. (1974). “On vocal registers,” J. Phonetics 2, 125–143. [Google Scholar]
- Hollien, H. (1983). “A review of vocal registers,” in Transactions of the Twelfth Symposium on Care of the Professional Voice, edited by Lawrence V. (Voice Foundation, New York, NY: ), pp. 1–6. [Google Scholar]
- Holmberg, E. B., Hillman, R. E., and Perkell, J. S. (1988). “Glottal airflow and transglottal air pressure measurements for male and female speakers in soft, normal, and loud voice,” J. Acoust. Soc. Am. 84, 511–529. 10.1121/1.396829 [DOI] [PubMed] [Google Scholar]
- Jiang, J., and Tao, C. (2007). “The minimum glottal airflow to initiate vocal fold oscillation,” J. Acoust. Soc. Am. 121, 2873–2881. 10.1121/1.2710961 [DOI] [PubMed] [Google Scholar]
- Joliveau, E., Smith, J., and Wolfe, J. (2004). “Vocal tract resonances in singing: The soprano voice,” J. Acoust. Soc. Am. 116, 2434–2439. 10.1121/1.1791717 [DOI] [PubMed] [Google Scholar]
- Lilljencrants, J. (1985). “Speech synthesis with a reflection-type analog,” Doctoral thesis, Royal Institute of Technology, Stockholm, Sweden. [Google Scholar]
- Miller, D. G. (2008). Resonance in Singing: Voice Building Through Acoustic Feedback (Inside View, Princeton, NJ: ). [Google Scholar]
- Miller, D. G., and Schutte, H. K. (2005). “Mixing the registers: Glottal source or vocal tract?,” Folia Phoniatr Logop 57, 278–291. 10.1159/000087081 [DOI] [PubMed] [Google Scholar]
- Miller, R. (1986). The Structure of Singing: System and Art in Vocal Technique (Schirmer Books, New York: ). [Google Scholar]
- Neumann, K., Schunda, P., Hoth, S., and Euler, H. A. (2005). “The interplay between glottis and vocal tract during the male passaggio,” Folia Phoniatr Logop 57, 308–327. 10.1159/000087084 [DOI] [PubMed] [Google Scholar]
- Pavarotti, L. (1994). Singing the aria “Vesti La Giubba” from Leoncavallo’s opera I Pagliacci. Video from a 1994 performance at the Metropolitan Opera, freely available on YouTube retrieved from (http://www.youtube.com/watch?v=Ky271W94VHA) (Last viewed 2∕4∕2009).
- Rothenberg, M. (1981). “Acoustic interaction between the glottal source and the vocal tract,” in Vocal Fold Physiology, edited by Stevens K. N. and Hirano M. (University of Tokyo Press, Tokyo: ), pp. 305–328. [Google Scholar]
- Schutte, H. K., and Miller, D. G. (1993). “Belting and pop, nonclassical approaches to the female middle voice: Some preliminary considerations,” J. Voice 7, 142–150. 10.1016/S0892-1997(05)80344-3 [DOI] [PubMed] [Google Scholar]
- Schutte, H. K., Miller, D. G., and Duijnstee, M. (2005). “Resonance strategies revealed in recorded tenor high notes,” Folia Phoniatr Logop 57, 292–307. 10.1159/000087082 [DOI] [PubMed] [Google Scholar]
- Skilling, H. H. (1966). Electrical Engineering Circuits, 2nd ed. (Wiley, New York: ). [Google Scholar]
- Sondhi, M. M., and Schroeter, J. (1987). “A hybrid time-frequency domain articulatory speech synthesizer,” IEEE Trans. Acoust. Speech Signal Process. 35, 955–967. 10.1109/TASSP.1987.1165240 [DOI] [Google Scholar]
- Stathopoulos, E., and Sapienza, C. (1993). “Respiratory and laryngeal function of women and men during vocal intensity variation,” J. Speech Hear. Res. 36, 64–75. [DOI] [PubMed] [Google Scholar]
- Stathopoulos, E., and Sapienza, C. (1997). “Developmental changes in laryngeal and respiratory function with variation in sound pressure level,” J. Speech Lang. Hear. Res. 40, 595–614. [DOI] [PubMed] [Google Scholar]
- Stevens, K. (1999). Acoustic Phonetics (Current Studies in Linguistics) (MIT, Cambridge, MA: ). [Google Scholar]
- Stone, R. E., Cleveland, T. F., Sundberg, P. J., and Prokop, J. (2003). “Aerodynamic and acoustical measures of speech, operatic, and Broadway vocal styles in a professional female singer,” J. Voice 17, 283–297. 10.1067/S0892-1997(03)00074-2 [DOI] [PubMed] [Google Scholar]
- Story, B., Laukkanen, A. -M., and Titze, I. R. (2000). “Acoustic impedance of an artificially lengthened and constricted vocal tract,” J. Voice 14, 455–469. 10.1016/S0892-1997(00)80003-X [DOI] [PubMed] [Google Scholar]
- Story, B., Titze, I. R., and Hoffman, E. A. (2001). “The relationship of vocal tract shape to three voice qualities,” J. Acoust. Soc. Am. 109, 1651–1667. 10.1121/1.1352085 [DOI] [PubMed] [Google Scholar]
- Story, B. H. (1995). “Speech simulation with an enhanced wave-reflection model of the vocal tract,” Ph.D. thesis, University of Iowa, Iowa City, IA. [Google Scholar]
- Story, B. H. (2005). “Synergistic modes of vocal tract articulation for American English vowels,” J. Acoust. Soc. Am. 118, 3834–3859. 10.1121/1.2118367 [DOI] [PubMed] [Google Scholar]
- Story, B. H., and Titze, I. R. (1995). “Voice simulation with a body-cover model of the vocal folds,” J. Acoust. Soc. Am. 97, 1249–1260. 10.1121/1.412234 [DOI] [PubMed] [Google Scholar]
- Story, B. H., Titze, I. R., and Hoffman, E. A. (1996). “Vocal tract area functions from magnetic resonance imaging,” J. Acoust. Soc. Am. 100, 537–554. 10.1121/1.415960 [DOI] [PubMed] [Google Scholar]
- Sundberg, J. (1974). “Articulatory interpretation of the ‘singing formant’,” J. Acoust. Soc. Am. 55, 838–844. 10.1121/1.1914609 [DOI] [PubMed] [Google Scholar]
- Sundberg, J. (1977). “The acoustics of the singing voice,” Sci. Am. 236, 82–91. [DOI] [PubMed] [Google Scholar]
- Sundberg, J. (1995). “Vocal fold vibration patterns and modes of phonation,” Folia Phoniatr Logop 47, 218–228. [DOI] [PubMed] [Google Scholar]
- Sundberg, J., Gramming, P., and Lovetri, J. (1993). “Comparisons of pharynx, source, formant, and pressure characteristics in operatic and musical theatre singing,” J. Voice 7, 301–310. 10.1016/S0892-1997(05)80118-3 [DOI] [PubMed] [Google Scholar]
- Sundberg, J., Thalén, M., Alku, P., and Vilkman, E. (2004). “Estimating perceived phonatory pressedness in singing from flow glottograms,” J. Voice 18, 56–62. 10.1016/j.jvoice.2003.05.006 [DOI] [PubMed] [Google Scholar]
- Titze, I. R. (1984). “Parameterization of the glottal area, glottal flow, and vocal fold contact area,” J. Acoust. Soc. Am. 75, 570–580. 10.1121/1.390530 [DOI] [PubMed] [Google Scholar]
- Titze, I. R. (1988a). “The physics of small-amplitude oscillation of the vocal folds,” J. Acoust. Soc. Am. 83, 1536–1552. 10.1121/1.395910 [DOI] [PubMed] [Google Scholar]
- Titze, I. R. (1988b). “A framework for the study of vocal registers,” J. Voice 2, 183–194. 10.1016/S0892-1997(88)80075-4 [DOI] [Google Scholar]
- Titze, I. R. (2000). Principles of Voice Production (National Center for Voice and Speech, Denver, CO: ). [Google Scholar]
- Titze, I. R. (2006). “Theoretical analysis of maximum flow declination rate versus maximum area declination rate in phonation,” J. Speech Lang. Hear. Res. 49, 439–447. [DOI] [PubMed] [Google Scholar]
- Titze, I. R. (2008a). “Nonlinear source-filter coupling in phonation: Theory,” J. Acoust. Soc. Am. 123, 2733–2749. 10.1121/1.2832337 [DOI] [PMC free article] [PubMed] [Google Scholar]
- Titze, I. R. (2008b). “The human instrument,” Sci. Am. 298, 94–101. [DOI] [PubMed] [Google Scholar]
- Titze, I. R., Riede, T., and Popolo, P. S. (2008). “Nonlinear source-filter coupling in phonation: Vocal exercises,” J. Acoust. Soc. Am. 123, 1902–1915. 10.1121/1.2832339 [DOI] [PMC free article] [PubMed] [Google Scholar]
- Titze, I. R., and Story, B. H. (1997). “Acoustic interactions of the voice source with the lower vocal tract,” J. Acoust. Soc. Am. 101, 2234–2243. 10.1121/1.418246 [DOI] [PubMed] [Google Scholar]
- Titze, I. R., and Story, B. H. (2002). “Rules for controlling low-dimensional vocal fold models with muscle activation,” J. Acoust. Soc. Am. 112, 1064–1076. 10.1121/1.1496080 [DOI] [PubMed] [Google Scholar]
- Vennard, W. (1967). Singing: Mechanism and Technique (Carl Fischer, New York, NY: ). [Google Scholar]
- Vincent, T. (2008). “Love changes everything” from Andrew Lloyd Webber’s musical “Aspects of Love.” The performance is from the 2008 Summer Olympics and is freely available on YouTube retrieved from http://www.youtube.com/watch?v=flbqN3hospI (Last viewed 2∕4∕2009).
- Walker, E., and Hibbard, S. (1992). “Article on Aldophe Nouritt (1802–1839),” in New Grove Dictionary of Opera, edited by Sadie S. (Oxford University Press, New York, NY: ). [Google Scholar]
- Yanagisawa, E., Estill, J., Kmucha, T., and Leder, S. B. (1991). “Supraglottic contributions to pitch raising: Videoendoscopic study with spectral analysis,” Ann. Otol. Rhinol. Laryngol. 100, 19–31. [DOI] [PubMed] [Google Scholar]


