Abstract
MicroRNAs are conserved, small (20–25 nucleotide) noncoding RNAs that negatively regulate expression of mRNAs at the post-transcriptional level. Aberrant expression of certain microRNAs plays a causal role in tumorigenesis. Here, we report identification of hepatic microRNAs that are dysregulated at early stages of feeding C57BL/6 mice choline deficient and amino acid defined (CDAA) diet that is known to promote nonalcoholic steatohepatitis (NASH)-induced hepatocarcinogenesis after 84 weeks. Microarray analysis identified 30 hepatic microRNAs that are significantly (P≤0.01) altered in mice fed CDAA diet for 6, 18, 32 and 65 weeks compared to those fed choline sufficient and amino acid defined diet. Real-time RT-PCR analysis demonstrated upregulation of oncogenic miR-155, miR-221/222 and miR-21 and downregulation of the most abundant liver specific miR-122 at early stages of hepatocarcinogenesis. Western blot analysis showed reduced expression of hepatic PTEN and C/EBPβ respective targets of miR-21 and miR-155, in these mice at early stages. DNA binding activity of NF-kB that transactivates miR-155 gene was significantly (P=0.002) elevated in the liver nuclear extract of mice fed CDAA diet. Further, the expression of miR-155, as measured by in situ hybridization and real-time RT-PCR, correlated with diet-induced histopathological changes in the liver. Ectopic expression of miR-155 promoted growth of HCC cells whereas its depletion inhibited cell growth. Notably, miR-155 was significantly (P=0.0004) upregulated in primary human HCCs with concomitant decrease (P=0.02) in C/EBPβ level compared to matching liver tissues.
Conclusion
Temporal changes in microRNA profile occur at early stages of CDAA diet-induced hepatocarcinogenesis. Reciprocal regulation of specific oncomirs and their tumor suppressor targets implicate their role in NASH-induced hepatocarcinogenesis and suggest their use in the diagnosis, prognosis and therapy of liver cancer.
INTRODUCTION
Hepatocellular carcinoma (HCC) is the fifth most prevalent cancer in the world with annual death rate exceeding 500,000 1, 2. The low survival rate is probably due to the late stage diagnosis of this cancer. Primary hepatocellular carcinoma, the most common primary malignant tumor of the liver, accounts for >90% of all primary liver cancers. The development of hepatocellular carcinoma is a complex, multi-step process that is generally characterized by steatosis, hepatocyte degeneration, fibrosis, inflammatory infiltrates and Mallory's hyaline 3. The incidence of non-alcoholic fatty liver disease (NAFLD) is increasing dramatically, particularly in Western world, which can lead to an increase in the prevalence of non-alcoholic steatohepatitis (NASH) and associated complications such as cirrhosis and HCC 4. NASH can also be associated with obesity, diabetes and insulin resistance all of which can contribute to an increased risk of HCC. While our understanding of the pathogenesis of HCC in chronic viral infections such as hepatitis B or hepatitis C is improving, there is a complete lack of insight into the pathogenesis of NASH-associated HCC. Consequently, it is critical to delineate the molecular mechanisms involved in NASH-mediated hepatocarcinogenesis. An interesting and novel strategy is to determine changes in the expression profiles of specific microRNAs (miRNAs) and their target mRNAs at different stages of liver tumorigenesis in an animal model. Such exploration is likely to provide important information regarding the miRNA signature and their target mRNAs at very early stage of liver tumorigenesis and its relationship to the miRNA signature of primary human hepatocellular carcinoma that can be used in the diagnosis and prognosis of liver cancer.
MicroRNAs (miRNAs) are conserved small, non-coding RNAs identified in plants, animals and viruses 5 that, in general, negatively regulate gene expression by interacting with the 3'-UTR of protein coding genes 6. Primary miRNAs predominantly coded by RNA polymerase II are processed to precursor miRNAs (pre-miRs) by Drosha/DGCR8 in the nucleus 7. Pre-miRs are transported to the cytoplasm by Exportin 5 to undergo further processing by DICER1 to mature miRNAs that are recruited by miRNA-induced gene silencing complex (miRISC) to exert their biological functions.
Recent studies have identified an important role for miRNA in several human cancers including human hepatocellular cancer 8, 9. The expression profiling studies in human hepatocellular cancer have identified aberrant expression of several miRNAs 10. These signatures have the potential of use as markers of disease progression and prognosis, and may serve as therapeutic targets. Elucidating the role of aberrant miRNA expression at early stages in hepatocarcinogenesis is likely to enhance understanding pathogenesis of the disease.
While different animal models of hepatocarcingenesis are reported, a dietary model of NASH associated with progressive disease resulting in HCC 11, 12 is of particular interest. Rodents on this diet show well-defined pathological changes that are markedly similar to the progression of liver cancer in humans. We used a recently developed mouse model to identify temporal changes in miRNA expression with the goal to elucidate the role of specific miRNAs in the initiation and progression of hepatocarcinogenesis. Here, we show that some of the key oncomirs and their tumor suppressor targets are reciprocally regulated in murine dietary NASH model that mimic altered miR expression profile in primary human hepatocellular carcinomas.
MATERIALS AND METHODS
Mice and diet
All animal experiments and diet were described in Supplementary Methods.
Microarray analysis
Microarray analysis was performed as described 13. Briefly, 5 microgram of total RNA was used for hybridization of miRNA microarray chips. The chips were hybridized in 6XSSPE at 37°C. The miRNAs were labeled as biotin-containing transcripts and detected by streptavidin-Alexa647 conjugates. The processed slides were scanned using a microarray scanner. The miRNA nomenclature was according to miRBase (http://microrna.sanger.ac.uk).
The alteration in the level of microRNAs was considered statistically significant if their P-value was lower than 0.01. We also performed a global test to determine whether the expression profiles differed between the classes by permuting the labels of each array corresponded to each class. For each permutation, the P values were re-computed and the number of genes significant at the 0.01 level was noted. The proportion of the permutations that gave at least as many significant genes as with the actual data was the significance level of the global test: P=0.003 for the randomized block design and P=0.025 for the paired t test.
Real-time reverse-transcription polymerase chain reaction (RT-PCR) and in situ hybridization (ISH)
Real-time RT-PCR and ISH were described in Supplementary Methods.
Cell lines and HCC Tumor tissue
HCC cell lines obtained from ATCC were cultured as recommended by the supplier. Primary human hepatocellular tumor and adjacent normal tissue samples were obtained from the Cooperative Human Tissue Network at The Ohio State University James Cancer Hospital. Tissue specimens were procured in accordance with The Ohio State University Cancer Internal Review Board guidelines.
Preparation of the liver nuclear extract and EMSA were performed as described 14, 15
The detailed protocol and oligo sequences are provided in the Supplementary Methods.
Immunohistochemical analysis were performed as described 16, 17
Transfections
For miR precursor or anti-miR transfection, cells were plated in 60 mm dishes and transiently transfected with 50 nM pre-miR-155, negative control RNA, 60nM anti-miR-155 inhibitor, or control anti-sense RNA (Applied Biosystems, Foster City, CA).
Western blot analysis
Whole cell or tissue extracts were prepared in SDS lysis buffer followed by immunoblotting with specific antibodies (catalogue numbers are provided in the supplementary material) as described 17.
Cell proliferation assay
Cell proliferation was assessed using cell proliferation reagent kit I (MTT) (Roche Applied Science,Indianopolis, IN) as described 16.
Statistical analysis
Statistical significance of differences between groups was analyzed by unpaired Student's t test, and P≤0.05 was considered to be statistically significant. Paired Student's t test was used to analyze differences in expression of microRNAs and mRNAs levels among tumors and paired nontumor tissues in real-time RT-PCR analysis. Single and double asterisks indicate P≤0.05 and P≤0.01, respectively. The correlation between miR-155 and C/EBPβ mRNA levels was analyzed by two-tailed Pearson Correlation Test. All real-time RT-PCR (assayed in triplicate), western blotting and transfection experiments were repeated twice and reproducible results were obtained. A representative data is presented in each experiment.
RESULTS
Temporal changes in hepatic microRNA expression profile occur at early stages of hepatocarcinogenesis induced by CDAA diet
Choline-deficient, low methionine and amino acid-defined diet (CDAA diet) is known to induce liver tumors in C57BL/6 mice 11, 12 that are normally resistant to hepatocarcinogenesis. Mice on CDAA diet develop NASH at early stages leading to the formation of preneoplastic nodules after 65 weeks, and hepatocellular adenomas and carcinomas after 84 weeks 11, 12 (Supplementary Figure 1).
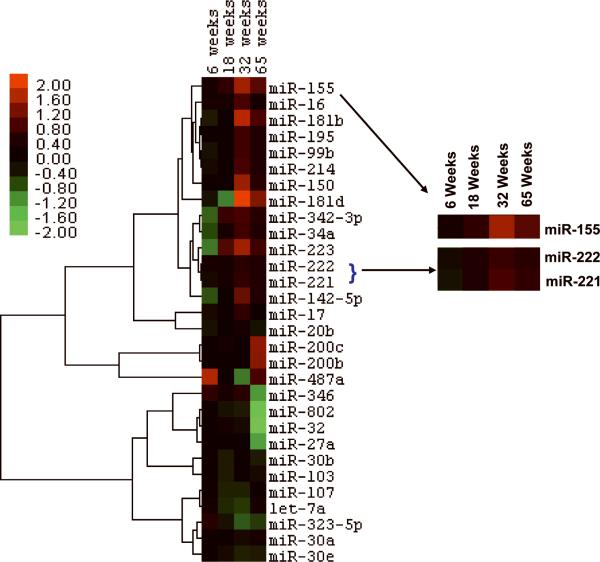
To identify miRs that may play a causal role in hepatocarcinogenesis we performed microarray analysis of hepatic RNA in mice fed CDAA diet for different time periods. The result showed deregulation of 30 miRNAs (P≤0.01) in mice fed CDAA diet for 6, 18, 32 and 65 weeks compared to those fed CSAA (control) diet (Figure 1). Among these miRNAs, 17 were upregulated and 10 were downregulated in at least one time point (Table 1). Three miRs, miR-17, miR-346, and miR-20b, were upregulated at 32 weeks, but decreased at 65 weeks. The upregulated miRs in mice fed CDAA diet can be broadly classified into four groups based on their expression: a) microRNAs such as miR-155, miR-221, miR-222, miR-34a, miR-223, miR-342 and miR-16 consistently upregulated and remained high from 18 to 65 weeks; b) miR-181, miR-150, miR-99b, miR-214, miR-142 and miR-195 increased at 32 and 65 weeks; c) miR-17, miR-346 and miR-20b upregulated transiently at 32 weeks; and d) miR-200 and miR-487a elevated only at 65 weeks. Based on this temporal pattern of expression of several miRs, it is conceivable that the targets of each miR are likely to be involved in precise control of diet-induced pathological changes in the liver. It is notable that some of these miRs, such as miR-221/222, miR-181b, miR-34a, miR-214, miR-16, and miR-99b, are also upregulated in the livers of human NASH patients 18.
Figure 1.
MicroRNA expression was dysregulated at early stages of hepatocarcinogenesis. A. Clustering of the miRNA expression profiles at 4 time points (6, 18, 32 and 65 weeks) was performed by average linkage using correlation metrics. MicroRNAs were selected by class comparison using analysis of variance with randomized block design. The cluster tree with the fold change of 30 miRs (P≤0.01) that varied with the time course was constructed.
Table 1.
Hepatic microRNAs dysregulated in mice fed CDAA diet for 6, 18, 32 and 65 weeks. Analysis of variance with randomized block design identified 30 hepatic miRNAs that are altered P<0.01) upon feeding mice CDAA diet compared to CSAA diet. RNA from 4 mice on CSAA diet and 5 mice on CDAA diet at each time point was used for microarray analysis.
| Gene Symbol | Fold Change |
Parametric p-value | FDR False Discovery Rate | |||
|---|---|---|---|---|---|---|
| 6 week | 18 week | 32 week | 65 week | |||
| miR-200c | 1.00 | 0.84 | 1.00 | 2.67 | 0.000 | 0.004 |
| miR-200b | 1.00 | 1.00 | 1.00 | 2.53 | 0.001 | 0.010 |
| miR-181d | 0.77 | 0.45 | 4.21 | 2.40 | 0.000 | 0.005 |
| miR-155 | 0.87 | 1.43 | 2.81 | 1.90 | 0.000 | 0.000 |
| miR-487a | 3.04 | 0.92 | 0.46 | 1.78 | 0.006 | 0.040 |
| miR-181b | 0.70 | 0.92 | 3.20 | 1.73 | < 1e-07 | < 1e-07 |
| miR-223 | 0.47 | 1.84 | 2.82 | 1.62 | < 1e-07 | < 1e-07 |
| miR-342-3p | 0.51 | 1.54 | 1.73 | 1.40 | 0.000 | 0.000 |
| miR-150 | 0.99 | 0.92 | 2.79 | 1.39 | 0.000 | 0.005 |
| miR-99b | 0.76 | 1.00 | 1.68 | 1.33 | 0.000 | 0.001 |
| miR-214 | 0.80 | 0.98 | 1.73 | 1.32 | 0.002 | 0.017 |
| miR-221 | 0.80 | 1.19 | 1.51 | 1.32 | 0.009 | 0.057 |
| miR-195 | 0.90 | 1.02 | 1.67 | 1.29 | 0.000 | 0.000 |
| miR-142-5p | 0.54 | 1.03 | 2.19 | 1.28 | 0.005 | 0.035 |
| miR-222 | 0.84 | 1.17 | 1.37 | 1.28 | 0.002 | 0.017 |
| miR-34a | 0.57 | 1.22 | 1.62 | 1.26 | 0.004 | 0.032 |
| miR-16 | 0.88 | 1.12 | 1.72 | 1.16 | 0.000 | 0.000 |
| miR-107 | 1.01 | 0.69 | 0.67 | 0.92 | 0.001 | 0.006 |
| miR-30a | 1.02 | 0.92 | 0.81 | 0.88 | 0.005 | 0.038 |
| let-7a | 1.10 | 0.66 | 0.62 | 0.85 | 0.005 | 0.038 |
| miR-103 | 1.00 | 0.71 | 1.08 | 0.81 | 0.009 | 0.054 |
| miR-30b | 0.99 | 0.73 | 0.96 | 0.74 | 0.004 | 0.032 |
| miR-30e | 0.96 | 0.83 | 0.70 | 0.70 | 0.010 | 0.059 |
| miR-323-5p | 1.34 | 0.75 | 0.52 | 0.60 | 0.001 | 0.008 |
| miR-27a | 1.06 | 1.01 | 0.97 | 0.40 | 0.007 | 0.048 |
| miR-802 | 1.00 | 0.74 | 0.71 | 0.28 | 0.000 | 0.000 |
| miR-32 | 0.98 | 0.87 | 0.79 | 0.21 | 0.000 | 0.001 |
| miR-17 | 0.83 | 0.99 | 1.45 | 0.90 | 0.000 | 0.003 |
| miR-346 | 1.50 | 1.19 | 1.34 | 0.41 | 0.000 | 0.001 |
| miR-20b | 0.77 | 0.92 | 1.20 | 0.76 | 0.002 | 0.016 |
Real-time RT-PCR analysis confirmed upregulation of several miRNAs including oncogenic miR-155, miR-221, miR-222, miR-21 and downregulation of miR-122 in mice fed CDAA diet
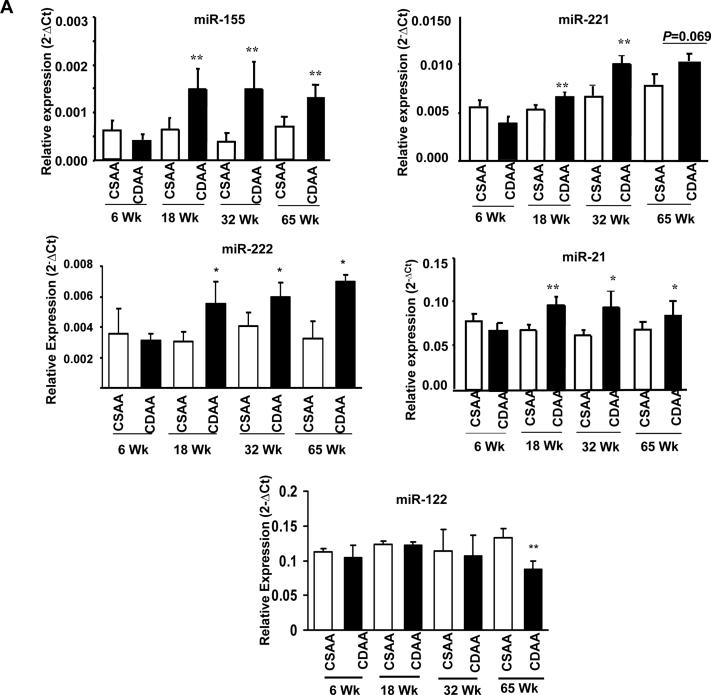
Next we confirmed dysregulation of a few critical miRs by real-time RT-PCR analysis of mature miRs. The result showed that hepatic miR-155 known to be induced by inflammatory mediators 19 was upregulated (~2.3 fold) (P=0.003) in animals fed CDAA diet for 18 weeks and remained elevated after 32 weeks (P=0.005) and 65 weeks (P=0.005) compared to that in the control mice (Figure 2A). We also observed significant upregulation of miR-221 (~1.5 fold) (P=0.0005) at early stage (18 and 32 weeks) (Figure 2A) suggests that it may play a key role in the NASH. Interestingly, miR-222 processed from the same primary transcript of miR-221 was also elevated (~1.5 fold) (P=0.02) after feeding CDAA diet for 18 and 32 weeks (Figure 2A). Unlike miR-221, miR-222 level remained elevated even after 65 weeks that may be due to differential processing of these two miRs. Notably, maximal increase in most of these miRs expression was observed after 32 weeks.
Figure 2.
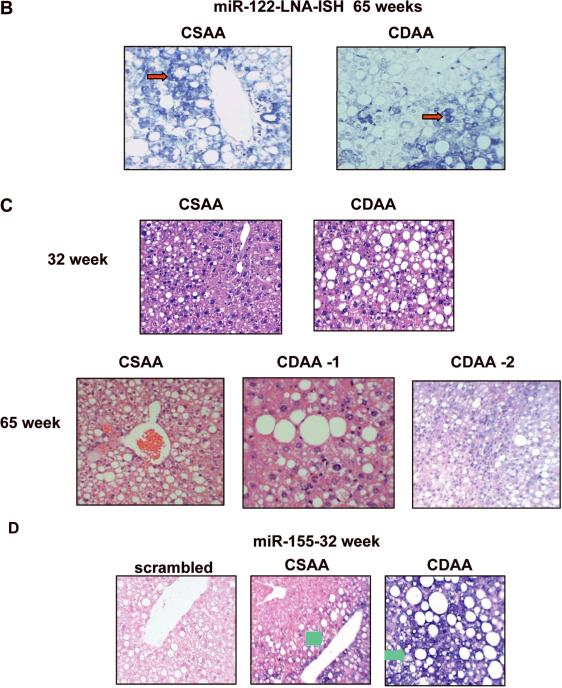
A. Validation of miRNA microarray data by real-time RT-PCR analysis of DNase I treated total RNA. RNAs from 5 mice were used for RT-PCR and each sample was analyzed in triplicate. Single and double asterisks denote P≤0.05 and ≤0.01 respectively. B. Localization of miR-122 in livers by LNA-ISH. Tissue sections were hybridized to biotin-labeled oligo (anti-miR-122), which was captured with alkaline phosphatase conjugated-streptavidin and the signal (blue color) was developed with NBT/BCIP. Cell body was stained with Nuclear fast red. Red arrows indicated mature miR-122. C. Representative photographs of H&E stained liver sections from mice. D. Localization of miR-155 in livers by LNA-ISH. Scrambled oligo probe was used as negative control. Green arrows indicated mature miR-155.
Although microarray analysis did not reveal significant alteration in the expression of miR-21, we measured its level by real-time RT-PCR analysis because it is an oncomir frequently upregulated in many solid tumors including HCC 20. The results showed small but significant increase in miR-21 after 18 weeks (P=0.0006) which persisted after 32 (P=0.006) and 65 weeks (P=0.03) of feeding CDAA diet (Figure 2A). In contrast, the level of miR-122, the most abundant (70%) hepatic miR and frequently downregulated in NASH 18 and HCC 21, decreased by 40% (P=0.006) at 65 weeks (Figure 2A). Northern blot analysis confirmed the real-time RT-PCR data of these two miRs (Supplementary Figure 2A, B). In situ hybridization with LNA-modified anti-miR-122 probe also showed decrease in miR-122 positive hepatocytes in mice fed CDAA diet for 65 weeks (Figure 2B). No signal was detected with scrambled oligo demonstrating specificity of the probes (data not shown). The inability to detect alteration in miR-21 and miR-122 by microarray analysis is probably due to saturation of the signal of these abundant miRs and higher threshold set for a specific analysis (such as P≤0.01 in this microarray analysis). Taken together, these results demonstrate dysregulation of both oncogenic and tumor suppressor miRs at early stages of CDAA diet-induced hepatocarcinogenesis, which is consistent with their differential expressions in primary human HCC 20, 21.
Histopathological analysis revealed NASH in mice fed CDAA diet that correlated with higher miR-155 level
Mice fed CDAA diet had higher level of steatosis (90% as opposed to 30–60% in the control livers) (Table 2A). A representative histopathology profile is presented in Figure 2C. Moderate inflammation occurred in the livers of mice fed CDAA diet for 32 weeks. Mice fed control diet had negligible NASH (score 1–2 points) whereas mice fed CDAA diet exhibited higher NASH (5 points) (Table 2A). Although animals on both diet groups developed marked steatosis after 65 weeks (Figure 2C), inflammation was more prominent in CDAA diet group (Table 2B). Dysplastic nodules were apparent in one liver (CDAA #2). Notably, 3 out of 4 mice developed NASH after 65 weeks on CDAA diet whereas none from the CSAA fed group exhibited NASH (Table 2B).
Table 2A. Liver pathology and miR expression in mice fed diet for 32 weeks.
Formalin-fixed paraffin-embedded (FFP) liver sections were (i) stained with H&E. Steatosis, inflammation and fibrosis were scored blind folded by a liver pathologist. FFP tissue sections were also subjected to in situ hybridization with LNA-modified anti-miR-155 (LNA-ISH) and miR-155 positive cells were counted. miR-155 was scored as follows: 1+ was between 1% and 20%+, 2+ was 21% to 50%+, 3+ was >50%+ (the majority of cells). The numbers were derived from counting at least 250 hepatocytes. miR-155 level was also determined in the liver by real-time RT-PCR.
| CASE | HISTOLOGY | miR-155-LNA-ISH | miR-155/18S rRNA (2−ΔCt × 104) |
|---|---|---|---|
| CSAA | Steatosis – 60% | ||
| Inflammation – 0 | 1+ | 4.28 | |
| Not NASH | 7% HEPATOCYTES + | ||
|
| |||
| CSAA | Steatosis – 50% | ||
| Inflammation – 0 | 2+ | 6.2 | |
| Not NASH | 22% HEPATOCYTES + | ||
|
| |||
| CSAA | Steatosis – 30% | ||
| Inflammation – 0 | 1+ | 2.57 | |
| Not NASH | 2% HEPATOCYTES + | ||
|
| |||
| CSAA | Steatosis – 30% | ||
| Inflammation – 0 | 1+ | 2.68 | |
| Not NASH | 5% HEPATOCYTES + | ||
|
| |||
| CDAA | Steatosis – 90% | ||
| Inflammation –moderate | 3+ | 17.56 | |
| NASH | 69% HEPATOCYTES + | ||
|
| |||
| CDAA | Steatosis – 90% | ||
| Inflammation –moderate | 3+ | 16.3 | |
| NASH | 57% HEPATOCYTES + | ||
|
| |||
| CDAA | Steatosis – 90% | Not determined | 11.38 |
| Inflammation –moderate | |||
| NASH | |||
|
| |||
| CDAA | Steatosis – 90% | Not determined | 22.13 |
| Inflammation –moderate | |||
| NASH | |||
Table 2B. Liver pathology and miR expression in mice fed diet for 65 weeks.
| Diet | HISTOLOGY | miR-155-LNA-ISH | miR-155/18S rRNA (2−ΔCt) × 104 |
|---|---|---|---|
| CSAA | Steatosis – 75% | ||
| Inflammation – mild | 2+ | 4.14 | |
| Not NASH | 21% HEPATOCYTES + | ||
|
| |||
| CSAA | Steatosis – 90% | ||
| inflammation– mild | 2+ | 5.25 | |
| Not NASH | 24% HEPATOCYTES + | ||
|
| |||
| CSAA | Steatosis – 90% | ||
| Inflammation– mild | Not determined | 1.46 | |
| Not NASH | |||
|
| |||
| CSAA | Steatosis – 90% | ||
| Inflammation– mild | 1+ | 3.37 | |
| Not NASH | 6% HEPATOCYTES + | ||
|
| |||
| CDAA | Steatosis – 90% | ||
| Inflammation – moderate to severe | 3+ | 7.25 | |
| NASH | 52% HEPATOCYTES + | ||
|
| |||
| CDAA | Steatosis – 90% | ||
| Portal tract inflammation –moderate | 3+ | 6.83 | |
| NASH | 55% HEPATOCYTES + | ||
|
| |||
| CDAA | Steatosis – 75% | ||
| Inflammation – moderate | 1+ | 3.33 | |
| Not NASH | 19% HEPATOCYTES + | ||
|
| |||
| CDAA | Steatosis – 90% | ||
| Inflammation– moderate | 3+ | 8.38 | |
| NASH | 59% HEPATOCYTES + | ||
Next we investigated whether diet-induced histopathological changes in the liver correlated with dysregulation of miR-155, known to be induced by inflammatory mediators 19, by LNA-ISH. The results showed high level of miR-155 in the cytoplasm of hepatocytes and inflammatory cells in mice fed CDAA diet for 32 weeks (Figure 2D). Although miR-155 was detectable only in a few steatotic hepatocytes in the livers of age-matched mice fed control diet, the number of miR-155 positive cells correlated with the extent of inflammation in each mouse (Table 2A, B). No signal was detected with scrambled oligo demonstrating specificity of the probes (Figure 2D). Further, real-time RT-PCR analysis of miR-155 expression level in individual mouse positively correlated with the number of miR-155 positive cells as well as the extent of inflammation in these mice, suggesting that miR-155 could play a causal role in the CDAA diet-induced pathogenesis.
CDAA diet induced activation of NF-κB upregulated hepatic miR-155
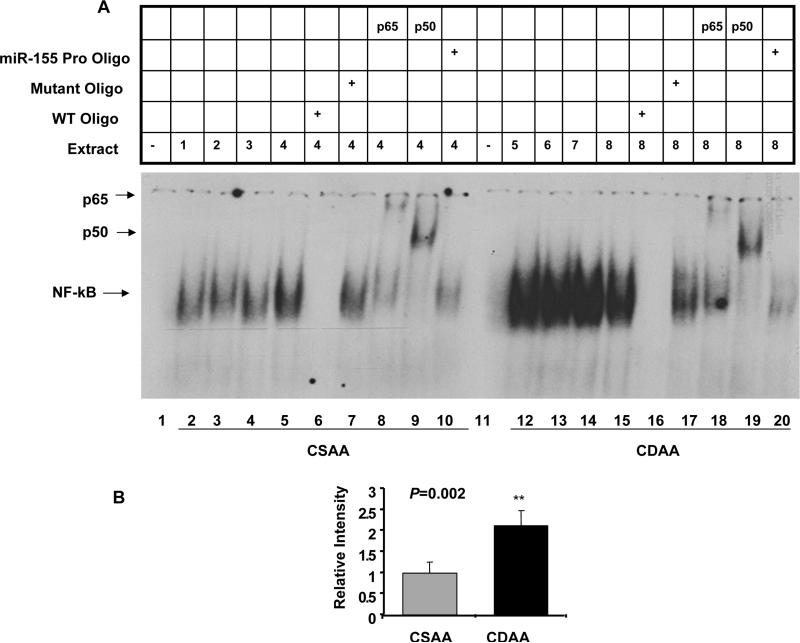
Next, we sought to identify the transcription factor that plays a key role in upregulation of hepatic miR-155 in mice fed CDAA diet. Since miR-155 level correlated with diet-induced inflammation (Table 2) and NF-κB is known to activate miR-155 expression 22, we performed EMSA with liver nuclear extracts from mice on CSAA or CDAA diet for 32 weeks. A specific complex was detected with 32P-labeled NF-κB probe in the liver nuclear extracts from mice fed CSAA diet that was 2 fold increased (P=0.002) in the mice fed CDAA diet (Figure 3A, compare lanes 12–15 to 2–5 and Figure 3B). The competition of the complex by an excess of unlabeled wild type but not the mutant oligo (Figure 3A, lanes 6, 7 and 16, 17), and supershift of this complex with antibodies specific for p65 and p50 subunits of NF-κB (Figure 3A, lane 8, 9 and 18, 19) confirmed its identity with NF-κB. Further, an excess of a duplex oligo encompassing NF-κB cognate site in miR-155 promoter was also able to compete out the complex formation (Figure 3A, lanes 10 and 20), indicating that NF-κB could bind to this site on miR-155 promoter.
Figure 3.
A. NF-κB was activated in the liver nuclear extract of mice fed CDAA diet. Identical amount (3 μg) of the extract was incubated with 32P-labed NF-κB oligo under optimal binding conditions. The protein DNA complex was resolved in a 5% polyacrylamide gel, dried and subjected to phosphorimager analysis. For competition and supershift assays, the extracts were preincublated with 100 fold molar excess of unlabeled oligos and antibodies, respectively for 30 minutes before adding labeled probe. B. Quantitative analysis of the data in A.
The tumor suppressors C/EBPβ and PTEN, respective targets of miR-155 and miR-21, were down regulated in the livers of mice fed CDAA diet
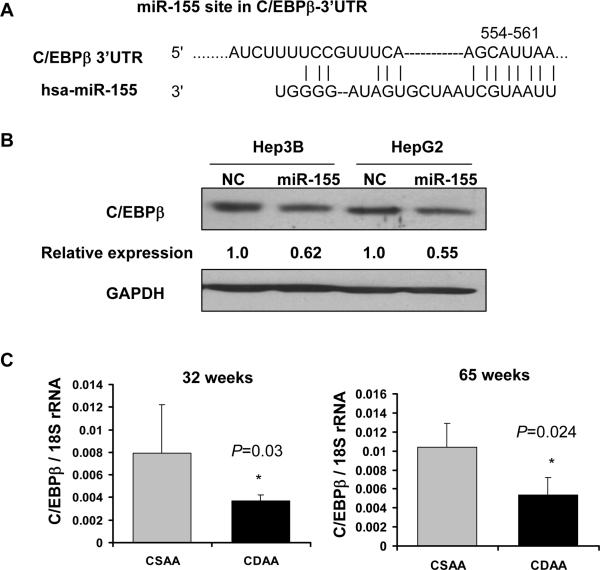
Next, we identified the possible target of miR-155 that may potentially be involved in diet-induced hepatocarcinogenesis. C/EBPβ, a tumor suppressor frequently suppressed in HCC 23, is a validated target of miR-155 24. C/EBPβ harbors a conserved miR-155 site in its 3'UTR (Figure 4A). Western blot analysis showed reduced expression of C/EBPβ in Hep3B and HepG2 cells transfected with pre-miR-155 (Figure 4B), indicating that miR-155 can target C/EBPβ in HCC cells. Next we checked C/EBPβ expression in the livers of mice fed CDAA diet. Its mRNA level decreased by ~50% after 32 (P=0.03) and 65 (P=0.024) weeks in mice fed CDAA diet compared to the control mice (Figure 4C). C/EBPβ protein level decreased by ~40% (P=0.02) after 32 weeks of feeding CDAA diet (Figure 4D) that was further reduced by ~80% (P=0.003) after 65 weeks (Figure 4D).
Figure 4.
Downregulation of C/EBPβ and PTEN, respective targets of miR-155 and miR-21, in the livers of mice fed CDAA diet. A. Schematic representation of conserved miR-155 site in C/EBPβ 3'UTR. B. Western blot analysis of C/EBPβ in HCC cells. Hep3B and HepG2 cells were transfected with pre-miR-155 (50nM) followed by Western blot analysis after 48 hours. C. Real-time RT-PCR analysis of C/EBPβ in the liver of mice fed diet for 32 and 65 weeks. D and E. Western blot analysis of C/EBPβ, PTEN and GAPDH in the liver extracts. Equal amount of proteins were subjected to immunoblot analysis first with specific primary and secondary antibodies and the signal was developed with ECL reagent. The signal was quantified using Kodak Imaging software and the data was normalized to GAPDH.
PTEN, another tumor suppressor that is a target of the upregulated miR-21 (Figure 2A) was also decreased by ~50% in protein level after 32 weeks (P=0.02) and 65 weeks (P=0.03) in mice fed CDAA diet (Figure 4E). No significant change in PTEN mRNA level was observed (data not shown).
miR-155 modulated growth of HCC cells
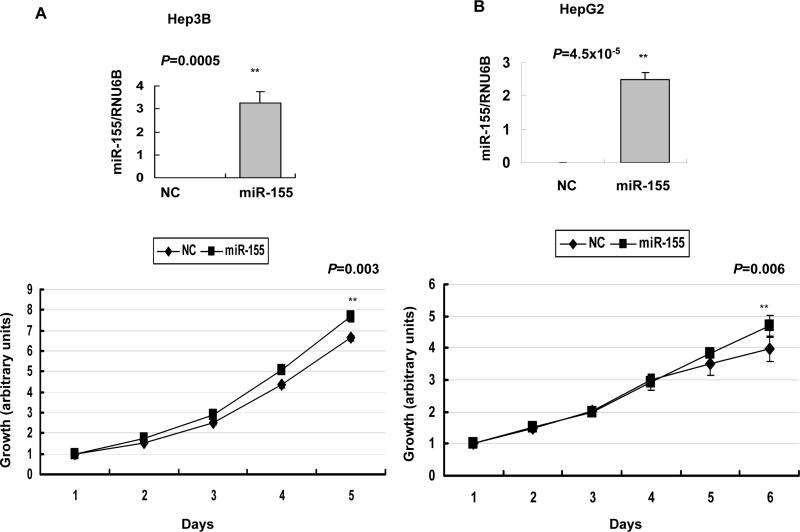
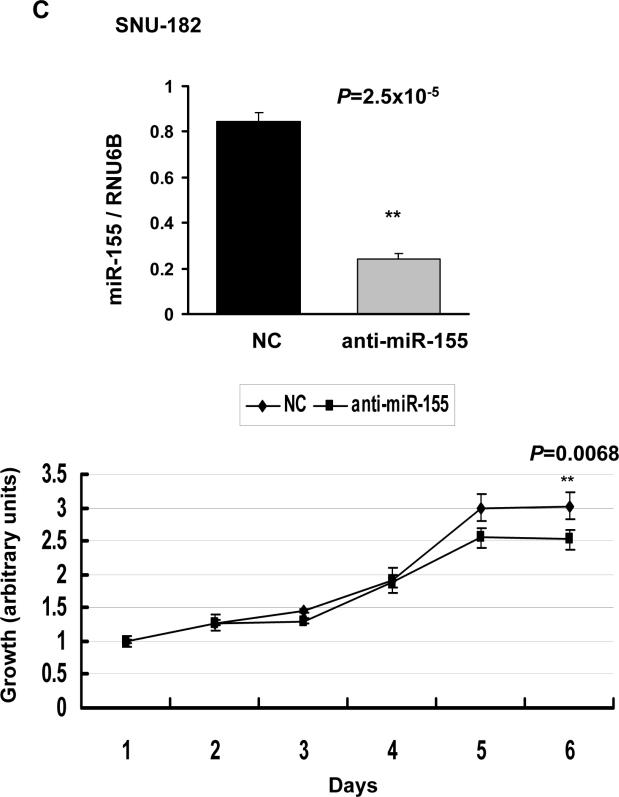
miR-155, upregulated in many primary cancers, demonstrated oncognic properties when overexpressed in lymphocytes 25. We, therefore, investigated its growth regulatory property in HCC cells. Overexpression of miR-155 by precursor transfection accelerated growth in both Hep3B (P=0.003) (Figure 5A) and HepG2 cells (P=0.006) (Figure 5B). In contrast, depletion of endogenous miR-155 by transfecting anti-miR-155 resulted in reduced growth of SNU-182 cells (P=0.0068 after 6 days) (Figure 5C). These results demonstrate growth stimulatory property of miR-155.
Figure 5.
A and B. Ectopic expression of miR-155 promoted growth of Hep3B and HepG2 cells in culture. Cells were transfected with miR-155 precursor or control RNA (50 nM) followed by MTT assay. C. Knockdown of endogenous miR-155 reduced SNU-182 cell growth. Cells were transfected with anti-miR-155 or control RNA (60 nM) followed by MTT assay. NC: negative control. The upper panels present real-time RT-PCR analysis of miR-155 in HCC cells at the last time point when cell growth was measured.
miR-155 was upregulated in primary human HCCs
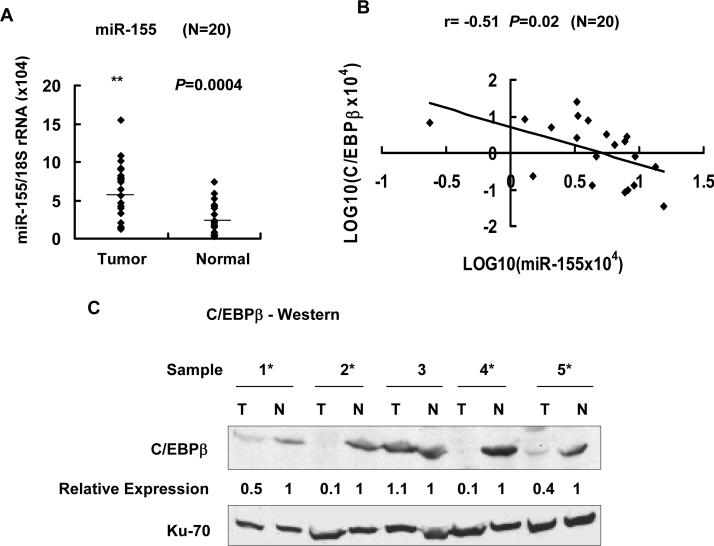
Next, we measured miR-155 level in primary human HCCs and pair-matched normal liver tissues. Among the 20 HCC samples analyzed (listed in Supplementary Table 5), miR-155 level increased in 16 HCC samples (P=0.0004) (Figure 6A). Comparison of miR-155 and its target showed inverse correlation between the two (N=20, r= −0.51, P=0.02) (Figure 6B). Immunoblot analysis of the extracts from 5 HCC samples demonstrated significant decrease in C/EBPβ protein levels in 4 HCCs compared to matching livers (Figure 6C). Immunohistochemical analysis of 3 HCC samples showed C/EBPβ beta expression was undetectable or very low (only in 5% cells) whereas in adjacent benign liver tissues 15 to 55% hepatocytes were positive for C/EBPβ (a representative photograph is shown in Supplementary Figure 3). These data showed reciprocal regulation of oncogenic miR-155 and its tumor suppressor target C/EBPβ in primary human HCCs, suggesting that miR-155 may play a causal role in transformation of hepatocytes.
Figure 6.
miR-155 and CE/BPβ levels were reciprocally regulated in primary hepatocellular carcinomas. A. Total RNA from 20 HCCs and pair-matched normal liver tissues was subjected to real-time RT-PCR analysis for miR-155 level. Expression of miR-155 in each sample presented in Supplementary Table 5 is depicted as dot plots. Horizontal bars indicate median expression value. B. Inverse correlation between C/EBPβ mRNA level and miR-155 expression in HCCs (r=−0.51, P=0.02), determined by real-time RT-PCR analysis in 20 HCC samples. C. Western blot analysis of C/EBPβ in whole tissue extracts (500 μg) from HCCs (T) and matching livers (N). Asterisks denote HCC samples in which C/EBPβ is reduced.
DISCUSSION
It is now well established that the expression of microRNAs and their key targets is either elevated or reduced in almost all types of cancer. Although a few altered microRNAs exhibit oncogenic or tumor suppressor properties, the biological functions of most microRNAs remain to be elucidated. To our knowledge, the present study is the first comprehensive analysis of differential expression of microRNAs and their important targets during preneoplastic transformation of hepatocytes in a mouse model. A major advantage of this model is that the liver tumor is developed in the absence of potent chemicals or viruses. While similar dietary deficiency also induces HCCs in rats, the development of the mouse model facilitates studies on the role of different genetic factors in the induction of hepatocarcinogenesis.
A significant observation of the present study is the dysregulation of specific microRNAs and their targets at early stages of hepatocarcinogenesis long before preneoplastic transformation implicating their role in the initiation of tumorigenesis. These altered miRNAs were almost identical to those observed in primary human HCCs. miR-21 and miR-221/222 have been reported to be upregulated in various types of cancers, including HCC 20, 26. Notably, the expression of PTEN, a tumor suppressor target of miR-21, was significantly reduced in the livers of CDAA-fed mice at early stages of tumorigenesis.
miR-155, a common target of proinflammatory cytokines 19 is overexpressed in solid tumors and functions as an oncogene when overexpressed in B cells 25. The correlation of miR-155 level with CDAA diet-induced pathological changes in the liver suggests that miR-155 plays a causal role in this dietary model of hepatocarcinogenesis. Our study also revealed that diet-induced activation of NF-κB plays a key role in miR-155 expression. Suppression of miR-155 in Huh-7 cells by Bay 11, a potent inhibitor of NF-kB, confirmed the role of NF-kB in miR-155 expression in hepatocyte derived cells (data not shown). It is conceivable that upregulation of miR-155 with concomitant downregulation of its tumor suppressor target C/EBPβ plays a causal role in diet-induced liver pathogenesis.
Although the present study focused on upregulated miRNAs, a few miRNAs including the most abundant liver miR-122, are suppressed in rodent and human primary HCC 21. Interestingly, a recent study displayed dramatic reduction of miR-122 level in human NASH patients 18. Microarray analysis has shown that downregulation of miR-122 leads to re-expression of genes that are normally suppressed in the liver 27. Thus, the loss of miR-122 is likely to promote dedifferentiation of hepatocytes. It would be of considerable interest to generate miR-122 conditional knock out mice for exploring its role in hepatocarcinogenesis in vivo.
In conclusion, using a mouse model of NASH we have shown that upregulation of oncogenic miRs with concomitant suppression of their tumor suppressor targets is a very early molecular event that could play a causal role in hepatocarcinogenesis. Interestingly, very similar changes in miR profile in livers of NASH patients 18 underscore the usefulness of the mouse model to test the therapeutic efficacy of microRNA mimetics (miR-122, let-7a) or anti-miR-155 in preclinical trials.
Supplementary Material
Acknowledgments
Grant support: CA086978 and CA101956 from National Institutes of Health.
Abbreviations used
- LNA-ISH
in situ hybridization with locked nucleic acid probe
- miRNA
microRNA
- miR
microRNA
- IHC
immunohistochemistry
Footnotes
Financial disclosers: None
No conflicts of interest
References
- 1.Bruix J, Boix L, Sala M, Llovet JM. Focus on hepatocellular carcinoma. Cancer Cell. 2004;5:215–219. doi: 10.1016/s1535-6108(04)00058-3. [DOI] [PubMed] [Google Scholar]
- 2.El-Serag HB, Rudolph KL. Hepatocellular carcinoma: epidemiology and molecular carcinogenesis. Gastroenterology. 2007;132:2557–2576. doi: 10.1053/j.gastro.2007.04.061. [DOI] [PubMed] [Google Scholar]
- 3.Yeh MM, Brunt EM. Pathology of nonalcoholic fatty liver disease. Am J Clin Pathol. 2007;128:837–847. doi: 10.1309/RTPM1PY6YGBL2G2R. [DOI] [PubMed] [Google Scholar]
- 4.Torres DM, Harrison SA. Diagnosis and therapy of nonalcoholic steatohepatitis. Gastroenterology. 2008;134:1682–1698. doi: 10.1053/j.gastro.2008.02.077. [DOI] [PubMed] [Google Scholar]
- 5.Eulalio A, Huntzinger E, Izaurralde E. Getting to the root of miRNA-mediated gene silencing. Cell. 2008;132:9–14. doi: 10.1016/j.cell.2007.12.024. [DOI] [PubMed] [Google Scholar]
- 6.Peters L, Meister G. Argonaute proteins: mediators of RNA silencing. Mol Cell. 2007;26:611–623. doi: 10.1016/j.molcel.2007.05.001. [DOI] [PubMed] [Google Scholar]
- 7.Stefani G, Slack FJ. Small non-coding RNAs in animal development. Nat Rev Mol Cell Biol. 2008;9:219–230. doi: 10.1038/nrm2347. [DOI] [PubMed] [Google Scholar]
- 8.Croce CM. Oncogenes and cancer. N Engl J Med. 2008;358:502–511. doi: 10.1056/NEJMra072367. [DOI] [PubMed] [Google Scholar]
- 9.Braconi C, Patel T. MicroRNA expression profiling: a molecular tool for defining the phenotype of hepatocellular tumors. Hepatology. 2008;47:1807–1809. doi: 10.1002/hep.22326. [DOI] [PubMed] [Google Scholar]
- 10.Volinia S, Calin GA, Liu CG, Ambs S, Cimmino A, Petrocca F, et al. A microRNA expression signature of human solid tumors defines cancer gene targets. Proc Natl Acad Sci U S A. 2006;103:2257–2261. doi: 10.1073/pnas.0510565103. [DOI] [PMC free article] [PubMed] [Google Scholar]
- 11.Denda A, Kitayama W, Kishida H, Murata N, Tsutsumi M, Tsujiuchi T, et al. Development of hepatocellular adenomas and carcinomas associated with fibrosis in C57BL/6J male mice given a choline-deficient, L-amino acid-defined diet. Jpn J Cancer Res. 2002;93:125–132. doi: 10.1111/j.1349-7006.2002.tb01250.x. [DOI] [PMC free article] [PubMed] [Google Scholar]
- 12.Nakae D. Endogenous liver carcinogenesis in the rat. Pathol Int. 1999;49:1028–1042. doi: 10.1046/j.1440-1827.1999.00990.x. [DOI] [PubMed] [Google Scholar]
- 13.Liu CG, Calin GA, Volinia S, Croce CM. MicroRNA expression profiling using microarrays. Nat Protoc. 2008;3:563–578. doi: 10.1038/nprot.2008.14. [DOI] [PubMed] [Google Scholar]
- 14.Gorski K, Carneiro M, Schibler U. Tissue-specific in vitro transcription from the mouse albumin promoter. Cell. 1986;47:767–776. doi: 10.1016/0092-8674(86)90519-2. [DOI] [PubMed] [Google Scholar]
- 15.Ghoshal K, Majumder S, Zhu Q, Hunzeker J, Datta J, Shah M, et al. Influenza virus infection induces metallothionein gene expression in the mouse liver and lung by overlapping but distinct molecular mechanisms. Mol Cell Biol. 2001;21:8301–8317. doi: 10.1128/MCB.21.24.8301-8317.2001. [DOI] [PMC free article] [PubMed] [Google Scholar]
- 16.Nasser MW, Datta J, Nuovo G, Kutay H, Motiwala T, Majumder S, et al. Downregulation of microRNA-1 (miR-1) in lung cancer: Suppression of tumorigenic property of lung cancer cells and their sensitization to doxorubicin induced apoptosis bymiR-1. J Biol Chem. 2008 doi: 10.1074/jbc.M804788200. [DOI] [PMC free article] [PubMed] [Google Scholar] [Retracted]
- 17.Datta J, Kutay H, Nasser MW, Nuovo GJ, Wang B, Majumder S, et al. Methylation mediated silencing of MicroRNA-1 gene and its role in hepatocellular carcinogenesis. Cancer Res. 2008;68:5049–5058. doi: 10.1158/0008-5472.CAN-07-6655. [DOI] [PMC free article] [PubMed] [Google Scholar] [Retracted]
- 18.Cheung O, Puri P, Eicken C, Contos MJ, Mirshahi F, Maher JW, et al. Nonalcoholic steatohepatitis is associated with altered hepatic MicroRNA expression. Hepatology. 2008;48:1810–1820. doi: 10.1002/hep.22569. [DOI] [PMC free article] [PubMed] [Google Scholar]
- 19.O'Connell RM, Taganov KD, Boldin MP, Cheng G, Baltimore D. MicroRNA-155 is induced during the macrophage inflammatory response. Proc Natl Acad Sci U S A. 2007;104:1604–1609. doi: 10.1073/pnas.0610731104. [DOI] [PMC free article] [PubMed] [Google Scholar]
- 20.Meng F, Henson R, Wehbe-Janek H, Ghoshal K, Jacob ST, Patel T. MicroRNA-21 regulates expression of the PTEN tumor suppressor gene in human hepatocellular cancer. Gastroenterology. 2007;133:647–658. doi: 10.1053/j.gastro.2007.05.022. [DOI] [PMC free article] [PubMed] [Google Scholar]
- 21.Kutay H, Bai S, Datta J, Motiwala T, Pogribny I, Frankel W, et al. Downregulation of miR-122 in the rodent and human hepatocellular carcinomas. J Cell Biochem. 2006;99:671–678. doi: 10.1002/jcb.20982. [DOI] [PMC free article] [PubMed] [Google Scholar]
- 22.Gatto G, Rossi A, Rossi D, Kroening S, Bonatti S, Mallardo M. Epstein-Barr virus latent membrane protein 1 trans-activates miR-155 transcription through the NF-kappaB pathway. Nucleic Acids Res. 2008;36:6608–6619. doi: 10.1093/nar/gkn666. [DOI] [PMC free article] [PubMed] [Google Scholar]
- 23.Tomizawa M, Watanabe K, Saisho H, Nakagawara A, Tagawa M. Down-regulated expression of the CCAAT/enhancer binding protein alpha and beta genes in human hepatocellular carcinoma: a possible prognostic marker. Anticancer Res. 2003;23:351–354. [PubMed] [Google Scholar]
- 24.O'Connell RM, Rao DS, Chaudhuri AA, Boldin MP, Taganov KD, Nicoll J, et al. Sustained expression of microRNA-155 in hematopoietic stem cells causes a myeloproliferative disorder. J Exp Med. 2008;205:585–594. doi: 10.1084/jem.20072108. [DOI] [PMC free article] [PubMed] [Google Scholar]
- 25.Costinean S, Zanesi N, Pekarsky Y, Tili E, Volinia S, Heerema N, et al. Pre-B cell proliferation and lymphoblastic leukemia/high-grade lymphoma in E(mu)-miR155 transgenic mice. Proc Natl Acad Sci U S A. 2006;103:7024–7029. doi: 10.1073/pnas.0602266103. [DOI] [PMC free article] [PubMed] [Google Scholar]
- 26.Fornari F, Gramantieri L, Ferracin M, Veronese A, Sabbioni S, Calin GA, et al. MiR-221 controls CDKN1C/p57 and CDKN1B/p27 expression in human hepatocellular carcinoma. Oncogene. 2008;27:5651–5661. doi: 10.1038/onc.2008.178. [DOI] [PubMed] [Google Scholar]
- 27.Krutzfeldt J, Rajewsky N, Braich R, Rajeev KG, Tuschl T, Manoharan M, et al. Silencing of microRNAs in vivo with `antagomirs'. Nature. 2005;438:685–689. doi: 10.1038/nature04303. [DOI] [PubMed] [Google Scholar]
Associated Data
This section collects any data citations, data availability statements, or supplementary materials included in this article.


