

Abstract
Effective representation and characterization of biosynthetic pathways of glycosylation can be facilitated by mathematical modeling. This paper describes the expansion of a previously developed detailed model for N-linked glycosylation with the further application of the model to analyze MALDI-TOF mass spectra of human N-glycans in terms of underlying cellular enzyme activities. The glycosylation reaction network is automatically generated by the model, based on the reaction specificities of the glycosylation enzymes. The use of a molecular mass cutoff and a network pruning method typically limits the model size to about 10,000 glycan structures. This allows prediction of the complete glycan profile and its abundances for any set of assumed enzyme concentrations and reaction rate parameters. A synthetic mass spectrum from model-calculated glycan profiles is obtained and enzyme concentrations are adjusted to bring the theoretically calculated mass spectrum into agreement with experiment. The result of this process is a complete characterization of a measured glycan mass spectrum containing hundreds of masses in terms of the activities of 19 enzymes. In addition, a complete annotation of the mass spectrum in terms of glycan structure is produced, including the proportions of isomers within each peak. The method was applied to mass spectrometric data of normal human monocytes and monocytic leukemia (THP1) cells to derive glycosyltransferase activity changes underlying the differences in glycan structure between the normal and diseased cells. Model predictions could lead to a better understanding of the changes associated with disease states, identification of disease-associated biomarkers, and bioengineered glycan modifications.
Keywords: automatic glycan annotation, glycosylation enzyme activity, mass spectrum, mathematical model, monocytic leukemia
Introduction
Glycans are highly variable and structurally diverse sugar chains that, when attached to membrane proteins and lipids, are a dominant feature of the mammalian cell surface. In contrast to protein structures, glycan structures are not directly encoded in the genome. Instead, the structure of secreted and membrane-bound glycans is determined during their assembly in the endoplasmic reticulum and the Golgi apparatus by a controlled sequence of glycosyltransferase and glycosidase processing reactions. In this paper, we have put forth a modeling methodology that enables the prediction of N-glycan mass spectrum data based on the activities and levels of processing enzymes distributed within mammalian cells. The many glycan structures found in cells are defined as a result of the enzyme activities, concentrations, and localization, and substrate and cofactor concentrations at the site of synthesis. In many diseases, including cancer, the distribution of glycan structures often differs from that of normal cells, leading to the possibility that disease-specific glycan structures exist and that these differences can be used for diagnostic and therapeutic purposes (Sell 1990). The ability to interpret these differences between normal and diseased states based on changes in the intracellular processing events and enzyme activities is especially intriguing. Development of glycan-based clinical procedures has been hindered by the difficulty of analyzing the thousands of oligosaccharide structures found on cells, which are usually present in minute quantities that make structural characterization a formidable challenge; this problem is compounded by the lack of a template for glycan structures that would allow their amplification by PCR-type methods. In recent years, however, new high-throughput and emerging glycomic technologies have been developed that are beginning to provide rapid advances in unraveling this complexity (Campbell and Yarema 2005; Packer et al. 2008). In particular, considerable effort has been put forth toward analytical methods to identify complex glycan structures and toward databases that relate these analytical measurements to known glycan structures and their properties. Some bioinformatics work has focused on the automatic annotation of mass spectra, involving the putative identification of glycan structures responsible for each of the measured peaks (von der Lieth et al. 2006; Goldberg et al. 2007). This type of analysis should be very useful for identifying glycan biomarkers that differentiate between healthy and diseased cells.
A more ambitious goal is to relate the observed mass spectrometric measurements to the underlying cellular enzymatic processes that cause them. This relationship could be used to interpret changes that occur in glycan structure associated with diseases in terms of alterations in the enzyme activities or levels. The goals of spectrum annotation and analysis of cellular processing changes could then be accomplished simultaneously with a mathematical model that quantitatively relates differences in experimental glycan profiles to the underlying changes in enzymatic activities.
One approach to relate glycosylation enzyme activities, or their gene expression levels, to glycan structure is based on a statistical analysis of the types of bonds each enzyme creates or cleaves with the abundances of the various bond types in each member of a large database of glycans (Kawano et al. 2005; Suga et al. 2007). The method, takes an observed change in the expression levels of glycosylation genes, say for normal and malignant cells, and predicts which glycan structures are likely to be increased or decreased by the change. While these results are promising, they are inherently qualitative. For a quantitative understanding of how changes in enzyme activities affect the profile of glycan structures produced, a model that includes details of the cellular processes that govern glycosylation is needed. Toward achieving this objective, the KB2005 model (Krambeck and Betenbaugh 2005) extended previous modeling attempts that had been limited to small subsets of the glycan structures (Umana and Bailey 1997) and specific enzymes such as for sialylation (Monica et al. 1997) to comprehensively model mammalian glycosylation at the cellular level for the first time. The KB2005 model separated glycan processing events into multiple zones that represented the Golgi compartments, each of which included the repertoire of enzymes known to process N-glycans in that compartment. The distribution of N-glycans that emerged from each compartment depended on the specific enzymes present, their activity levels, and the amount of cofactors available. In all, more than 22,800 different reactions were generated in this network from 11 enzymes capable of producing up to 7565 different N-glycan products. Overall the KB2005 model predicted the majority of the N-glycans known to be produced by CHO cells.
In the current paper, the modeling framework of KB2005 has been expanded using a general coding scheme that allows incorporation of many more glycosylation enzymes and structures. Literature data were reviewed in order to add the properties of enzymes needed for human N-glycans to those already included in the previous model for CHO cells. In addition to the new framework, methods for directly comparing model results with measured mass spectra have been incorporated.
This latter capability for comparing a model-generated synthetic mass spectrum to an experimental spectrum is particularly advantageous. It eliminates the requirement to separately identify (or “annotate”) the individual peaks in the mass spectrum. Current methods of automatic annotation are based on libraries of known or possible glycan structures with heuristic rules for selecting the most likely structures to explain each individual peak (Goldberg et al. 2005). While such annotation methods are very useful, there are often a number of alternative structures for the same peak and unidentified peaks that cannot be assigned. Also, since each individual peak is analyzed separately, structures assigned to one peak may require enzyme activities inconsistent with those structures assigned to another peak in the same spectrum. In this respect, a byproduct of fitting the model to a complete measured mass spectrum is a model-predicted set of structures that are consistent and optimized across the entire collection of peaks in the mass spectrum and not independent of each other.
While it is true that a single molecular mass number can result from many different isomers, a unique feature of this model-based method is that it matches all the peaks in the spectrum at once with a set of enzyme activities. A wealth of biological background information is already incorporated in the model, including which specific isomers are produced by the combined action of the enzymes. Adjustment of the enzyme activities to match the mass spectrum then results in a detailed consistent explanation of the spectrum in terms of individual structures.
In addition to identifying glycans from mass spectrometric data, the model includes the predictive capability to link reaction networks catalyzed by intracellular glycosylation enzymes to the final cellular complement of glycan structures. We anticipate that this relationship can be used to characterize differences between normal and diseased cells in terms of enzyme activities derived from measured mass spectrometric data from each cell type. In this way, our software suite has the potential to identify and characterize glycan-based disease markers in the context of cellular processing events and, especially, in terms of glycosylating enzyme activities. The model can also be used to predict how potential bioengineered changes in the enzyme activity profile of the cells will affect the glycan profile.
To illustrate this approach with a specific example, we present a case where the model parameters, specifically enzyme activities, were adjusted to match normal and malignant human monocyte N-glycan mass-spectra obtained from the Consortium for Functional Glycomics (CFG) website (http://functionalglycomics.org). The shifts in enzyme activities inferred by the model from the raw mass-spectrometric data were largely consistent with literature observations of normal versus malignant N-glycan profiles.
Results
Reaction network generation
A new framework that is far more flexible and general than the prototype version used in the KB2005 model was developed and implemented in the software module for the automatic generation of glycosylation structures and reaction networks. In the new framework, glycan structures are expressed using a condensed version of IUPAC linear formulas (McNaught 1996), with the shortened monosaccharide codes used in the LinearCode (Banin et al. 2002), but with a simpler branch ordering rule. Lowercase “a” and “b” denote α and β. The condensed formulas are explained below in more detail under Material and methods. Examples of some formulas are shown in Figure 1.
Fig. 1.

N-Glycan starting structures in the model. M = mannose ( ), GN = N-acetylglucosamine (
 ), G = glucose (
 ).
).
Using the condensed formulas, enzyme specificities are denoted using a string substitution methodology. The basic idea is to express the function of an enzyme by a pair of character strings. The first, or substrate substring, is the formula representation of the substructure of a glycan that the enzyme can act upon. The second, or product substring, is the formula representation of the substructure that the substrate substructure is transformed into by the enzyme action. Additional constraints on the substrate that are required for the enzyme action are expressed as a set of logical tests for the presence or absence of other substrings in the complete substrate formula. Details are explained in Material and methods.
This new framework allows the inclusion of sufficient additional glycosylation enzymes to generate meaningful glycan distributions for human N-glycans. The 19 enzyme activities now present in the N-glycan model, including the original 11 in the KB2005 model, are shown in Table I.
Table I.
Glycosylation enzymes included in the current model
| Abbreviation | Name | EC number | Example genes |
|---|---|---|---|
| ManI | α2-Mannosidase I | 3.2.1.113 | MAN1A1, MAN1A2, MAN1B1, MAN1C1 |
| ManII | α3/6-Mannosidase II | 3.2.1.114 | MAN2A1, MAN2A2 |
| a6FucT | α6-Fuc-transferase | 2.4.1.68 | FUT8 |
| GnTI | β2-GlcNAc-transferase I | 2.4.1.101 | MGAT1 |
| GnTII | β2-GlcNAc-transferase II | 2.4.1.143 | MGAT2 |
| GnTIII | β4-GlcNAc-transferase III | 2.4.1.144 | MGAT3 |
| GnTIV | β4-GlcNAc-transferase IV | 2.4.1.145 | MGAT4A, MGAT4B |
| GnTV | β6-GlcNAc-transferase V | 2.4.1.155 | MGAT5 |
| iGnT | Blood group i β3-GlcNAc-transferase | 2.4.1.149 | B3GNT1, B3GNT6 |
| b4GalT | β4-Gal-transferase | 2.4.1.38 | B4GALT1, B4GALT2, B4GALT3 |
| a3SiaT | α3-Sialyltransferase | 2.4.99.6 | ST3GAL3 |
| IGnT | Blood group I β6-GlcNAc-transferase | 2.4.1.150 | GCNT2 |
| a6SiaT | α6-Sialyltransferase | 2.4.99.1 | ST6GAL1 |
| b3GalT | β3-Gal-transferase | B3GALT1, B3GALT2, B3GALT5 | |
| FucTLe | α3/4-Fuc-transferase III | 2.4.1.65 | FUT3, FUT5, FUT6 |
| FucTH | α2-Fuc-transferase, Se, H | 2.4.1.69 | FUT1, FUT2 |
| a3FucT | α3-Fuc-transferase | 2.4.1.152 | FUT4, FUT7, FUT9 |
| GalNAcT-A | Blood group A α3-GalNAc-transferase | 2.4.1.40 | ABO |
| GalT-B | Blood group B α3-Gal-transferase | 2.4.1.37 | ABO |
For enzyme details, see Schomburg et al. (2004) (http://www.brenda.uni-koeln.de/).
The model follows the glycosylation reactions that take place in the Golgi stack of a cell assuming Michaelis–Menten kinetics to express the enzymatic reaction rates. The Golgi stack is assumed to be consist of four compartments corresponding to the cis-, medial- and trans-Golgi cisternae and the trans-Golgi network. The model begins with the two starting high-mannose structures of 9 and 8 mannose residues shown in Figure 1A and B, which are assumed to be generated upstream of the model in the endoplasmic reticulum and cis-Golgi network of the cell (Krambeck and Betenbaugh 2005). In addition, the mass spectrometric data discussed below indicate the presence of peaks corresponding to a small amount of 9-mannose glycan with a remaining glucose residue, also included in Figure 1C.
The action of the enzymes of Table I on glycan substrates is described by one or more reaction rules for each enzyme. As an example consider the two reaction rules for the enzyme mannosidase I shown in Table II. These rules encapsulate the reaction network developed by Herscovics (2001) for this enzyme. (Reaction rules for all the enzymes are given in Table VI.)
Table II.
Reaction rules for mannosidase I
| Enzyme | Substrate | Product | Constraint |
|---|---|---|---|
| ManI | (Ma2Ma | (Ma | ∼*2Ma3(…Ma6)Ma6 & #G = 0 |
| ManI | (Ma3(Ma2Ma3(Ma6)Ma6) | (Ma3(Ma3(Ma6)Ma6) |
Based on Herscovics (2001). See Table VII for explanation of rule symbols.
Table IV.
Model enzyme concentrations (μM) adjusted to match the mass spectra of glycans from human monocytes (normal) and THP1 monocytic leukemia cells (malignant)
| Enzyme | Normal | Malignant | Ratio | Reported trend | Cancer types |
|---|---|---|---|---|---|
| ManI | 0.821 | 0.599 | 0.73 | ||
| ManII | 0.625 | 0.588 | 0.94 | ||
| a6FucT | 0.266 | 0.247 | 0.93 | ||
| GnTI | 0.260 | 0.306 | 1.18 | ||
| GnTII | 1.557 | 0.537 | 0.35 | ||
| GnTIII | 0.0089 | 0.0401 | 4.52 | ||
| GnTIV | 0.222 | 0.271 | 1.22 | ||
| GnTV | 0.099 | 0.184 | 1.85 | Up | Various |
| iGnT | 3.47 | 2.70 | 0.78 | ||
| b4GalT | 0.196 | 0.339 | 1.73 | ||
| a3SiaT | 0.240 | 0.077 | 0.32 | ||
| IGnT | 2.23 | 3.58 | 1.61 | ||
| a6SiaT | 2.72 | 2.71 | 1.00 | Up | Colon |
| b3GalT | 5.04 | 1.65 | 0.33 | ||
| FucTLe | 0.071 | 0.808 | 11.4 | Up | Lung |
| FucTH | 5.47 | 14.4 | 2.63 | ||
| a3FucT | 7.42 | 19.4 | 2.61 | Up | Lung |
| GalNAcT-A | 0.000 | 0.014 | |||
| GalT-B | 0.929 | 0.574 | 0.62 | Down | Bladder |
The two rightmost columns of this table show reported trends in enzyme activities for various types of cancer (Brockhausen et al. 1998).
In applying reaction rules to a candidate structure, the algorithm first encloses the formula of the structure in parentheses. This ensures that the terminal residue of any branch begins with a left parenthesis. The first substrate rule of Table II, “(Ma2Ma,” specifies that a potential substrate glycan must contain a terminal mannose residue connected via an α(1,2)-linkage to another α-mannose residue for the rule to operate. Referring to Figure 1, it can be seen that the first of the three glycans in the figure contains three such substructures, and the second and third contain two.
The corresponding product rule, “(Ma,” specifies that the action of the rule converts the “(Ma2Ma” substructure to “(Ma,” thus removing the terminal mannose residue. The constraint substring in Table II specifies further conditions that the potential substrate must satisfy for the rule to operate. The rule uses some abbreviations that have been useful in expressing reaction rules. The abbreviations used are defined in Table VII. The first part of the constraint substring of the first rule in Table II, “∼*2Ma3(…Ma6)Ma6” states that there is one particular mannose that will not react by this rule, the terminal mannose on the middle branch of the first structure of Figure 1. The “∼” indicates the logical “not” operator and the “&” the logical “and”. The “*” indicates the reaction site on the substrate and the “…” any valid branch. The second part of the constraint substring of the first rule states that the rule will not operate if there are any glucose residues in the structure. The second rule in Table II indicates that once all the other α(1,2) mannose residues have been removed the nonreacting α(1,2) residue will finally react. The reaction network generated by repeated action of these two rules acting on the initial structures of Figure 1 is shown in Figure 2. Further details of the rule encoding scheme are given in Material and methods, along with Table VI, containing the rules for all the enzymes of Table I.
Table VII.
Codes for rules
| Symbol | Meaning | String expression |
|---|---|---|
| … | Ligand | Any string (possibly empty) with all parentheses matched. |
| _ | Continuation | Any string (possibly empty) where every “(“ is matched with a following “)” |
| | | Possible branch point | Empty string or (…). |
| * | Reaction site | Position of first difference between product and substrate strings |
| Gnbis | Bisecting Gn | Ma3(GNb4)(…Ma6)Mb4 |
| # | Number of | |
| ∼ | Logical not | |
| & | Logical and | |
| or | Logical or |
Fig. 2.

Reaction network generated by mannosidase I rules of Table II acting on the starting structures of Figure 1A and B (circled). This is the same network as given by Herscovics (2001).
Applying the rules for each enzyme in turn to the starting structures of Figure 1A and B generates a set of reactions and new product glycan structures. For example, applying the first rule of Table II to the 9-mannose starting structure (Figure 1A) gives the two structures in the second column of Figure 2 that are shown as products from the single structure in the first column of the figure. This process is then repeated using the new product structures as potential substrates to generate more reactions and structures. For example, the third column of Figure 2 results from applying the ManI first rule of Table II to the three structures of the second column of the figure. The second rule of Table II is applied to the last structure of the fourth column and results in the structure of the fifth column. The process of generating structures is repeated until either the process terminates, as it does in Figure 2 where no new structures can be generated, or until some other criterion is met, such as a maximum mass cutoff.
Using all the rules in Table VI, this algorithm never terminates and an infinite set of structures is theoretically possible. However, as a practical matter, structures beyond a certain molecular weight are of negligible abundance and will never be observed. Thus, the process of model reaction network generation is limited to a maximum glycan molecular mass. In the example discussed below, in which the experimentally measured mass spectrum extends to 5000, the maximum molecular mass in the model has been set to 4000 to keep the model at a manageable size. In addition a network “pruning” method has been developed to use literature-derived reaction rate parameters to estimate the abundance of the glycans during the network generation phase, so that structures of probable negligible abundance can be dropped. These methods result in reasonably sized models, with about 10,000–20,000 structures.
Table VI.
Current reaction rules
| Index | Enzyme | Substrate | Product | Constraint |
|---|---|---|---|---|
| 1 | ManI | (Ma2Ma | (Ma | ∼*2Ma3(…Ma6)Ma6 & ∼#G = 0 |
| 2 | ManI | (Ma3(Ma2Ma3(Ma6)Ma6) | (Ma3(Ma3(Ma6)Ma6) | |
| 5 | ManII | (Ma3(Ma6)Ma6 | (Ma6Ma6 | (GNb2|Ma3 & ∼Gnbis |
| 6 | ManII | (Ma6Ma6 | (Ma6 | (GNb2|Ma3 & ∼Gnbis |
| 7 | a6FucT | GNb4GN | GNb4(Fa6)GN | GNb2|Ma3 & ∼Gnbis & ∼Ab |
| 8 | GnTI | (Ma3(Ma3(Ma6)Ma6)Mb4 | (GNb2Ma3(Ma3(Ma6)Ma6)Mb4 | |
| 9 | GnTII | (GNb2|Ma3(Ma6)Mb4 | (GNb2|Ma3(GNb2Ma6)Mb4 | |
| 10 | GnTIII | GNb2|Ma3 | GNb2|Ma3(GNb4) | ∼Ab & ∼Gnbis |
| 11 | GnTIV | (GNb2Ma3 | (GNb2(GNb4)Ma3 | ∼Gnbis |
| 12 | GnTV | (GNb2Ma6 | (GNb2(GNb6)Ma6 | ∼Gnbis |
| 13 | iGnT | (Ab4GN | (GNb3Ab4GN | ∼*_Ma3|Mb4 |
| 14 | b4GalT | (GN | (Ab4GN | (∼*GNb4)(…Ma6)Mb4 |
| 15 | a3SiaT | (Ab4GN | (NNa3Ab4GN | |
| 16 | IGnT | (Ab4GNb3Ab | (Ab4GNb3(GNb6)Ab | |
| 17 | a6SiaT | (Ab4GN | (NNa6Ab4GN | |
| 18 | b3GalT | (GN | (Ab3GN | (∼*GNb4)(…Ma6)Mb4 |
| 20 | FucTLe | Ab3GNb | Ab3(Fa4)GNb | (Ab3* or (Fa2Ab3* or (NNa3Ab3* |
| 21 | FucTLe | (…Ab4GNb | (Fa3(…Ab4)GNb | (*Ab4 or (*Fa2Ab4 or (*NNa3Ab4 |
| 22 | FucTH | (Ab3GNb | (Fa2Ab3GNb | |
| 23 | FucTH | (Ab4GNb | (Fa2Ab4GNb | |
| 24 | a3FucT | (…Ab4GNb | (Fa3(…Ab4)GNb | (*Ab4 or (*Fa2Ab4 |
| 25 | GalNAcT-A | (Fa2Ab | (Fa2(ANa3)Ab | |
| 26 | GalT-B | (Fa2Ab | (Fa2(Aa3)Ab |
See Table VII for definitions of symbols used in formulating rules.
Model equations and parameters
Reaction rates are assumed to follow Michaelis–Menten-type kinetics with separate sites on each enzyme for a substrate and donor cosubstrate. Many substrates can compete for the substrate binding site on each enzyme. The rate equation for this system is given in Material and methods as Eq. (2). The values of the kinetic parameters for a given enzyme can vary significantly for different substrates. This was accommodated by selecting base values for these parameters for each reaction rule and adding a set of structure-dependent adjustment rules. Development of these parameter values and adjustments for CHO cell enzymes are detailed in KB2005 (Krambeck and Betenbaugh 2005). These have been supplemented with literature-based estimates for the additional human enzymes, as explained in Material and methods.
The Golgi compartments have been modeled as a series of four well-mixed reactors based on an earlier glycosylation modeling approach (Umana and Bailey 1997). The reaction kinetic equations are incorporated into steady-state material balance equations for each glycan structure in each compartment to give the complete set of model equations. Solution methods for the approximately 40,000 equations and unknowns are explained in Material and methods.
In addition to reaction kinetic parameters, the model includes a number of other parameters needed for the calculations, including compartment residence times, enzyme distributions between compartments, compartment volumes, total glycan concentration, and donor cosubstrate concentrations. These were estimated based on a variety of literature sources as explained in Material and methods. It should be emphasized that these numbers are intended to be reasonable initial estimates subject to further refinement as needed.
The primary objective of the model is to relate the glycan structure profiles produced in different types of cells to the relative activities of the glycosylation enzymes in these cells by adjusting only enzyme concentrations to predict changes from one cell type to another. This minimizes the effect of poorly known or unknown model parameters on the predictions.
Use of the model to analyze experimental MALDI mass spectrometric data for human cells
The Consortium for Functional Glycomics (CFG) maintains a website (http://www.functionalglycomics.org) that contains a wealth of data on glycan structures from a variety of normal and diseased cells. The majority of the glycan structural data from the CFG are in the form of MALDI-TOF mass spectrometer measurements, a method that gives singly charged mass spectrum peaks with very little fragmentation of the molecules (i.e., MALDI profiles). Identification of MALDI-TOF mass spectrum peaks with specific structures is a bottleneck in utilizing these data. Currently, the spectra on the CFG site are hand-annotated with likely structures, but there are often alternative structures for the same peak and unidentified peaks. An automated method for peak identification has been developed (Goldberg et al. 2005). This method does an excellent job of automatically assigning likely structures to each peak. However, there are often many potential structures for the same peak. While the method gives a likelihood score for each alternative, the amounts of these alternative structures actually present cannot be quantified.
To overcome these limitations, we developed an integrated software package that fully and automatically calculates all mass spectrum isotope peaks that result from each glycan structure in the model. Since the model predicts the amounts of all the significant glycan structures, it is possible to combine the mass spectra of all the model-predicted structures into an entire synthetic mass spectrum and compare this with the measured mass spectrum directly. The comparison of the measured and calculated mass spectra requires some processing of the experimental spectrum to correct for the baseline drift and mass calibration error and to integrate the individual peak areas. Details of the model mass spectrum calculation and adjustments to the experimental mass spectrometric data are given in Material and methods.
A limitation of the synthetic mass spectrum calculation arises from differences in the response factors for different compounds in the mass spectrometer. There is no reliable method to predict the response factor of an individual glycan quantitatively from the glycan's chemical structure. The mass spectra analyzed in this paper were obtained on samples that were first permethylated, which minimizes, but does not eliminate the variability of the response factors. On the other hand, relative changes in individual peaks of the spectra from one sample to another should still be significant.
Based on the comparison between calculated and experimental mass spectra, a nonlinear regression algorithm is used to adjust the enzyme concentrations in the model to bring the calculated mass spectrum into agreement with the measured mass spectrum. When good agreement is obtained, the model results provide not only an extremely detailed annotation of the mass spectrum peaks, including the breakdown of peaks containing multiple structures, but also an analysis of the entire glycan profile in terms of underlying enzyme activities. Changes in these enzyme activities provide a compact summary of the differences in mass spectra between different cell types, such as normal versus diseased. Importantly, because the model tracks each individual glycan isomer, matching the model to the mass spectrometric data gives an estimate of the proportion of every isomer within each mass spectrum peak.
As an example, the CFG website contains mass spectrometric data for both normal human monocytes and THP1 monocytic leukemia cells (http://www.functionalglycomics.org/ glycomics/publicdata/glycoprofiling.jsp). These results were analyzed by fitting the model to both data sets through adjustment of the model parameters.
A comparison between model calculated and processed experimental mass spectrometric peak areas, for both normal human monocytes and monocytic leukemia (THP1) cells, is shown in Figure 3. The figure shows all the mass spectrometric peaks with mass numbers in the 1400–4000 range. The data actually extend to a mass number of 5000, but the model structures were calculated only up to a mass number of 4000 in this demonstration in order to limit the number of model calculations performed. The approach could be readily extended to any mass number with a corresponding increase in the model calculations and computing time. The peaks in the experimental data lower than 1400 do not appear to correspond to N-glycans and are most likely artifacts caused by reagents introduced in processing the samples. It can be seen that most of the more abundant peaks showed excellent agreement, as did many of the smaller peaks. A relatively minor number of the smaller peaks, however, differ significantly from the parity line in Figure 3 and could use further optimization.
Fig. 3.

Comparison of measured mass spectrum peak areas of glycans from normal human monocytes ( ) and THP1 monocytic leukemia cells (
 ) with synthetic mass spectrum peak areas calculated from the model. The values plotted are the relative peak areas as a percentage of the total area of the spectrum. Mass numbers from 1400 to 4000 were included. The raw data files were downloaded from the CFG website and processed with software developed as described in Material and methods. (http://www. functionalglycomics.org/glycomics/publicdata/glycoprofiling.jsp).
The strategy for matching the model to the data was to divide the adjusted model parameters into two groups. The first group of model parameters, which included total concentration levels of each enzyme and the ratio of Man9:Man8 initial glycans entering the Golgi, were adjusted separately for each data set. This first group of adjusted parameters encapsulates the differences between the two data sets. The second group of adjusted model parameters were kept identical for the two data sets and served to improve the overall agreement of the model with both data sets. This second group of parameters was incorporated into the model as a set of adjustment rules added to the set of literature-based adjustment rules initially included in the model. These additional adjustment rules are shown in Table III.
Table III.
Adjustment rules added to improve agreement between the model and data
| Index | Enzyme | Rule | kf | Km | Kmd |
|---|---|---|---|---|---|
| 1 | ManI | #M = 9 | 1 | 500 | 1 |
| 1 | ManI | #M = 8 | 1 | 2.52 | 1 |
| 1 | ManI | #M = 7 | 1 | 1.04 | 1 |
The parameters Kf, Km, and Kmd for the indicated reaction rule index are multiplied by the adjustments when the substrate contains the adjustment rule string shown.
The three adjustment rules of Table III apply to reaction rule #1 for Mannosidase I shown in Table II. Depending on the number of mannose groups present, the Km value for the reaction is multiplied by the values shown. Since these Km adjustment factors are greater than 1, and the Km values appear in the denominator of the Michaelis–Menten reaction rate equation, the reaction rates for the higher mannose structures are decreased relative to the 6-mannose structure by these adjustments.
The ManI adjustments for the Man8 and Man7 structures are consistent with in vitro measurements, but the large adjustment for Man9 is not (Tabas and Kornfeld 1979). The large adjustment for Man9 may be needed to account for the heterogeneity of individual N-glycosylation sites on the whole mixture of glycoproteins in the cells. For example, it has been shown that of the three N-glycosylation sites on t-PA (tissue plasminogen activator), one site contains only a mixture of high-mannose glycans while the other two sites contain only complex glycans (Spellman et al. 1989). Thus, the mannosidase reactions are dramatically slower on the high-mannose sites than on the other sites. The very high value for the Man9 glycans indicates that they do not react at all, suggesting that the only Man9 glycans entering the Golgi network are on sites where they do not react. All the Man9 glycans on other glycosylation sites have already been converted to Man8 glycans in the endoplasmic reticulum, upstream of the Golgi stack.
Also, the experimental mass spectra included small peaks that result from an additional hexose residue on the initial 9-mannose structure of Figure 1A. This is most likely a glucose residue left over from the removal of glucose that takes place upstream of the cis-Golgi cisterna, so the structure containing glucose was added to the other two initial structures, as shown in Figure 1C. Similarly to the Man9 glycan, the structure with a residual glucose is also unreactive.
The adjusted model enzyme concentrations for the two sets of data are listed in Table IV. The enzyme concentration ratios are an estimate of the relative enzyme activity levels for the two types of cells. To provide some perspective on the biological relevance of the modeled output, we reasoned that it would be instructive to compare the results reported in Table IV with reported trends in N-glycan enzyme activity levels for various types of cancer compared to normal cells of the same type (Brockhausen et al. 1998). Interestingly, four of five trends reported previously for N-glycans are seen in the model-derived ratios of Table IV; the exception is a6SiaT (α6-sialyltransferase) where an upward shift was reported for colon cancer but the derived ratios show no change for leukemia. The model also derived several unreported trends, the most significant being increases for GnTIII and FucTH and decreases for b3GalT, a3SiaT, and GnTII.
This analysis provides a unique method of inferring enzyme activity profiles from raw mass spectrometric data. No preliminary step of identifying the peaks in the spectrum is needed. In fact, peak identifications are automatically produced as a byproduct of the analysis.
Details of the spectra for a portion of the mass range, from 2500 to 3000, are shown in Figure 4. In these charts, the relative peak areas are plotted against the average m/z value of the peak. Thus, each “peak” in the figure is actually the envelope of the isotopic satellite peaks of a single signal. The dominant structures producing each peak are indicated by schematic structural diagrams in the figure. Stars indicate where peaks only appear in significant amounts in either the normal or malignant cells. The supplementary material of this paper contains the mass range of 1500 – 4000 for both diseased and normal cells.
Fig. 4.

Comparison of model-calculated synthetic mass spectra with measured spectra for normal human monocytes and monocytic leukemia cells (THP1). The plots show the mass range from 2500 to 3000 (full-range modeled m/z 1400–4000). Units on the y-axis are relative intensities as % of total peak area of the spectrum in the modeled range. Mass spectrometric data are from the CFG website: http://www.functionalglycomics.org/glycomics/publicdata/glycoprofiling.jsp. mannose,  fucose,
  galactose, N-acetylglucosamine,
  N-acetylgalactosamine,
  N-acetylneuraminic acid,
  calculated,
  measured.
The main discrepancies between the model-calculated spectra and experimental spectra occur at monoisotopic masses of 1835.9, 2164.1, and 2635.3. These three masses have significant signals in the experimental spectra but are predicted to be very low by the model. The peak at 2164.1 that appears in the normal monocyte spectrum, and may also be present at a very low level in the THP1 cell spectrum, does not correspond to any known N-glycan structure and is absent from the model; it may be an artifact. The peak at 1835.9 corresponds to three structures in the model with monosaccharide composition F1GN4M3 (see Table V for sugar codes), the predominant one being GNb2Ma3(GNb2Ma6)Mb4GNb4(Fa6)GN (Figure 5A). This is present in earlier compartments of the model but is almost entirely reacted away by galactosylation in the final compartment. Perhaps optimization of the distribution of the enzymes among the compartments assumed in Table X could remedy this discrepancy. The peak at 2635.3 is due to a number of isomers with saccharide composition A1GN4M5NN1. These are bisected hybrid glycans, primari- ly NNa6Ab4GNb2Ma3(GNb4)(Ma3(Ma6)Ma6)Mb4GNb4GN (Figure 5B). In this case, the initial reaction of the hybrid precursor GN3M5 to add a bisecting GN is too slow in the model to produce a significant amount of the final product. Perhaps the assumed reaction rate of the GN3M5 precursor relative to other bisecting reactions is too slow. Modified adjustment rules could correct both of these discrepancies, but at present there is no literature precedent to justify these adjustments.
Table V.
Sugar codes used in formulas
| Monosaccharide | Code |
| d-Galactose | A |
| N-Acetygalactosamine | AN |
| l-Fucose | F |
| d-Glucose | G |
| N-Acetylglucosamine | GN |
| d-Mannose | M |
| N-Acetylneuraminic acid | NN |
Fig. 5.

Structures showing largest discrepancies in matching the model to the measured mass spectra for normal monocytes and monocytic leukemia cells. A = glactose (), F = fucose (), GN = N-acetylglucosamine (), M = mannose (), NN = N-acetylneuraminic acid ().
Table X.
Assumed distribution of enzymes between the four compartments of the model
| Enzyme | Comp 1 | Comp 2 | Comp 3 | Comp 4 |
|---|---|---|---|---|
| ManI | 0.967 | 0.032 | 0.001 | 0 |
| ManII | 0.15 | 0.45 | 0.3 | 0.1 |
| a6FucT | 0.15 | 0.45 | 0.3 | 0.1 |
| GnTI | 0.15 | 0.45 | 0.3 | 0.1 |
| GnTII | 0.15 | 0.45 | 0.3 | 0.1 |
| GnTIII | 0.15 | 0.45 | 0.3 | 0.1 |
| GnTIV | 0.15 | 0.45 | 0.3 | 0.1 |
| GnTV | 0.15 | 0.45 | 0.3 | 0.1 |
| iGnT | 0 | 0.6 | 0.3 | 0.1 |
| b4GalT | 0 | 0.05 | 0.2 | 0.75 |
| a3SiaT | 0 | 0.05 | 0.2 | 0.75 |
| IGnT | 0 | 0.05 | 0.2 | 0.75 |
| a6SiaT | 0 | 0.05 | 0.2 | 0.75 |
| b3GalT | 0 | 0.05 | 0.2 | 0.75 |
| FucTLe | 0 | 0.05 | 0.2 | 0.75 |
| FucTH | 0 | 0.05 | 0.2 | 0.75 |
| a3FucT | 0 | 0.05 | 0.2 | 0.75 |
| GalNAcT-A | 0 | 0.05 | 0.2 | 0.75 |
| GalT-B | 0 | 0.05 | 0.2 | 0.75 |
While other methods use mass spectrometry to estimate specific chemical structures using a bioinformatics approach, the method described here is currently the only one that predicts the structure based on the actual chemical kinetics of enzyme action as the glycans progress through the cellular apparatus and then compares this prediction to experimental observations. This technique is especially powerful because it enables users to identify the intracellular levels of enzymes in an optimized cellular glycosylation kinetic model based on a large number of mass spectrometric peaks. Furthermore, from changes in peak heights observed in different cell types, we are able to estimate differences in enzyme activities for different cell types (e.g., malignant versus normal) and environments.
Discussion
Techniques for glycan structure determination from mass spectra have been based on the use of libraries of known glycans, possibly extended through enzyme addition rules, to match an individual unknown mass spectrometric peak (Joshi et al. 2004; Goldberg et al. 2005). While standard bioinformatics approaches are useful, they treat each peak in isolation and neglect the complex interaction of a large number of glycosylation enzymes that together produce a complete glycan profile. An alternative approach presented here provides a tool for both glycan annotation and comprehensive analysis since it links glycan structure with enzyme levels. The resultant analysis is also comprehensive by analyzing across the full spectrum of peaks.
Our software suite is based on the generation of a network of reactions derived from glycosylation enzyme rules that define the biosynthetic pathways and result in prediction of glycan structures and abundances as related to enzyme activity levels. The components of the current modeling system include a scheme and algorithm to generate glycosylation reaction networks, a mathematical model for the Golgi apparatus, solution software, a synthetic mass spectrum generator, and an experimental mass spectrum analyzer. The kinetic parameters and adjustment rules for the various enzymes in the model are originally based on the literature data of enzyme kinetics obtained in vitro with simple substrates. Applying these values to real in vivo situations requires numerous assumptions for enzyme concentrations and other variables in the cells of interest. While these values are reasonable within an order-of-magnitude, the model predictions they engender cannot be expected to fully agree with experimental data without first tuning the model to match the glycan profiles obtained in one or more base (control) cases by adjusting enzyme concentrations and other parameters. Changes in parameter values from the base case needed to match the glycan profiles of other cases can then be calculated. Mathematical techniques to solve the model equations and adjust the model parameters to match data have been developed and tested, but further improvements are possible that will allow larger models to be used. This will allow higher molecular masses to be included in the model as well as more glycosylation enzymes and less network pruning.
Model-estimated shifts in enzyme levels between normal human monocytes and malignant monocytic leukemia cells (THP1) directly from mass spectrometric data gave results consistent with known shifts in enzyme activities for cancer. A notable change between the normal and malignant cells was the large increase in the FucTLe enzyme activity (α3/4-Fuc-transferase III), the enzyme essential for synthesizing Lewis blood group determinants that are elevated in malignant cells (Brockhausen et al. 1998) and are associated to pancreatic cancer (Miyoshi et al. 2008). Enzymes involved in glycan branching (GnTIV, GnTV, and IGnT) are also estimated by the model to be elevated in the malignant cells, and these enzymes are also elevated in multiple cancerous tissues (Brockhausen et al. 1998; Dennis et al. 1999; Varki et al. 2008). The one result shown in Table IV that is difficult to interpret in light of increased sialylation often observed in cancer is the reduced levels of a3SiaT predicted for the malignant cells. An interesting possibility is that dramatically increased levels of sialylated O-glycans reported in leukemic cells (Brockhausen et al. 1991), diverted the activity of α3SiaT away from N-glycan processing in the diseased cells, thereby explaining the apparent decrease in the levels of this enzyme in the modeled results.
The capability of the model to relate activity levels of cellular enzymes to specific glycan structures that are potential biomarkers of disease is a useful initial step toward understanding of the regulatory glycosyltransferase mechanisms. Importantly, glycosylation pathway generation could be used for biomarker discovery. Changes in enzyme levels that lead to the production of particular determinants, such as Lewisa/x, would be predicted to change other structures as well. The model could also be used to answer a large variety of diagnostic queries, such as the impact of knockouts or knockins on the occurrence of particular glycoforms or changes in glycoform distribution patterns.
The incorporation of additional enzymes to predict N-glycosylation of human cells in the current model was possible because of the new reaction framework which facilitates the implementation of additional enzymes and generation of larger reaction networks than was possible with our previous model (Krambeck and Betenbaugh 2005). Currently MALDI mass spectrometric data can be processed by the model. Tandem mass spectra capabilities that resolve glycan isomers would further strengthen the model's capabilities. In addition, the model may be expanded to consider additional analytical capabilities including lectin blotting in order to help interpret the complexity of the glycosylation processing. In the future, the incorporation of enzymes for O-glycosylation of proteins (Brockhausen et al. 1998), for glycosphingolipid synthesis (Varki et al. 2008), and for glycosoaminoglycans, and human milk oligosaccharides will result in an even more integrated model that can be combined with some of these complex analytical methods for a robust interpretation of cellular glycosylation processing in normal and diseased cell types.
Material and methods
Reaction network generation
Glycan Structure Representation
Glycan structures are described using short form IUPAC linear formulas (McNaught 1996) with some minor modifications. The first modification is to order the branches at a branch point based just on the branch locants, without regard to the lengths of the branches. In addition the sugar abbreviations have been replaced with the shorter abbreviations of the LinearCode (Banin et al. 2002). However, the ordering of branches based on sugar precedence, adopted in the LinearCode, has not been used here. The sugar abbreviations used in this work are shown in Table V. Figure 1 illustrates these compact linear formulas for the glycan starting structures for the model. This scheme provides linear formulas that are general, are easily readable by humans, and are unique for each glycan structure.
Enzyme Reaction Rules
Table I gives a list of the enzymes included in the current model. These are sufficient to produce most of the N-glycans present in human cells. Enzymes to add phosphates and sulfates to the glycans have so far been excluded. The reaction rules for these included enzymes are given in Table VI. The basic idea is that the “Substrate” column is a substring of the linear formula that must be present for the enzyme to act. The “Product” column specifies what the substrate string is replaced with through action of the enzyme. The “Constraint” column specifies a set of additional conditions that must be satisfied for the enzyme to act. These conditions are usually the presence or absence of another substring somewhere in the substrate formula. These are combined using the “not” operator (∼), the “and” operator (&), and the “or” operator (or), with parentheses as appropriate.
To simplify these expressions, a number of additional conventions have been added. All substrate formulas are assumed to be enclosed in parentheses before searching for the substrate substring. Thus, an initial “(“ always indicates the terminal end of a branch. Other codes and abbreviations used in formulating the reaction rules are summarized in Table VII.
The computer program required to generate a complete pathway from Table VI is straightforward, consisting of a series of string searches and substitutions. The algorithm begins with a list of starting structures, shown in this case for N-glycans in Figure 1. Each substrate rule and corresponding constraint rule is then applied to each structure in the list to determine which structures are substrates for each rule. The abbreviations of Table VII have turned out to be useful in formulating the rules. For structures that satisfy the rules, the product structure is determined, essentially by substituting the product substring of Table VI for the substrate substring, taking the various abbreviations into account. If the structure is not already in the list of structures, it is added to the list. At the same time, the new reaction is added to a reaction list. The reaction list includes the enzyme, substrate, cosubstrate, product, and coproduct strings for each reaction. This process is repeated until no new reactions can be generated.
Reaction kinetics
Consider the glycosylation of a glycan Pj with a monosaccharide S catalyzed by an enzyme E. Assuming that the donor cosubstrate is UDP-S, the overall reaction is shown in Eq. (1):
| (1) |
Assuming that the product Pi+1 competes for the same enzyme site as the substrate Pi, that the donor cosubstrate UDP-S occupies a second site on the enzyme, and that the reaction is reversible, the Michaelis–Menten kinetic equation takes the form shown in Eq. (2).
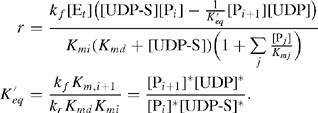 |
(2) |
Here, kf and kr are the forward and reverse rate coefficients, Kmi and Kmd are the dissociation constants for the substrate and donor cosubstrate, and K′eq is the apparent equilibrium constant for the overall reaction. The symbols [;]* in Eq. (2) denote equilibrium concentrations. The subscript “j” in the summation in the denominator is taken over all the substrates that compete for the same enzyme. A derivation for Eq. (2) is given in the KB2005 model (Krambeck and Betenbaugh 2005).
Kinetic Parameters and Adjustment Rules
The values of the kinetic parameters kf, Km, and Kmd for a given enzyme can vary significantly for different substrates. This was accommodated by selecting base values for these parameters for each reaction rule and by adding a set of structure-dependent adjustment rules. Development of these parameter values and adjustments for CHO cell enzymes are detailed in KB2005 (Krambeck and Betenbaugh 2005). These have been supplemented with estimates for the additional human cell enzymes. The base parameter values currently used for each of the reaction rules in Table VI are shown in Table VIII. Adjustment rules for the parameters are given in Table IX. Each adjustment rule includes a condition on the substrate structure and multipliers to apply to each of the three parameters whenever the condition is satisfied.
Table VIII.
Base values of kinetic parameters for rules in Table VI
| Index | Enzyme | kf | Km | Kmd |
|---|---|---|---|---|
| 1 | ManI | 1923.75 | 827 | 0 |
| 2 | ManI | 1923.75 | 5000 | 0 |
| 5 | ManII | 1923.75 | 200 | 0 |
| 6 | ManII | 1923.75 | 100 | 0 |
| 7 | a6FucT | 253 | 25 | 46 |
| 8 | GnTI | 990 | 260 | 170 |
| 9 | GnTII | 1320 | 190 | 960 |
| 10 | GnTIII | 607.2 | 4000 | 3100 |
| 11 | GnTIV | 187 | 3400 | 8300 |
| 12 | GnTV | 1410 | 130 | 3500 |
| 13 | iGnT | 24.66 | 700 | 55 |
| 14 | b4GalT | 8712 | 150 | 0 |
| 15 | a3SiaT | 484.1 | 260 | 57 |
| 16 | IGnT | 25 | 440 | 0 |
| 17 | a6SiaT | 25 | 180 | 0 |
| 18 | b3GalT | 25 | 110 | 250 |
| 20 | FucTLe | 481 | 1900 | 10.5 |
| 21 | FucTLe | 25 | 1600 | 5 |
| 22 | FucTH | 28.2 | 1500 | 108 |
| 23 | FucTH | 28.2 | 5700 | 108 |
| 24 | a3FucT | 25 | 1400 | 9 |
| 25 | GalNAcT-A | 294 | 15 | 13 |
| 26 | GalT-B | 390 | 281 | 285 |
Table IX.
Adjustment rules to be multiplied by base values in Table VIII
| Index | Enzyme | Rule | kf | Km | Kmd |
|---|---|---|---|---|---|
| 1 | ManI | #M = 9 | 1 | 500 | 1 |
| 1 | ManI | #M = 8 | 1 | 2.52 | 1 |
| 1 | ManI | #M = 7 | 1 | 1.04 | 1 |
| 10 | GnTIII | GNb2|Ma6 | 1 | 0.0475 | 1 |
| 11 | GnTIV | ∼GNb2|Ma6 | 1 | 5 | 1 |
| 11 | GnTIV | Ab4GNb2|Ma6 | 1 | 1.5 | 1 |
| or Ab4GNb6)Ma6 | |||||
| 11 | GnTIV | GNb6)Ma6 | 1 | 0.178 | 1 |
| 12 | GnTV | GNb4)Ma3 | 1 | 0.6923 | 1 |
| 13 | iGnT | *_Ma3 | 1 | 10 | 1 |
| 13 | iGnT | *_GNb2Ma6 | 1 | 4 | 1 |
| 13 | iGnT | *_GNb2Ma3 | 1 | 4 | 1 |
| 14 | b4GalT | *_GNb2|Ma6 | 1 | 0.9 | 1 |
| 14 | b4GalT | *_GNb4)Ma3 | 1 | 0.5333 | 1 |
| 14 | b4GalT | *_GNb2|Ma3 | 1 | 26.667 | 1 |
| 14 | b4GalT | Gnbis & GNb2|Ma6 | 1 | 3.62 | 1 |
| 15 | a3SiaT | #NN>1 | 1 | 5 | 1 |
| 20 | FucTLe | Fa2Ab3* | 0.05 | 0.1053 | 1 |
| 20 | FucTLe | NNa3Ab3* | 0.05 | 0.3526 | 1 |
| 21 | FucTLe | (*Fa2Ab4 | 1 | 0.6875 | 1 |
| 21 | FucTLe | (*NNa3Ab4 | 1 | 0.0625 | 1 |
| 24 | a3FucT | (*Fa2Ab4 | 4.08 | 0.5 | 1 |
Simulation model
Assuming well-mixed compartments and the above Michaelis–Menten kinetics for the glycosylation reactions, equations were derived to solve for the concentrations of each of the individual glycan structures in each of the Golgi compartments in KB2005 (Krambeck and Betenbaugh 2005). The case with 7565 structures and four compartments has 30,260 equations and unknowns.
Other Model Parameters
The model includes a number of other parameters needed for the calculations, including compartment residence times, enzyme distributions between compartments, compartment volumes, total glycan concentration, and donor cosubstrate concentrations. These were estimated based on a variety of literature sources as detailed in KB2005 (Krambeck and Betenbaugh 2005). Compartment residence times were estimated to be 5.6 min each. The assumed distribution of enzymes between the four compartments is shown in Table X and the assumed nucleotide sugar donor concentrations are shown in Table XI. It should be emphasized that these numbers are intended to be reasonable initial estimates subject to further refinement. Furthermore, enzyme concentrations vary widely with changes in the expression level.
Table XI.
Assumed donor concentrations in Golgi compartments
| Donor | Concentration (μM) |
|---|---|
| GDP-Fuc | 5000 |
| UDP-GlcNAc | 9143 |
| UDP-Gal | 3810 |
| CMP-NeuAc | 2286 |
| UDP-GalNAc | 3000 |
The use of the model to infer changes in enzyme activities between different disease states of cells depends on the assumption that the changes in enzyme activity levels are the main cause in the observed changes in glycan structure between the cell states rather than the effects of other cell characteristics that may also change between the cell states. While it is well known that enzyme activity levels vary considerably between different cell-types and tissues in an individual, and between normal and diseased cells (Brockhausen et al. 1998), possible variations in other quantities affecting glycosylation are less well documented.
A few measurements are available of the residence times of proteins in the compartments (Bibila and Flickinger 1991). It has been found that the Golgi compartment volumes can vary considerably as the state of a cell changes (Griffiths et al. 1989). These changes in compartment volume presumably affect the residence times of proteins in the compartments. However, the effects of changes in compartment residence times in the model are indistinguishable from the effects of changes in enzyme concentrations within the compartments. Thus, very little model robustness is lost by assuming that the residence times are unchanged between the cell states.
Changes in donor cosubstrate concentrations in the Golgi compartments do occur between different cell states due to changes in the activities of enzymes that synthesize the donors, as well as due to changes in the activities of the transporter proteins that concentrate the donors in the Golgi compartments. While the Kmd values for many of the enzymes are very low, so that those enzymes are almost always saturated with the donors, some of the enzymes have higher values, so that changes in donor concentration can be significant. Thus, the donor synthesis and transport processes should be included in future versions of the model.
Numerical methods
The model equations are nonlinear algebraic equations which are solved for the concentrations of each of the structures in each of the four Golgi compartments. These are solved using a constrained Newton–Raphson method with the Harwell MA28 sparse linear solver (HSL 2002). The efficiency of a sparse linear solver for large numbers of variables depends on the problem Jacobian being sparse. The Michaelis–Menten denominator terms in Eq. (2) involve a large number of species that compete for each of the enzymes. This could make the Jacobian matrix rather dense. To avoid this, the denominator terms for each enzyme are formulated as separate variables with equations added to specify how the denominators are calculated. This confines the equations with large numbers of variables to only one for each enzyme. Analytical derivatives were used. While each compartment could be solved separately in sequence to give four subproblems, each one-fourth the size, this was not found to be necessary.
In addition to solving the model for a given set of model parameters, provision was also made to adjust parameters to match a given set of data. This was done using the Marquardt-Levenberg method with numerically estimated derivatives (Marquardt 1963). The same method was used for optimizing model parameters to achieve a desired distribution of glycan structures.
The Marquardt–Levenberg method is typical of nonlinear optimization algorithms in that it makes use of a sequence of local linear approximations to the nonlinear model to converge to a solution that is a local optimum. Except in special cases, there is no way to determine whether the nonlinear problem possesses an even better solution far removed from this point. Experience in using this method shows, however, that if a reasonably good fit is obtained with the local optimum it is also a global optimum for the parameter estimation problem. All required calculations were performed on a laptop computer.
Mass spectrometric analysis software
Mapping Glycan Structure Distributions to MALDI MS
A significant development in this paper was the mapping of model-calculated glycan distributions to synthetic mass spectra for direct comparison with measured MALDI mass spectra, as illustrated in Results. Several steps are involved in generating the synthetic spectrum:
The chemical formula of each model-predicted glycan structure is calculated after sample preparation. This step is necessary because after glycans are removed from their protein or lipid carrier; they are permethylated to improve the stability of the ions and reduce the variability of the mass spectrometer response factors of different glycans. This process replaces each OH group with an OCH3 group. The glycans also receive a sodium ion. These steps change the mass of the glycan necessitating this calculation.
A table of isotope masses and abundances for each element is used to calculate the relative abundances and masses of the isotopic satellite peaks for each glycan. These follow a multinomial distribution.
The model-predicted concentration of each glycan is multiplied by the relative abundances of each of its isotopic peaks, and these are summed for all the glycans in the model.
A computer program was developed to rapidly calculate the most significant isotope peaks for each glycan (those amounting to at least 10−6 of the total for the glycan) and store them in a database. The final step of multiplying and summing over all the glycans is then very rapid.
Processing Experimental Mass Spectra
The experimental MALDI mass spectra require processing before comparison with the synthetic mass spectra through baseline correction, mass calibration adjustment, and peak integration.
The baseline correction method was adapted from Williams et al. (2005). The mass calibration was done by finding the linear mass adjustment that maximizes the sum of the experimental peaks interpolated to the theoretical masses of the model-predicted glycan peaks. An approximate area for each peak in the baseline-corrected and mass-calibrated spectrum was calculated as follows: first, the nearest local maximum to the theoretical mass for each peak was determined to give a “peak height.” Then, a “peak width” was determined for the 50 largest peaks by finding the point on either side of the maximum with an intensity of exp(−π/4) (or 45.6%) of the peak height. Note that multiplying this peak width by the peak height would give the exact area of a Gaussian peak and also approximates the area of a skewed peak, such as a relatively narrow gamma distribution. The peak widths for the largest peaks so determined are then correlated as a linear function of peak molecular mass to accommodate the broadening of mass spectrometer peaks with increasing mass. The linear correlation of peak width versus peak molecular mass is then used to calculate a peak width for every peak in the spectrum. The calculated peak width is multiplied by the peak height to estimate the peak area. These peak areas are then normalized to add up to 100%. Examples of processed experimental spectra and calculated synthetic spectra are shown in Figure 4 and in the Supplementary Data. The points on this plot are the area of each peak plotted against the mass at the peak maximum. Thus, the curves on the plots are isotope envelopes.
Spectrum Matching and its Significance
The enzyme concentrations in the model can be adjusted to bring the calculated synthetic mass spectrum into agreement with the measured mass spectrum using a nonlinear regression algorithm. When good agreement is obtained, which is usually the case, the result amounts to an automatic annotation of the measured mass spectrum since the identities and amounts of the specific glycan structures that comprise each of the peaks are calculated by the model. This annotation is more meaningful than one arrived at by the conventional method of searching through a library of possible structures that match each peak and ranking their likelihood by some heuristic. In the model-based method, rather than treating each peak as an independent entity the whole spectrum is forced to be consistent with a set of known biochemical reactions containing some combination of a number of enzyme activities. Thus, if a given enzyme or combination of enzymes is elevated in the model, all the products that result from the action of that enzyme or combination of enzymes will be similarly elevated. Furthermore, the model enzyme activities needed to match the data provide significantly greater insight into the meaning of the mass spectra than the large list of glycan identities themselves.
Supplementary Data
Supplementary data for this article is available online at http://glycob.oxfordjournals.org/.
Funding
The National Cancer Institute (Award Number 5R41CA127885-02).
Acknowledgments
David Goldberg of the Scripps-PARC Institute for Advanced Biomedical Sciences, Palo Alto, CA kindly provided the output of his “Cartoonist” automatic annotation software for the two sets of mass spectrometric data analyzed here. This output was very helpful in debugging the mass spectrum analysis methods utilized in this paper.
Conflict of interest statement
The content is solely the responsibility of the authors and does not necessarily represent the official views of the National Cancer Institute or the National Institutes of Health.
Abbreviations
- [Et]
enzyme concentration, μM
- KB2005
(Krambeck and Betenbaugh 2005)
- K′eq
apparent equilibrium constant
- kf
turnover number, min−1
- Km
Michaelis–Menten dissociation constant of substrate, μM
- Kmd
Michaelis–Menten dissociation constant of donor cosubstrate, μM
- Kmi
Michaelis–Menten dissociation constant of substrate i, μM
- kr
reverse reaction rate coefficient, min−1 μM−1
- MALDI
matrix assisted laser desorption ionization
- m/z
mass-to-charge ratio of mass spectrometric peaks
- [Pi]
concentration of substrate i, μM
- r
reaction rate, μM/min
- THP1
a line of monocytic leukemia cells
- TOF
time of flight
- [UDP-S]
concentration of nucleotide-sugar donor, μM
- []*
equilibrium concentration
References
- Banin E, Neuberger Y, Altshuler Y, Halevi A, Inbar O, Nir D, Dukler A. A novel linear code (R) nomenclature for complex carbohydrates. Trends Glycosci Glycotechnol. 2002;14:127–137. [Google Scholar]
- Bibila TA, Flickinger MC. A model of interorganelle monoclonal antibody transport and secretion in mouse hybridoma cells. Biotechnol Bioeng. 1991;38:767–780. doi: 10.1002/bit.260380711. [DOI] [PubMed] [Google Scholar]
- Brockhausen I, Kuhns W, Schachter H, Matta KL, Sutherland DR, Baker MA. Biosynthesis of O-glycans in leukocytes from normal donors and from patients with leukemia: Increase in O-glycan core 2 UDP-GlcNAc:Galb3GalNAca-R (GlcNAc to GalNAc) b(1-6)-N-acetylglucosaminyltransferase in leukemic cells. Cancer Res. 1991;51:1257–1263. [PubMed] [Google Scholar]
- Brockhausen I, Schutzbach J, Kuhns W. Glycoproteins and their relationship to human disease. Acta Anat. 1998;161:36–78. doi: 10.1159/000046450. [DOI] [PubMed] [Google Scholar]
- Campbell CT, Yarema KJ. Large-scale approaches for glycobiology. Genome Biol. 2005;6:234. doi: 10.1186/gb-2005-6-11-236. [DOI] [PMC free article] [PubMed] [Google Scholar]
- Dennis JW, Granovsky M, Warren CE. Glycoprotein glycosylation and cancer progression. Biochim Biophys Acta – General Subjects. 1999;1473:21–34. doi: 10.1016/s0304-4165(99)00167-1. [DOI] [PubMed] [Google Scholar]
- Goldberg D, Bern M, Parry S, Sutton-Smith M, Panico M, Morris HR, Dell A. Automated N-glycopeptide identification using a combination of single- and tandem-MS. J Proteome Res. 2007;6:3995–4005. doi: 10.1021/pr070239f. [DOI] [PubMed] [Google Scholar]
- Goldberg D, Sutton-Smith M, Paulson J, Dell A. Automatic annotation of matrix-assisted laserdesorption/ionization N-glycan spectra. Proteomics. 2005;5:865–875. doi: 10.1002/pmic.200401071. [DOI] [PubMed] [Google Scholar]
- Griffiths G, Fuller SD, Back R, Hollinshead M, Pfeiffer S, Simons K. The dynamic nature of the Golgi-complex. J Cell Biol. 1989;108:277–297. doi: 10.1083/jcb.108.2.277. [DOI] [PMC free article] [PubMed] [Google Scholar]
- Herscovics A. Structure and function of class I alpha 1,2-mannosidases involved in glycoprotein synthesis and endoplasmic reticulum quality control. Biochimie. 2001;83:757–762. doi: 10.1016/s0300-9084(01)01319-0. [DOI] [PubMed] [Google Scholar]
- HSL. A collection of Fortran codes for large scale scientific computation. 2002. Available at http://www.numerical.rl.ac.uk/hsl , http://hsl.rl.ac.uk/contentshslarc.html#m .
- Joshi HJ, Harrison MJ, Schulz BL, Cooper CA, Packer NH, Karlsson NG. Development of a mass fingerprinting tool forautomated interpretation of oligosaccharide fragmentation data. Proteomics. 2004;4:1650–1664. doi: 10.1002/pmic.200300784. [DOI] [PubMed] [Google Scholar]
- Kawano S, Hashimoto K, Miyama T, Goto S, Kanehisa M. Prediction of glycan structures from gene expression data based on glycosyltransferase reactions. Bioinformatics. 2005;21:3976–3982. doi: 10.1093/bioinformatics/bti666. [DOI] [PubMed] [Google Scholar]
- Krambeck FJ, Betenbaugh MJ. A mathematical model of N-linked glycosylation. Biotechnol Bioeng. 2005;92:711–728. doi: 10.1002/bit.20645. [DOI] [PubMed] [Google Scholar]
- Marquardt DW. An algorithm for least-squares estimation of nonlinear parameters. J Soc Ind Appl Math. 1963;11:431–441. [Google Scholar]
- McNaught AD. International Union of Pure and Applied Chemistry and International Union of Biochemistry and Molecular Biology – Joint Commission on Biochemical Nomenclature. Nomenclature of carbohydrates –(Recommendations 1996) Pure Appl Chem. 1996;68:1919–2008. doi: 10.1016/s0008-6215(97)83449-0. [DOI] [PubMed] [Google Scholar]
- Miyoshi E, Moriwaki K, Nakagawa T. Biological function of fucosylation in cancer biology. J Biochem. 2008;143:725–729. doi: 10.1093/jb/mvn011. [DOI] [PubMed] [Google Scholar]
- Monica TJ, Andersen DC, Goochee CF. A mathematical model of sialylation of N-linked oligosaccharides inthe trans-Golgi network. Glycobiology. 1997;7:515–521. doi: 10.1093/glycob/7.4.515. [DOI] [PubMed] [Google Scholar]
- Packer NH, von der Lieth CW, Aoki-Kinoshita KF, Lebrilla CB, Paulson JC, Raman R, Rudd P, Sasisekharan R, Taniguchi N, York WS. Frontiers in glycomics: Bioinformatics and biomarkers in disease – An NIH white paper prepared from discussions by the focus groups at a workshop on the NIH campus, Bethesda MD (September 11–13, 2006) Proteomics. 2008;8:8–20. doi: 10.1002/pmic.200700917. [DOI] [PubMed] [Google Scholar]
- Schomburg I, Chang A, Ebeling C, Gremse M, Heldt C, Huhn G, Schomburg D. BRENDA, the enzyme database: Updates and major new developments. Nucleic Acids Res. 2004;32:D431–D433. doi: 10.1093/nar/gkh081. [DOI] [PMC free article] [PubMed] [Google Scholar]
- Sell S. Cancer-associated carbohydrates identified by monoclonal antibodies. Human Pathol. 1990;21:1003–1019. doi: 10.1016/0046-8177(90)90250-9. [DOI] [PubMed] [Google Scholar]
- Spellman MW, Basa LJ, Leonard CK, Chakel JA, Oconnor JV, Wilson S, Vanhalbeek H. Carbohydrate structures of human-tissue plasminogen-activator expressed in Chinese-hamster ovary cells. J Biol Chem. 1989;264:14100–14111. [PubMed] [Google Scholar]
- Suga A, Yamanishi Y, Hashimoto K, Goto S, Kanehisa M. An improved scoring scheme for predicting glycan structures from gene expression data. Genome Inform. 2007;18:237–246. [PubMed] [Google Scholar]
- Tabas I, Kornfeld S. Purification and characterization of a rat-liver Golgi alpha-mannosidase capable of processingasparagine-linked oligosaccharides. J Biol Chem. 1979;254:1655–1663. [PubMed] [Google Scholar]
- Umana P, Bailey JE. A mathematical model of N-linked glycoform biosynthesis. Biotechnol Bioeng. 1997;55:890–908. doi: 10.1002/(SICI)1097-0290(19970920)55:6<890::AID-BIT7>3.0.CO;2-B. [DOI] [PubMed] [Google Scholar]
- Varki A, Cummings RD, Esko JD, Freeze HH, Stanley P, Bertozzi CR, Hart GW, Etzler ME. Essentials of Glycobiology. New York: Cold Spring Harbor Laboratory Press; 2008. [PubMed] [Google Scholar]
- von der Lieth CW, Lutteke T, Frank M. The role of informatics in glycobiology research with special emphasis on automatic interpretation of MS spectra. Biochim Biophys Acta – General Subjects. 2006;1760:568–577. doi: 10.1016/j.bbagen.2005.12.004. [DOI] [PubMed] [Google Scholar]
- Williams B, Cornett S, Crecelius A, Caprioli R. An algorithm for baseline correction of MALDI mass spectra; 2005. 43rd ACM Southeast Conference; March 18–20, 2005; Kennesaw, GA. [Google Scholar]
Associated Data
This section collects any data citations, data availability statements, or supplementary materials included in this article.