Abstract
Five loci for restless legs syndrome (RLS) on chromosomes 12q, 14q, 9p, 2q, and 20p (RLS1-RLS5) have been mapped in RLS families, with a recessive in the first and autosomal-dominant mode of inheritance in the latter cases. Investigations of further RLS families showed evidence for genetic locus heterogeneity. We have conducted a genome-wide linkage analysis in a large RLS family of Italian origin with 12 affected members in 3 generations using 5,861 single nucleotide polymorphisms (SNP, 6K Illumina). Linkage analysis was performed under an autosomal-dominant model with a complete penetrance, an allele frequency of 0.003 and a phenocopy rate of 0.005. The genome-wide scan resulted in suggestive evidence for linkage on chromosome 19p with maximum multipoint logarithm of the odds score of 2.61 between markers rs754292 and rs273265. The locus was replicated in a family-based association study in a set of 159 trios of European origin. This study provides evidence for a further RLS locus, thus supporting the picture of RLS as a genetically heterogenous complex trait.
Keywords: Restless legs syndrome, RLS, Linkage analysis, Locus, Genetic, Movement disorder
Introduction
Restless legs syndrome (RLS; MIM 102300) is a neurological disorder, which is diagnosed by the presence of four essential criteria consisting of: (1) an urge to move the limbs with uncomfortable sensation and (2) a worsening during rest and/or inactivity. These symptoms are typically (3) alleviated by moving the affected extremity and are, at least initially, exclusively present (4) in the evening or at night [1]. Further features supporting the diagnosis are a positive family history, a clear response to dopaminergic treatment, and the presence of periodic limb movements (PLM) during wakefulness or sleep [1]. In its fully developed form, the disease causes disturbance of sleep onset and duration.
Up to 60% of RLS patients report a positive family history [2, 3]. To date, five loci on chromosomes 12q, 14q, 9p, 2q, and 20p (RLS1-RLS5) have been identified in RLS families. The parametric linkages were based on a recessive [4] and dominant mode of inheritance in the latter cases [5–8]. RLS1 and RLS2 could be confirmed in families of French Canadian origin [9, 10] and RLS1 and RLS3 in families of German origin [11, 12]. In addition, RLS2 was replicated in a family-based association study [13]. However, several RLS families did not show linkage to any of RLS1, RLS2, and RLS3 loci, and there is evidence for further genetic locus heterogeneity in RLS [9, 11].
We have performed a genome-wide linkage analysis in a three-generation RLS family identifying a new locus for RLS on chromosome 19p and investigated this locus by an independent, family-based association study.
Materials and methods
Subjects
EU-RLS-GENE sample and family RLS_B008
EU-RLS-GENE is a study of the European RLS Study group aiming to identify the genetics of RLS by means of a multicenter design. Experts for RLS of 14 centers in 8 European countries are collecting RLS families (sib-pairs, trios, and expanded families) in a prospective manner since 2003. The subjects were investigated using a standardized clinical assessment. This consisted of a personal questionnaire-based interview to ascertain the diagnosis according to mandatory criteria and also implementing clinical description of the symptoms, e.g., age-at-onset, drug response, and severity. Polysomnographic examinations are not obligatory for the diagnosis of RLS and therefore not required for inclusion of a patient into the study. All participating research centers have acquired approval of their local ethical committee, and subjects of the study have signed an informed consent. Genomic DNA of all individuals is being centrally isolated and stored at the Institute of Human Genetics, Munich. The family B008 of Italian origin was selected from the set of pedigrees gathered within the EU-RLS-GENE project as one of three most promising to produce a significant logarithm of the odds (LOD) score when performing a genome-wide scan.
Genotyping
Genomic DNA was extracted from peripheral blood using standard protocols. A genome-wide scan was performed with the Illumina Linkage Panel IV (Illumina, 9885 Towne Center Drive, San Diego, CA, 92121–1975, USA) consisting of 5,861 single nucleotide polymorphism (SNP) markers in an average distance of 0.64 cM. All reactions were performed according to the manufacturer’s recommendations. Fluorescence signals were scanned using Illumina Bead-station. Allele calls were visually checked by an experienced scientist. According to the results of the genome-wide scan (see below), 13 additional microsatellite markers on chromosome 19p spanning 11 cM (6 Mbp) and 7 markers on chromosome 10p spanning 10 cM (3.8 Mbp; Table 1) were subsequently genotyped to confirm the SNP genotyping and narrow down the positive candidate regions obtained from the genome-wide scan. In addition, eight and seven of these evenly distributed microsatellite markers were selected on chromosomes 19p and 10p, respectively, to genotype the EU-RLS-GENE trios. Primer information was derived from GDB (GDB; www.gdb.org); the genetic distances were obtained from the Marshfield map (http://research.marshfieldclinic.org/genetics/) [14]. The physical positions were obtained from UCSC genome browser (http://genome.ucsc.edu, assembly May 2004) [15]. The polymerase chain reaction amplification products were diluted, pooled, and finally electrophoresed under denaturing conditions on an ABI 3730 sequencer. After an automatic allele calling by the Genemapper 3.5 software (Applied Biosystems, Foster City, CA, USA), every genotype was verified manually by an experienced scientist.
Table 1.
Microsatellite markers on chromosomes 19p and 10p used in association analysis
| Marker | MB | CM | Alleles | Study |
|---|---|---|---|---|
| Chromosome 19p | ||||
| D19S221 | 12573742 | 36.220 | 11 | L, A |
| D19S840 | 13701918 | 37.940 | 10 | L, A |
| D19S226 | 14494400 | 42.280 | 16 | L, A |
| D19S411 | 15763094 | 42.281 | 11 | L, A |
| D19S917 | 16222017 | 43.340 | 17 | L, A |
| D19S930 | 16829233 | 44.410 | 17 | L, A |
| D19S410 | 17258335 | 45.480 | 13 | L, A |
| D19S579 | 17437565 | 45.485 | 6 | L |
| D19S429 | 17496924 | 45.488 | 4 | L |
| D19S915 | 17778874 | 47.305 | 6 | L |
| D19S212 | 18204060 | 47.308 | 8 | L |
| D19S895 | 18614110 | 47.310 | 13 | L, A |
| D19S414 | 36606564 | 54.010 | 5 | L |
| Chromosome 10p | ||||
| D10S189 | 6761880 | 19.000 | 7 | L, A |
| D10S1691 | 7351613 | 21.460 | 16 | L, A |
| D10S1172 | 8205131 | 22.280 | 25 | L, A |
| D10S1728 | 8798238 | 27.190 | 9 | L, A |
| D10S1720 | 9114076 | 27.195 | 10 | L, A |
| D10S465 | 9324319 | 28.310 | 7 | L, A |
| D10S547 | 10590416 | 29.150 | 12 | L, A |
Markers are sorted according to their genetic positions.
MB Physical position according to the May 2004 assembly; CM genetic position from Marshfield sex-averaged map; Alleles observed number of alleles in our study; Study L linkage study, A association study
Linkage analysis
The genotypes of SNP markers were analyzed by multipoint parametric linkage test implemented in Merlin 0.10.2 [16] scoring all relationships in the pedigree. The parametric linkage analysis in the putative region was performed using GeneHunter 2.1 [17]. Simulations for the maximum expected LOD score for family B008 were calculated by the Slink package using 10,000 permutations [18, 19]. Parameters used were an allele frequency of 0.003, complete penetrance for homo- and heterozygotes, and a phenocopy rate of 0.005, thus implying an autosomal-dominant disease model in accordance with a previous segregation analysis [20]. All marker genotypes were checked for Mendelian inconsistencies using PedCheck program v1.1 [21].
Association analysis
The general approach in our family-based association study was the transmission disequilibrium test (TDT). For single markers, we used an algorithm suitable for multiallelic markers implemented in ETDT 2.5 software package [22]. Two results are produced: (1) an allele-wise and (2) a genotype-wise association (including a test for goodness-of-fit of the latter). An allele-wise statistic assumes an allele-specific effect on transmission distortion from heterozygous parents and genotype-wise statistic allows an independent effect for each parental genotype [23]. The affection status of the parents is ignored in both cases. The test is positive in the presence of both linkage and association of the marker and the disease. All resulting p values <0.05 were retested using Monte-Carlo empirical estimation by 1,000 permutations, p values <0.01 by 10,000 permutations [23]. The TDTPHASE routine of UNPHASED 2.403 package [24] was employed to generate haplotypes formed by two neighboring markers according to genetic positions, to perform the TDT, and to asses the empirical significance level by 1,000 permutations. Independently, the same haplotypes were reconstructed using GeneHunter 2.1 [17], recoded and computed also using ETDT 2.5 to make genotype-wise results available.
Sequencing
Coding regions of two candidate genes RAB3A and KCNN1 mapping within the chromosome 19p association region were sequenced in three family members of B008. Primers for exons including adjacent splice sites were designed using the program ExonPrimer (http://ihg.gsf.de). Sequencing was performed with the BigDye terminator chemistry 3.1 (ABI) on an ABI3730 sequencer. Sequencing analysis was done with the software Pregap and Gap from the Staden package [25].
Results
RLS family B008
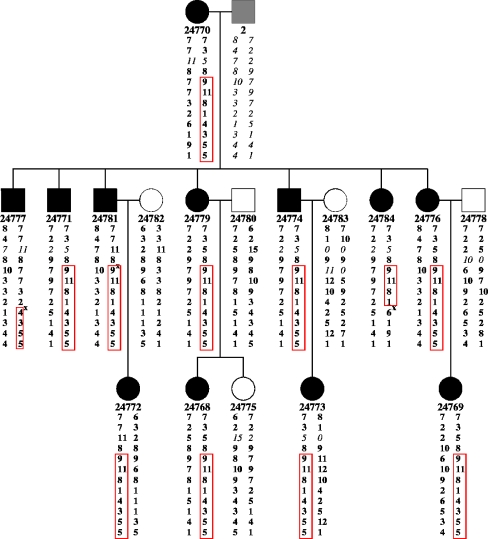
From 17 family members (11 women and 6 men; mean age, 48.7 years ± SD 13.7) in three generations DNA was available (Fig. 1). Twelve were classified as affected (8 women and 4 men; average age at onset of symptoms, 35.1 years ± SD 10.2).
Fig. 1.
Pedigree structure of family B008 and haplotype reconstruction at locus 19p13. The haplotypes correspond to microsatellite loci described in Table 1. The alleles written in bold were inferred, 0 marks unavailable alleles, x sites of recombination. Haplotypes shared by all affected patients and not present in unaffected are marked by the box. The DNA from individual “2” was not available
EU-RLS-GENE sample
Of the EU-RLS-GENE sample, 159 trios (107 women and 52 men) of 87 RLS families with a total of 362 family members were selected. Of these, 273 were RLS affected, (176 women; mean age, 48.5 years, SD ± 17.16; average age-at-onset of symptoms, 26.3 years, SD ± 14.63). The trios originated from North Europe (76, Finland), Central Europe (52, Germany, Austria, and Czech Republic), and South Europe (31, Italy and Greece).
Linkage analysis
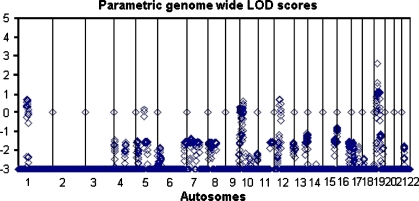
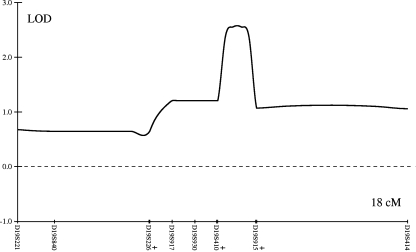
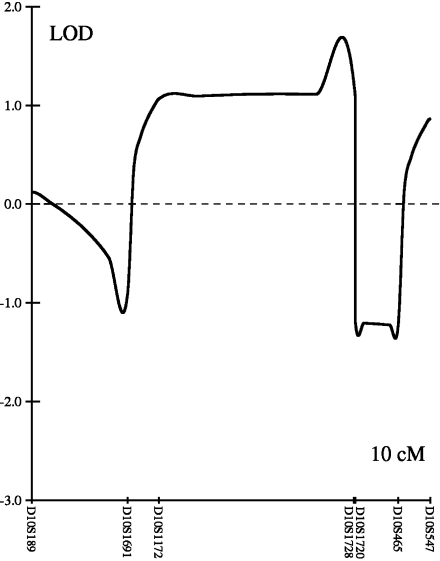
The results of the genome-wide scan in family B008 are summarized in Fig. 2. Multipoint parametric linkage analysis identified a region on chromosome 10p with a LOD score of 1.06 with a peak at marker rs1537632 and on chromosome 19p with a LOD score of 2.61 between markers rs754292 and rs273265. The maximum LOD score obtained during simulations was 2.74 under the assumption of an autosomal dominant model and multiallelic microsatellite marker. Finemapping with microsatellite markers on chromosome 10p revealed a multipoint LOD score of 1.11 at marker D10S1728. On chromosome 19p, the maximum multipoint LOD score of 2.57 was observed between markers D19S429 and D19S915, which are 1.9 cM (300 kbp) apart. The LOD score plots across these regions are shown in Figs. 3 and 4.
Fig. 2.
Results of linkage analysis–genome-wide scan in the family. The graph represents multipoint LOD scores under the autosomal dominant mode of inheritance. Each point corresponds to one SNP marker, all autosomes are represented. The LOD scores below −3 are truncated
Fig. 3.
LOD plot on chromosomes 19p. Multipoint parametric LOD score for family B008 on chromosome 19p between microsatellite markers D19S221 and D19S414. Markers D19S212 and D19S895 share the same genetic position with marker D19S915, marker D19411 with D19S226, and markers D19S579 and D19S429 with D19S410. Names of these markers are not displayed and the presenting markers are labeled with plus symbol
Fig. 4.
LOD plot on chromosomes 10p. Multipoint parametric LOD score for family B008 on chromosome 10p between microsatellite markers D10S189 and D10S547
Association analysis
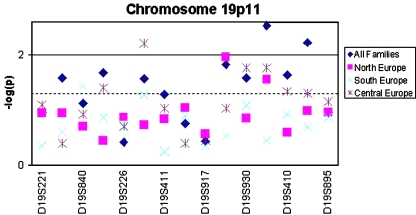
Significant associations (defined as empirical p < 0.01) were found on chromosome 19p in the entire sample of 159 trios for the two neighboring haplotypes D19S930–D19S410 and D19S410–D19S895. For the haplotype D19S930–D19S410, suggestive evidence of association (defined as empirical p < 0.05) was also detected in trio subsets of both North and Central European populations. These results are supported by suggestive associations for the two single markers D19S930 and D19S410 in the entire trio set and in the Central European subset. Another significant association with haplotype D19S226–D19S411 was found in families of Central European origin, which is supported by a suggestive association in the entire trio set.
On chromosome 10p, only one single marker (D10S1172) showed a suggestive association result in the Central European trio subset, but no marker or haplotype reached significant level for association. The significant and suggestive results for both chromosomes are summarized in Table 2. The best obtained p values across the region of chromosome 19p are displayed in Fig. 5.
Table 2.
Single marker and haplotype results of the association analysis
| Marker/haplotype | Tabular p | Empirical p | Method | Family subset |
|---|---|---|---|---|
| D19S221–D19S840 | 0.00120 | 0.0260 | TDTPHASE | All |
| D19S840–D19S226 | 0.00245 | 0.0210 | TDTPHASE | All |
| D19S226–D19S411 | 0.00139 | 0.0270 | Allele-wise | All |
| D19S917–D19S930 | 0.00222 | 0.0150 | Genotype-wise | All |
| D19S930 | 0.01128 | 0.0260 | Allele-wise | All |
| D19S930–D19S410 | 0.00147 | 0.0030 | TDTPHASE | All |
| D19S410 | 0.01955 | 0.0230 | Allele-wise | All |
| D19S410–D19S895 | 0.00012 | 0.0060 | TDTPHASE | All |
| D19S840–D19S226 | 0.00391 | 0.0400 | TDTPHASE | Central Europe |
| D19S226–D19S411 | 0.00004 | 0.0050 | Genotype-wise | Central Europe |
| D19S930 | 0.01074 | 0.0170 | Allele-wise | Central Europe |
| D19S930–D19S410 | 0.00098 | 0.0170 | Genotype-wise | Central Europe |
| D19S410 | 0.03645 | 0.0460 | Allele-wise | Central Europe |
| D19S840 | 0.01327 | 0.0370 | Genotype-wise | South Europe |
| D19S917–D19S930 | 0.00025 | 0.0110 | TDTPHASE | North Europe |
| D19S930–D19S410 | 0.00059 | 0.0280 | Genotype-wise | North Europe |
| D10S1172 | 0.00223 | 0.0117 | Genotype-wise | Central Europe |
Tabular p Significance according to the χ2 and corresponding number of degrees of freedom; Empirical p values obtained by permutation analysis; Method type of analysis which produced the p values. Allele-wise and genotype-wise refer to ETDT 2.5, TDTPHASE means that the best p value was obtained by this program; Family subset the origin of families, where the association was found; All refers to all families combined
Fig. 5.
Best p values obtained. The empirical p values are displayed as their negative decimal logarithm. Values at the marker positions correspond to single marker results; values between markers represent results observed in the corresponding haplotypes in-between
Sequencing of the genes
All 11 exons of the KCNN1 gene and all 5 exons in RAB3A were analyzed including the splice-sites. The last exons of both genes were sequenced in two overlapping segments. For all analyzed DNA regions, both strands were independently sequenced. No mutation was found within the exons of the two studied genes when comparing the three affected members of the B008 family (24770, 24774, and 24777) to the reference sequence and one negative control.
Discussion
This study provides for the first time suggestive evidence for linkage of RLS to chromosome 19p13 in an Italian RLS family using a genome-wide approach. This finding presents one further susceptibility locus for RLS, mapped within a 1.9 cM (0.3 Mbp) interval between markers D19S429 and D19S915. In addition, the linkage to chromosome 19p was confirmed in an independent European trio sample. Given the positive results of family-based association analysis, we see the replication achieved. The statistical methods and the study design used in the replication (TDT analysis) are robust to misspecification of the genetic model and also are able to accommodate commonly encountered problems in phenotypes with a high prevalence, such as intrafamilial heterogeneity and bilinearity. Considering the results of the linkage analysis, we are aware of the fact that the parametric LOD scores for chromosome 19p are below the usually adopted threshold for a Mendelian trait (i.e., a LOD > 3). However, we have not observed even a simulated result above this threshold, and the actual resulting LOD score is close to the maximal simulated value. There is a common haplotype shared by the majority of affected individuals (Fig. 5), and in the remaining two members, there is a recombination between the same two microsatellite markers. Thus, each of these two patients carries a different part of the haplotype. The putative 1.9 cM region is possibly a recombination hot-spot (as it is only 282 kbp physically long) and contains no more microsatellite markers.
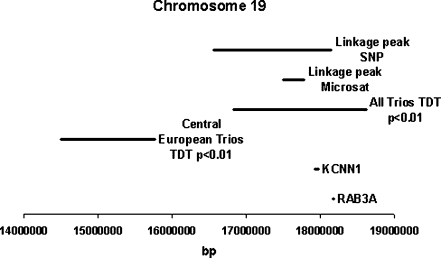
There are multiple genes annotated within the critical region. Sequencing of the two candidate genes RAB3A and KCNN1, selected on the assumed pathophysiology of RLS and location within the association region, did not identify any mutation (Fig. 6). However, variants in the promoter region or in intronic regulatory elements cannot be ruled out. RAB3A is involved in process of exocytosis of neurotransmitters [26]. RAB3A knockout mice showed abnormal regulation of circadian rhythm and sleep–wake cycle-related activity [26]. KCNN1 codes for a small conductance calcium-gated potassium channel, which regulates neuronal excitability by contributing to the slow component of synaptic after hyperpolarization [27].
Fig. 6.
Physical positions of mapping signals in the family B008. The critical region was delimited by following mapping approaches: (1) genome-wide SNP panel, (2) regional microsatellite marker fine-mapping, (3) association (TDT) and (4) sequencing of candidate genes. The lines indicate the length of chromosomal regions or genes investigated
Another strategy for the detection of genetic determinants involved in RLS pathogenesis is the genome-wide population-based association study using SNP markers. A genome-wide study in the German and Canadian population revealed association to intronic or intergenic variants in MEIS1, BTBD9, and third locus encoding LBXCOR1 and MAP2K5 [28]. A similar study in the Icelandic population showed association of periodic limb movements with BTBD9 [29]. These genes are known to be involved in embryonic development of the central nervous system.
For future identification of genetic risk variants for RLS linkage and association studies should be used as complementary strategies. The knowledge of linkage peaks can be implemented in association study designing, e.g., by lowering the threshold for replication within these regions. A further possibility could include computational methods using the knowledge of the clinical description of the disease and the putative genetic region as an input for the selection of candidate genes [30].
To summarize, we have shown evidence for a new susceptibility locus for RLS on chromosome 19p. The finding was replicated in a family-based association study. Inclusion of this locus in future analyses will increase probability for the detection of further genetic determinants of RLS.
Acknowledgments
We gratefully thank Viktoria Hozjan and Jelena Golic for their technical assistance. D.K. was supported by grant MSM0021620849. This work was partly supported by a grant from the RLS Foundation, Rochester, NC, USA. This is a study of the EU-RLS-GENE Study Group. We are grateful to all patients contributing to the study.
References
- 1.Allen RP, Picchietti D, Hening WA, Trenkwalder C, Walters AS, Montplaisir J (2003) Restless legs syndrome diagnosis and epidemiology workshop at the National Institutes of Health; International Restless Legs Syndrome Study Group, Restless legs syndrome, diagnostic criteria, special considerations, and epidemiology. A report from the restless legs syndrome diagnosis and epidemiology workshop at the National Institutes of Health. Sleep Med 4:101–119 [DOI] [PubMed]
- 2.Walters AS, Hickey K, Maltzman J, Verrico T, Joseph D, Hening W, Wilson V, Chokroverty S (1996) A questionnaire study of 138 patients with restless legs syndrome: the “Night-Walkers” survey. Neurology 46:92–95 [DOI] [PubMed]
- 3.Winkelmann J, Wetter TC, Collado-Seidel V, Gasser T, Dichgans M, Yassouridis A, Trenkwalder C (2000) Clinical characteristics and frequency of the hereditary restless legs syndrome in a population of 300 patients. Sleep 2:597–602 [PubMed]
- 4.Desautels A, Turecki G, Montplaisir J, Sequeira A, Verner A, Rouleau GA (2001) Identification of a major susceptibility locus for restless legs syndrome on chromosome 12 q. Am J Hum Genet 69:1266–1270 [DOI] [PMC free article] [PubMed]
- 5.Chen S, Ondo WG, Rao S, Li L, Chen Q, Wang Q (2004) Genomewide linkage scan identifies a novel susceptibility locus for restless legs syndrome on chromosome 9p. Am J Hum Genet 74:876–885 [DOI] [PMC free article] [PubMed]
- 6.Bonati MT, Ferini-Strambi L, Aridon P, Oldani A, Zucconi M, Casari G (2003) Autosomal dominant restless legs syndrome maps on chromosome 14q. Brain 126:1485–1492 [DOI] [PubMed]
- 7.Levchenko A, Provost S, Montplaisir JY, Xiong L, St-Onge J, Thibodeau P, Riviere JB, Desautels A, Turecki G, Dube MP, Rouleau GA (2006) A novel autosomal dominant restless legs syndrome locus maps to chromosome 20p13. Neurology 67:900–901 [DOI] [PubMed]
- 8.Pichler I, Marroni F, Beu Volpato C, Gusella JF, Klein C, Casari G, De Grandi A, Pramstaller PP (2006) Linkage analysis identifies a novel locus for restless legs syndrome on chromosome 2q in a South tyrolean population isolate. Am J Hum Genet 79:716–723 [DOI] [PMC free article] [PubMed]
- 9.Desautels A, Turecki G, Montplaisir J, Xiong L, Walters AS, Ehrenberg BL, Brisebois K, Desautels AK, Gingras Y, Johnson WG, Lugaresi E, Coccagna G, Picchietti DL, Lazzarini A, Rouleau GA (2005) Restless legs syndrome: confirmation of linkage to chromosome 12q, genetic heterogeneity, and evidence of complexity. Arch Neurol 62:591–596 [DOI] [PubMed]
- 10.Levchenko A, Montplaisir JY, Dube MP, Riviere JB, St-Onge J, Turecki G, Xiong L, Thibodeau P, Desautels A, Verlaan DJ, Rouleau GA (2004) The 14q restless legs syndrome locus in the French Canadian population. Ann Neurol 55:887–891 [DOI] [PubMed]
- 11.Winkelmann J, Lichtner P, Pütz B, Trenkwalder C, Hauk S, Meitinger T, Strom T, Muller-Myhsok B (2006) Evidence for further genetic locus heterogeneity and confirmation of RLS1 in Restless legs syndrome. Mov Disord 21:28–33 [DOI] [PubMed]
- 12.Liebetanz KM, Winkelmann J, Trenkwalder C, Putz B, Dichgans M, Gasser T, Muller-Myhsok B (2006) RLS3: fine-mapping of an autosomal dominant locus in a family with intrafamilial heterogeneity. Neurology 67:320–321 [DOI] [PubMed]
- 13.Kemlink D, Polo O, Montagna P, Provini F, Stiasny-Kolster K, Oertel W, de Weerd A, Nevsimalova S, Sonka K, Hogl B, Frauscher B, Poewe W, Trenkwalder C, Pramstaller PP, Ferini-Strambi L, Zucconi M, Konofal E, Arnulf I, Hadjigeorgiou GM, Happe S, Klein C, Hiller A, Lichtner P, Meitinger T, Muller-Myshok B, Winkelmann J (2006) Family-based association study of the restless legs syndrome loci 2 and 3 in a European population. Mov Disord 22:207–212 [DOI] [PubMed]
- 14.Broman KW, Murray JC, Sheffield VC, White RL, Weber JL (1998) Comprehensive human genetic maps: Individual and sex-specific variation in recombination. Am J Hum Genet 63:861–689 [DOI] [PMC free article] [PubMed]
- 15.International Human Genome Sequencing Consortium (2001) Initial sequencing and analysis of the human genome. Nature 40:860–921 [DOI] [PubMed]
- 16.Abecasis GR, Cherny SS, Cookson WO, Cardon LR (2002) Merlin-rapid analysis of dense genetic maps using sparse gene flow trees. Nature Genetics 30:97–101 [DOI] [PubMed]
- 17.Daly MJ, Kruglyak L, Pratt SC, Houstis N, Reeve-Daly MP, Kirby A, Lander ES (1998) GENEHUNTER 2.0—a complete linkage analysis system. Am J Hum Genet Suppl 63:A286
- 18.Weeks DE, Ott J, Lathrop GM (1990) SLINK: a general simulation program for linkage analysis. Am J Hum Genet 47(Supplement):A204
- 19.Ott J (1989) Computer-simulation methods in human linkage analysis. Proc Natl Acad Sci USA 86:4175–4178 [DOI] [PMC free article] [PubMed]
- 20.Winkelmann J, Muller-Myhsok B, Wittchen HU, Hock B, Prager M, Pfister H, Strohle A, Eisensehr I, Dichgans M, Gasser T, Trenkwalder C (2002) Complex segregation analysis of restless legs syndrome provides evidence for an autosomal dominant mode of inheritance in early age at onset families. Ann Neurol 52:297–302 [DOI] [PubMed]
- 21.O’Connell JR, Weeks DE (1998) PedCheck: a program for identification of genotype incompatibilities in linkage analysis. Am J Hum Genet 63:259–266 [DOI] [PMC free article] [PubMed]
- 22.Sham PC, Curtis D (1995) An extended transmission disequilibrium test (TDT) for multi-allele marker loci. Ann Hum Genet 59:323–336 [DOI] [PubMed]
- 23.Zhao JH, Sham PC, Curtis D (1999) A program for the Monte Carlo evaluation of significance of the extended transmission/disequilibrium test. Am J Hum Genet 64:1484–1485 [DOI] [PMC free article] [PubMed]
- 24.Dudbridge F (2003) Pedigree disequilibrium tests for multilocus haplotypes. Genet Epidemiol 25:115–221 [DOI] [PubMed]
- 25.Staden R, Judge PD, Bonfield JK (2003) Managing sequencing projects in the GAP4 environment. Introduction to bioinformatics. In: Krawetz SA, Womble DD (eds) A theoretical and practical approach. Human Press, Totawa
- 26.Kapfhamer D, Valladares O, Sun Y, Nolan PM, Rux JJ, Arnold SE, Veasey SC, Bucan M (2002) Mutations in Rab3a alter circadian period and homeostatic response to sleep loss in the mouse. Nature Genet 32:290–295 [DOI] [PubMed]
- 27.Shmukler BE, Bond CT, Wilhelm S, Bruening-Wright A, Maylie J, Adelman JP, Alper SL (2001) Structure and complex transcription pattern of the mouse SK1 K(Ca) channel gene, KCNN1. Biochim Biophys Acta 1518:36–46 [DOI] [PubMed]
- 28.Winkelmann J, Schormair B, Lichtner P, Ripke S, Xiong L, Jalilzadeh S, Fulda S, Putz B, Eckstein G, Hauk S, Trenkwalder C, Zimprich A, Stiasny-Kolster K, Oertel W, Bachmann CG, Paulus W, Peglau I, Eisensehr I, Montplaisir J, Turecki G, Rouleau G, Gieger C, Illig T, Wichmann HE, Holsboer F, Muller-Myhsok B, Meitinger T (2007) Genome-wide association study of restless legs syndrome identifies common variants in three genomic regions. Nat Genet 39:1000–1006 [DOI] [PubMed]
- 29.Stefansson H, Rye DB, Hicks A, Petursson H, Ingason A, Thorgeirsson TE, Palsson S, Sigmundsson T, Sigurdsson AP, Eiriksdottir I, Soebech E, Bliwise D, Beck JM, Rosen A, Waddy S, Trotti LM, Iranzo A, Thambisetty M, Hardarson GA, Kristjansson K, Gudmundsson LJ, Thorsteinsdottir U, Kong A, Gulcher JR, Gudbjartsson D, Stefansson K (2007) A genetic risk factor for periodic limb movements in sleep. N Engl J Med 357:639–647 [DOI] [PubMed]
- 30.Lage K, Karlberg EO, Storling ZM, Olason PI, Pedersen AG, Rigina O, Hinsby AM, Tumer Z, Pociot F, Tommerup N, Moreau Y, Brunak S (2007) A human phenome-interactome network of protein complexes implicated in genetic disorders. Nat Biotechnol 25:309–316 [DOI] [PubMed]


