

Abstract
We report the results of a meta-analysis of genome-wide association scans for multiple sclerosis (MS) susceptibility that includes 2,624 subjects with MS and 7,220 control subjects. Replication in an independent set of 2,215 subjects with MS and 2,116 control subjects validates new MS susceptibility loci at TNFRSF1A (combined P = 1.59 × 10⁻¹¹), IRF8 (P = 3.73 × 10⁻⁹) and CD6 (P = 3.79 × 10⁻⁹). TNFRSF1A harbors two independent susceptibility alleles: rs1800693 is a common variant with modest effect (odds ratio = 1.2), whereas rs4149584 is a nonsynonymous coding polymorphism of low frequency but with stronger effect (allele frequency = 0.02; odds ratio = 1.6). We also report that the susceptibility allele near IRF8, which encodes a transcription factor known to function in type I interferon signaling, is associated with higher mRNA expression of interferon-response pathway genes in subjects with MS.
Multiple sclerosis is thought to emerge when genetically susceptible individuals encounter environmental triggers and initiate an inflammatory reaction against self-antigens in the central nervous system (CNS); these events result in recurring episodes of inflammatory demyelination and, in many cases, a progressive neurodegenerative process1. The genetic architecture underlying susceptibility to MS is complex, and there are no known mendelian forms. As seen with many other inflammatory diseases, the major histocompatibility complex (MHC) has long been associated with MS, and both class I and class II susceptibility alleles exist2,3. However, a recent genome-wide association study (GWAS) revealed the existence of multiple non-MHC MS susceptibility loci of modest effect4. The role of three such loci—CLEC16A, IL2RA and IL7R—has now been well validated by other investigators and by our own replication efforts5-7. Given the success of the GWAS approach in MS, we extended earlier gene discovery efforts by pooling together data from three separate genome-wide studies exploring the genetic architecture of MS and report three newly identified susceptibility loci for MS.
RESULTS
GWAS meta-analysis and replication
We conducted a meta-analysis of genome-wide data from (i) 895 subjects with MS genotyped in the original scan by the International MS Genetic Consortium4, (ii) 969 subjects with MS scanned by the GeneMSA consortium8 and (iii) an unpublished set of data generated from 860 subjects with MS recruited at the Partners MS Center in Boston, Massachusetts. A detailed description of the component sample sets is presented in Table 1, and their clinical characteristics are outlined in Supplementary Table 1a online. As each of the studies used a different genotyping platform (Table 1), we used the phased chromosomes of HapMap samples of European ancestry (CEU)9 and the MACH algorithm (see URLs section in Online Methods)10 to impute missing autosomal SNPs with a minor allele frequency >0.01 in each of the three datasets. This effort produced a dataset containing a common panel of 2.56 million SNPs in 2,624 subjects with MS and 7,220 healthy control subjects. We then implemented a meta-analysis method that combines the association results from each of the six strata of subjects outlined in Table 1, taking into account the imputation uncertainty for each SNP (see Online Methods)11. Overall, the degree of statistical inflation was modest (genomic inflation factor λ = 1.054).
Table 1.
Sample sets used in the meta-analysis and replication studies
| Meta-analysis sample collections |
||||||||
|---|---|---|---|---|---|---|---|---|
| Stratum | IMSGC UK | IMSGC US | BWH | Gene MSA CH | Gene MSA NL | Gene MSA US | Total | |
| Number of cases | 453 | 342 | 860 | 230 | 253 | 486 | 2,624 | |
| Number of controls | 2,950a | 1,679b | 1,720c | 232d | 208d | 431d | 7,220 | |
| Genotyping platform | Affy 500K | Affy 500K | Affy 6.0 | Illumina 550 | Illumina 550 | Illumina 550 | ||
| Replication sample collections |
||||||||
| Stratum | US | UK | ||||||
| Collection | BWH | WU | ACP | UCSF | RUSH | UC | 1958 BC | Total |
| Number of cases | 228 | 152 | 597 | 407 | 0 | 831 | 0 | 2,215 |
| Number of controls | 407e | 13 | 35 | 142 | 489 | 0 | 1,030 | 2,116 |
In each pair of matched cases and controls, all subjects are genotyped using the same genome-wide platform.
Wellcome Trust Case Control Consortium–healthy control subjects.
NIMH–healthy control subjects.
MIGen study–healthy control subjects and subjects with a history of early myocardial infarction & BWH healthy control subjects.
Gene MSA–healthy control subjects recruited at the respective subject recruitment sites for this MS study.
BWH controls–these subjects of European ancestry recruited in the Boston area include (1) unaffected spouses from our MS Genetics collections (n = 14), (2) the BWH PhenoGenetic Project subjects (n = 292), and healthy subjects from the HPCGG collection (n = 101) (see Online Methods for details). These subjects do not overlap with BWH control subjects used in the meta-analysis. 1958 BC, 1958 birth cohort; ACP, Accelerated Cure Project; BWH, Brigham & Women’s Hospital; CH, Switzerland; IMSGC, International MS Genetics Consortium; NL, Netherlands; RUSH, RUSH University; UC, University of Cambridge, UK; UCSF, University California, San Francisco; UK, United Kingdom; US, United States; WU, Washington University, St. Louis.
To organize the top results of the meta-analysis, we assembled SNPs into groups that were highly correlated with one another (r2 > 0.5), selecting the SNP with the most extreme evidence of association (lowest P value) to serve as the representative tagging marker for that group. We list the top 100 independent loci with the lowest p values for association with susceptibility to MS, ranging from the CD58 locus (rs12025416, P = 4.74 × 10⁻⁸) to the 14q31.3 locus (rs2022771, P = 4.89 × 10⁻⁵) in Supplementary Table 2 online. Each locus is defined by a single tagging SNP and contains those polymorphisms that are in linkage disequilibrium (LD) with it. These 100 loci form the core of the SNP panel that was genotyped in the replication sample set (Table 1 and Supplementary Table 2). Given the preponderance of women over men among individuals affected with MS, we also conducted a secondary genome-wide regression analysis that included a term for gender and a term for subject source to account for the structure of our subject samples (see Online Methods). From this analysis, 41 of the top 50 loci with a term for gender were not redundant with known loci or loci selected by the primary analysis; thus, these 41 SNPs were also included in the replication panel.
To supplement the 141 susceptibility loci selected in an unbiased manner, we selected an additional 47 SNPs for replication using one of the following strategies (Supplementary Table 2). First, we screened all SNPs with a P < 10−3 in the meta-analysis and selected 32 loci that included candidate genes implicated in MS or pathologic inflammation according to a search of current literature. Second, we selected eight nonsynonymous coding SNPs (nscSNPs) with P < 10−3 in the meta-analysis that also had a P < 0.01 in an independent screen for nscSNPs in MS12. Finally, for reference, we included seven SNPs previously associated with MS at or near a genome-wide level of significance. The putative association of the rs10492972 marker in the KIF1B locus with MS susceptibility13 was not known at the time the replication panel was designed. As this locus did not offer evidence of association in our meta-analysis (P = 0.72), it was not included in the replication study. In all, we genotyped 188 SNPs in the replication samples from the UK and the US (Table 1 and Supplementary Table 1b), of which 180 SNPs provided high-quality data for subsequent Cochran-Mantel-Haenszel analysis as well as a joint analysis of the replication and meta-analysis results (Supplementary Table 3 online). The relative success of each of our SNP selection strategies is reported in Supplementary Table 3. We note that we do not have genome-wide estimates of ancestry for the subjects in the replication study, and therefore we cannot assess the level of population stratification that may exist within the separate UK and US strata of the replication samples.
Among the 180 SNPs that met quality-control criteria, we observed an excess of associations in the replication stage that was consistent with the direction of effect observed in the meta-analysis (Fig. 1). In Table 2, we present the top results of the replication analysis and the combined evidence for association of these loci. The known MHC class I and class II associations were detected in the replication samples: rs3135388 is the surrogate marker for the HLA DRB1*1501 risk allele and rs2523393 is a surrogate marker for the HLA B*4402 allele (Table 2 and Online Methods)14. Consistent with previous findings, the associations of HLA B*4402 and HLA DRB1*1501 were independent (Supplementary Table 4 online).
Figure 1.
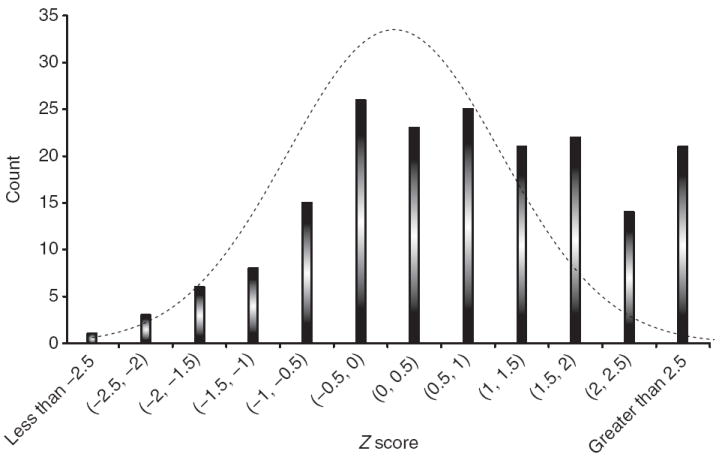
Enrichment of associations in the replication stage that are consistent with the meta-analysis. Plot shows a histogram of the absolute values of the replication study Z scores from the 180 SNPs included in the replication analysis (see Supplementary Table 3 for detailed results). In this case, the direction of the association reflects consistency with the results of the meta-analysis: a positive Z score is in the same direction in both the meta-analysis and the replication analysis while a negative Z score highlights the fact that the two analyses are discordant. An excess of concordant, highly significant associations is noted. A null distribution is plotted to highlight this enrichment.
Table 2.
Results of the replication and combined analysis
| Replication study |
||||||||||||||
|---|---|---|---|---|---|---|---|---|---|---|---|---|---|---|
| Chr | SNP | A1 | A2 | BP | χ2 | MAF_US | MAF_UK | OR | L95 | U95 | Preplication | Pmeta | PJoint | Locus |
| Previously published MS loci | ||||||||||||||
| 6 | rs3135388 | A | G | 32521029 | 335.10 | 0.22 | 0.21 | 2.75 | 2.46 | 3.07 | 7.35 × 10−75 | 7.44 × 10−164 | 3.80 × 10−225 | HLA-DRB1 |
| 6 | rs2523393 | G | A | 29813638 | 30.55 | 0.41 | 0.41 | 0.78 | 0.72 | 0.85 | 3.26 × 10⁻⁸ | 3.36 × 10⁻¹¹ | 1.04 × 10⁻¹⁷ | HLA-B |
| 1 | rs2300747 | G | A | 116905738 | 14.31 | 0.12 | 0.11 | 0.77 | 0.68 | 0.88 | 1.55 × 10⁻⁴ | 2.44 × 10⁻⁷ | 3.10 × 10⁻¹⁰ | CD58 |
| 10 | rs2104286 | C | T | 6139051 | 7.87 | 0.24 | 0.25 | 0.87 | 0.79 | 0.96 | 0.0050 | 1.52 × 10⁻⁶ | 9.33 × 10⁻⁸ | IL2RA |
| 16 | rs11865121 | A | C | 11074189 | 8.42 | 0.31 | 0.29 | 0.87 | 0.80 | 0.96 | 0.0037 | 1.30 × 10⁻⁵ | 1.77 × 10⁻⁷ | CLEC16A |
| 5 | rs6897932 | T | C | 35910332 | 5.60 | 0.25 | 0.27 | 0.89 | 0.81 | 0.98 | 0.0180 | 7.71 × 10⁻⁶ | 1.67 × 10⁻⁶ | IL7R |
| Newly identified loci with genome-wide level of evidence | ||||||||||||||
| 12 | rs1800693 | C | T | 6310270 | 17.57 | 0.45 | 0.42 | 1.20 | 1.10 | 1.31 | 2.77 × 10⁻⁵ | 7.52 × 10⁻⁸ | 1.59 × 10⁻¹¹ | TNFRSF1A |
| 12 | rs4149584 | T | C | 6312904 | 8.20 | 0.022 | 0.018 | 1.58 | 1.15 | 2.17 | 0.0042 | 0.00035 | 5.25 × 10⁻⁶ | TNFRSF1Aa |
| 16 | rs17445836 | A | G | 84575164 | 17.40 | 0.19 | 0.22 | 0.80 | 0.72 | 0.89 | 3.03 × 10⁻⁵ | 3.05 × 10⁻⁵ | 3.73 × 10⁻⁹ | IRF8 |
| 11 | rs17824933 | G | C | 60517188 | 10.39 | 0.25 | 0.23 | 1.18 | 1.07 | 1.30 | 0.0013 | 2.32 × 10⁻⁷ | 3.79 × 10⁻⁹ | CD6 |
| Newly identified loci with suggestive evidence | ||||||||||||||
| 2 | rs882300 | T | C | 136692725 | 15.75 | 0.39 | 0.46 | 0.84 | 0.77 | 0.92 | 0.000517 | 7.23 × 10⁻⁵ | 1.37 × 10⁻⁷ | CXCR4 |
| 5 | rs6896969 | A | C | 40460183 | 4.58 | 0.38 | 0.40 | 0.91 | 0.83 | 0.99 | 0.0324 | 1.44 × 10⁻⁷ | 2.40 × 10⁻⁷ | PTGER4b |
| 12 | rs1790100 | G | T | 122222678 | 3.86 | 0.24 | 0.22 | 1.11 | 1.00 | 1.22 | 0.0495 | 2.74 × 10⁻⁷ | 7.21 × 10⁻⁷ | MPHOSPH9 |
| 10 | rs1250540 | G | A | 80706013 | 5.91 | 0.35 | 0.40 | 1.12 | 1.02 | 1.22 | 0.0151 | 9.89 × 10⁻⁶ | 1.59 × 10⁻⁶ | ZMIZ1 |
| 3 | rs4680534 | C | T | 161181639 | 6.18 | 0.37 | 0.36 | 1.12 | 1.02 | 1.22 | 0.0129 | 6.80 × 10⁻⁶ | 5.58 × 10⁻⁶ | IL12Ab |
| 1 | rs2760524 | A | G | 190797171 | 5.88 | 0.16 | 0.17 | 0.87 | 0.77 | 0.97 | 0.0153 | 1.07 × 10⁻⁴ | 9.77 × 10⁻⁶ | RGS1b |
| 6 | rs9321619 | G | A | 137916101 | 7.78 | 0.47 | 0.46 | 0.89 | 0.81 | 0.96 | 0.0053 | 9.34 × 10⁻⁴ | 1.71 × 10⁻⁵ | OLIG3-TNFAIP3b |
The rs4149584 nonsynonymous coding SNP was genotyped after the replication effort was concluded; given the result at rs1800693 and suggestive evidence of association at rs4149584 in the meta-analysis, we genotyped rs4149584 separately in the replication sample set. The two SNPs have independent effects on MS susceptibility (Supplementary Table 4).
These loci have previously validated associations with other inflammatory diseases at a genome-wide level of significance: PTGER4, Crohn’s disease; IL12A and RGS1, celiac disease; OLIG3-TNFAIP3, psoriasis, rheumatoid arthritis and systemic lupus erythematosus. MS association results for the associated SNP in another disease are reported in Supplementary Table 5. A1, minor allele; A2, major allele; BP, physical location of the SNP in build 36; MAF, minor allele frequency in US and UK strata; L95/U95, lower and upper bounds of the 95% confidence interval for the OR. At each locus, the OR is stated relative to the minor allele. Here, we list all loci with evidence of genome-wide significance (P < 5 × 10⁻⁸) as well as loci with suggestive results, which are defined as either (i) a joint P < 1 × 10⁻⁶ or (ii) a joint P < 1 × 10⁻⁴ and evidence of association to another inflammatory disease.
Outside the MHC, the previously validated associations with the CLEC16A, IL2RA and IL7R loci were observed (Table 2), and we now validate the CD58 locus at a level of genome-wide significance (P = 3.10 × 10⁻¹⁰) (Table 2). The best CD58 marker, rs2300747, was identified in earlier fine-mapping exercises in this locus15 and is in strong linkage disequilibrium (LD) (r2 = 0.73 in HapMap CEU samples) with the CD58 marker selected from the meta-analysis, rs12025416 (P = 1.16 × 10⁻⁹) (Supplementary Table 3). Logistic regression revealed no evidence of an independent effect at rs12025416 in the replication samples (Supplementary Table 4). Thus, we see no evidence for allelic heterogeneity at the CD58 locus in our data, and our previously identified CD58 SNP (rs2300747) remains the best marker of a susceptibility allele within the CD58 locus.
In the replication data, we found strong evidence for the presence of three previously unreported associations with genome-wide significance (P < 5 × 10⁻⁸) in the joint analysis: they are located in the TNFRSF1A (rs1800693, P = 1.59 × 10⁻¹¹), IRF8 (rs17445836, P = 3.73 × 10⁻⁹) and CD6 (rs17824933, P = 3.79 × 10⁻⁹) loci. All three loci were selected for replication in an unbiased manner on the basis of the results of the meta-analysis (Supplementary Table 2). The rs1800693[T] allele associated with increased risk of MS (odds ratio (OR) = 1.20, 95% confidence interval (CI) = 1.10–1.31, in the replication stage) is found within the sixth intron of TNFRSF1A, and thus we refer to this region as the TNFRSF1A locus. Another gene, PLEKHG6, is found within the block of LD that contains rs1800693, so, formally, either or both genes could be associated with MS susceptibility (Fig. 2a). However, none of the SNPs that are in LD with rs1800693 are located within the PLEKHG6 gene region (Fig. 2a); future fine-mapping efforts and follow-up studies will be needed to definitively resolve the functional basis of this association. Nonetheless, current literature supports a role for TNFRSF1A, as it has previously been implicated in tumor necrosis factor–associated periodic syndrome (TRAPS). This rare syndrome consists of recurrent episodes of systemic inflammation with variable symptoms including fever, abdominal pain, myalgia, arthralgia, exanthema and ocular involvement16, and many affected individuals have been shown to have one of over 57 coding or noncoding mutations in TNFRSF1A (see URLs section in Online Methods). Most of these alleles are rare variants found in certain pedigrees, but a few less-penetrant alleles are segregating in European populations at < 0.05 frequency17,18. Notably, a number of subjects with demyelinating or demyelinating-like diseases have been recently reported to harbor such variants (such as the R92Q substitution), but the slight excess in the proportion of these polymorphisms in MS subjects was not significant16,19,20. In our meta-analysis, only the R92Q polymorphism (rs4149584, labeled R121Q in dbSNP) has been analyzed. It has substantial evidence of association with MS susceptibility in the meta-analysis (P = 0.0003) as well as the replication effort (P = 0.0042), and it is not in LD with rs1800693 (r2 = 0.041 in HapMap CEU samples), the common TNFRSF1A variant identified in our study (Table 2). Conditional analysis suggests that the two SNPs represent independent associations (Supplementary Table 4). Although a detailed investigation of common and rare variants in this locus is necessary to fully characterize MS-related effects, our study provides the first definitive link between the TNFRSF1A locus and susceptibility to demyelinating disease at both a high-frequency polymorphism of modest effect (rs1800693) and a low-frequency polymorphism of stronger effect (rs4149584). Altogether, rs1800693[T] and rs4149584[T] are excellent candidate risk alleles for other inflammatory diseases, particularly those with rheumatologic features.
Figure 2.

Three previously unidentified loci, TNFRSF1A, IRF8 and CD6, with genome-wide level of evidence of association to MS. (a) Illustration of the TNFRSF1A locus, with the local recombination rate plotted in light blue over this 200-kb chromosomal segment centered on rs1800693. Each diamond represents one SNP found in this locus, and the most associated SNP in the meta-analysis, rs1800693, is marked by a red diamond. A blue diamond is used to represent the level of evidence associated with rs1800693 in the joint analysis that includes the replication data. The color of each circle is defined by the extent of LD with rs1800693: red (r2 > 0.8), orange (0.8 > r2 > 0.5), gray (0.5 > r2 > 0.3) and white (r2 > 0.3). Physical positions are based on build 36 of the human genome. rs1800693 is located in an intron of TNFRSF1A. (b) Illustration of the IRF8 locus, with the most associated SNP in this locus, rs17445836, highlighted by red (meta-analysis result) and blue (joint analysis result) diamonds. Here, we also present all SNPs found within a 200-kb window centered on rs17445836 and define SNP colors based on LD to rs17445836. (c) Illustration of the CD6 locus, with the most associated SNP in this locus, rs17824933, highlighted by red (meta-analysis result) and blue (joint analysis result) diamonds. Here, we also present all SNPs found within a 200-kb window centered on rs17824933 and define SNP colors based on LD to rs17824933. In this case, CD6 is the only gene found in the large block of LD that contains the association to MS susceptibility. Linkage disequilibrium maps are presented for all three loci in Supplementary Figure 1a–c online.
The association of rs17445836[A] (OR = 0.80, 95% CI = 0.72–0.89) is also new and is found in a region of elevated recombination rate and lower LD (Fig. 2b). On the centromeric side, this SNP is located within 61 kb of IRF8 (interferon response factor 8; also known as interferon consensus sequence binding protein 1, ICSBP1), and we therefore refer to this association as being in the IRF8 locus because the closest telomeric gene, FOXF1, is 526 kb away. As its name implies, IRF8 is one of the several transcription factors that regulate responses to type I interferons (α and β interferons) by binding the interferon-stimulated response element (ISRE) (MIM601565). It has many roles that include involvement in B-cell germinal center development as well as macrophage cell function21,22.
The third locus contains the rs17824933[G] susceptibility allele (OR = 1.18, 95% CI = 1.07–1.30) and is bounded by two peaks of recombination (Fig. 2c) between which only one gene, CD6, is found. The excess of extreme results with modest LD (0.8 > r2 > 0.5) to rs17824933 at the telomeric end of the block of LD suggests that there may be an independent association within this locus. CD6, like CD58, is a molecule involved in T-cell costimulation and differentiation23,24; it may therefore have a role in modulating the activation and proliferation of T cells in the context of an inflammatory disease. In fact, these properties led to its targeting with a blocking monoclonal antibody in a clinical trial treating individuals with MS25. Finally, the soluble form of CD6 may also function as a pattern recognition receptor and affects the serum level of TNFα in this context in mice26. Thus, the rs17824933[G] susceptibility allele found in the first intron of CD6 may have functional repercussions that interact with those of the TNFRSF1A locus.
Four other loci with P < 10−4 in our joint analysis (Table 2) have previously validated associations with other inflammatory diseases and are therefore likely to be true MS susceptibility loci: IL12A, OLIG3-TNFAIP3, PTGER4 and RGS1. The putative IL12A and RGS1 MS susceptibility alleles are in strong LD with known celiac disease susceptibility alleles27, as is the PTGER4 MS allele and the known Crohn’s disease allele28 in this locus (Supplementary Table 5a online). On the other hand, the signal of association within the OLIG3-TNFAIP3 locus seems to be distinct from known associations to psoriasis, rheumatoid arthritis (RA) and systemic lupus erythematosus (SLE) (Supplementary Table 5a)29-32. Given the discovery of these strong candidate MS loci, we extended this comparative analysis to a larger number of loci by comparing our list of 100 top MS loci selected for replication (Supplementary Table 2) to the list of 76 Crohn’s disease loci in which replication was attempted28. We found seven loci with substantial evidence of association in both diseases: these include not only loci with a validated role in one disease (IL12B and PTGER4 in Crohn’s disease as well as IRF8 in MS) but also loci with suggested roles in both diseases (BCL2, NEDD4L, PPA2 and STAT3; Supplementary Table 5b).
Expression studies
Given the newly discovered association to the IRF8 locus that contains an important transcription factor involved in responses to type I interferons, we explored its possible functional consequences by investigating a set of RNA data (Affymetrix U133 2.0 array) captured from the peripheral blood mononuclear cells (PBMCs) of 240 subjects of European ancestry with either remitting-relapsing MS (RRMS, n = 230) or a clinically isolated demyelinating syndrome (CIS, n = 10), many of which go on to develop MS (Supplementary Table 1c). These subjects can be classified into three categories: untreated subjects (n = 82), interferon β (IFNβ)-treated subjects (n = 94) and glatiramer acetate (GA)-treated subjects (n = 64). We used an unbiased approach to assess these data for the hypothesis that the IRF8 locus may have a modest but broad effect on RNA expression from genes involved in interferon response. Specifically, we applied a gene set enrichment analysis (GSEA) methodology33 to explore the results of a quantitative trait (eQTL) analysis correlating rs17445836 with our genome-wide RNA expression data from subjects with MS and CIS. As IRF8 is known to be an interferon-response gene, its function could be affected either by IFNβ treatment or by GA treatment, which is reported to suppress IFNβ expression (S. Zamvil, University of California, San Francisco, personal communication). Thus, we pursued this GSEA screen of RNA data separately in each of our three subject subsets (untreated, IFNβ-treated and GA-treated). Sixteen gene sets that meet our threshold of significance (an FDR q value < 0.05) have genes that are coordinately upregulated in the presence of the rs17445836[G] allele in both the untreated and the IFNβ-treated subject subsets. Specifically, each of the 16 shared gene sets contain genes whose expression is coordinately enhanced under an additive model for rs17445836[G] association. In Table 3, we present the most associated of these 16 gene sets, that is, those gene sets that have an FDR q value < 0.001 in both sets of subjects. All eight of these most associated gene sets are primarily defined as being interferon-responding or are known to contain responses to type I interferons. Detailed results of each analysis are presented in Supplementary Table 6a,b online. Upregulation of interferon pathway genes in peripheral blood has previously been noted in ~50% of untreated subjects with MS34,35, so the overlap between the untreated and IFNβ-treated subsets suggests that these results are consistent with our current knowledge of pathophysiology in MS. The lack of replication of the results of the untreated group in the GA-treated group is intriguing; it could be due to the smaller size of this subject subset (n = 64) and/or the suppression of IFNβ expression by GA. Further validation experiments in these subject subsets are needed to confirm our observations and explore the interactions of these MS treatments with the effect of the rs17445836[G] allele.
Table 3.
Gene set enrichment analysis pathways with coordinated RNA expression relative to the IRF8 rs17445836[G] susceptibility allele
| Untreated |
IFNβ-treated |
|||||
|---|---|---|---|---|---|---|
| Gene set | Size | NES | FDR q | Size | NES | FDR q |
| TAKEDA_NUP8_HOXA9_10D_UP | 27 | 2.8 | <10−4 | 20 | 3.0 | <10−4 |
| TAKEDA_NUP8_HOXA9_16D_UP | 19 | 2.7 | <10−4 | 15 | 2.8 | <10−4 |
| TAKEDA_NUP8_HOXA9_3D_UP | 29 | 2.7 | <10−4 | 30 | 3.0 | <10−4 |
| TAKEDA_NUP8_HOXA9_8D_UP | 24 | 2.7 | <10−4 | 18 | 2.8 | <10−4 |
| IFNA_HCMV_6HRS_UP | 21 | 2.3 | <10−4 | 15 | 2.5 | <10−4 |
| RADAEVA_IFNA_UP | 16 | 2.2 | <10−4 | 17 | 2.8 | <10−4 |
| DER_IFNΒ_UP | 17 | 2.2 | 5 × 10⁻⁴ | 20 | 2.4 | 1 × 10⁻⁴ |
| REOVIRUS_HEK293_UP | 23 | 2.1 | 7 × 10⁻⁴ | 29 | 2.7 | <10−4 |
This table presents only those gene sets with an FDR q value < 0.001 in both the analysis of untreated subjects and that of IFNβ-treated subjects. When the analysis was repeated after excluding the ten subjects who had a diagnosis of CIS at the time of sampling, the same results are returned. “Size” reports the number of genes that are coordinately regulated within each gene set; “NES” is the “normalized enrichment score,” an outcome parameter of the gene set enrichment method; “FDR q-val” reports a measure of significance corrected for the number of gene sets tested. Of note, the gene sets with a “TAKEDA” prefix are defined as sets of genes upregulated after transformation of CD34+ hematopoietic cells with the NUP98/HOXA9 fusion protein that is found in certain translocations associated with myelodysplastic syndromes and acute myeloid leukemia. This fusion protein is known to strongly upregulate interferon β expression and, hence, interferon response pathways. Supplementary Tables 6a and 6b present the detailed results of our analyses.
To control for potential bias in our analysis method, we repeated this investigation of the quantitative trait analysis results using the Ingenuity Pathways Analysis software suite (see URLs section in Online Methods). Here, using the same set of quantitative trait analysis results, we find significant co-regulation, relative to the rs17445836[G] allele, of genes within Ingenuity Systems’ predefined “canonical interferon signaling pathway” among both untreated subjects (P = 0.001) and IFNβ-treated subjects (P = 0.01) (Fig. 3). The GA-treated subjects do not have a significant co-regulation of genes in this pathway. We have also repeated the GSEA and Ingenuity analyses using the best markers for MS susceptibility in the CD6, CD58 and TNFRSF1A loci that were validated in this meta-analysis; none of these three loci show significant co-regulation within the interferon pathway (data not shown) relative to the best susceptibility marker in each locus. In addition, we examined a publicly available dataset generated from a different cell type (EBV-transformed B cells) for the effect of the rs17445836[G] susceptibility allele on interferon response but did not observe this association in the small sample of HapMap cell lines of European ancestry (data not shown)36. Our data therefore suggest that both at baseline and during chronic exposure to exogenous INFβ the rs17445836[G] susceptibility allele may have a widespread but specific effect on gene expression in PBMC from subjects with MS, particularly within the interferon response pathway in which IRF8 is known to function (Fig. 3).
Figure 3.
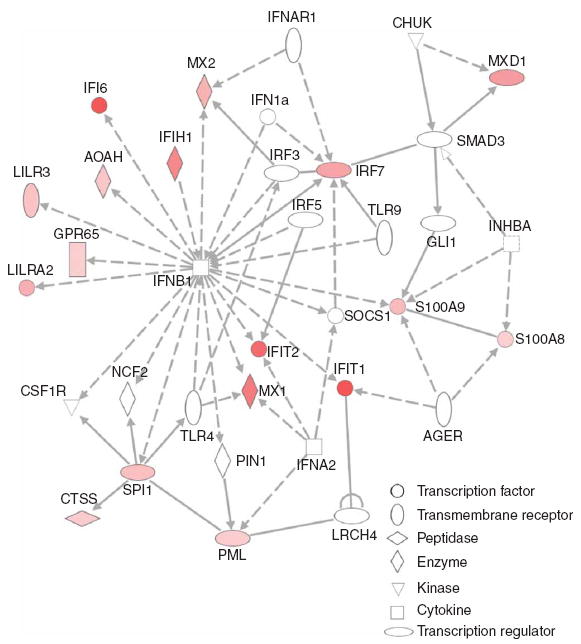
Interferon response genes are coordinately upregulated relative to the rs17445836[G] allele of IRF8. Using the Ingenuity Pathways Analysis software suite, we illustrate the network of genes in the “interferon signaling pathway” whose expression is found to be correlated with the rs17445836[G] allele in untreated MS subjects. The diagram highlights those genes in this pathway whose expression are upregulated (red) in the presence of the rs17445836[G] allele. The magnitude of each gene’s association is reflected by the intensity of the color, with brighter red indicating a stronger correlation between rs17445836[G] and RNA expression. A white color denotes a gene found in the associated pathway but which failed to meet a nominal P < 0.05 threshold for association of its RNA expression with rs17445836[G]. The shapes of each gene symbol denote the class of that gene as defined by the Ingenuity Pathways application: horizontal oval, transcription regulator; vertical oval, transmembrane receptor; rectangle, G protein–coupled receptor; horizontal diamond, peptidase; vertical diamond, enzyme; triangle, kinase; square, cytokine; circle, other.
Only one probe in our RNA dataset provided information on the IRF8 gene itself, and this probe shows no evidence of correlation between rs17445836[G] and IRF8 expression. Thus, the mechanism by which rs17445836[G] influences gene expression remains unknown at this time, and more comprehensive studies of the expression of IRF8 and its RNA isoforms in specific cell populations are needed to address this question.
DISCUSSION
Our current data suggest that dysregulation of interferon responses may be one of the early events that contribute to the onset of MS. Upregulation of interferon responses has been noted not only in a subset of MS subjects34,35, but also in subjects with other inflammatory diseases (dermatomyositis37, rheumatoid arthritis and SLE38,39), and may reflect a shared feature of autoimmunity. However, the role of interferons in the onset of MS remains to be better defined. In addition, other pathways may also be affected by the IRF8 variant, such as a gene set defined in response to TNFα stimulation that is coordinately upregulated in untreated MS subjects with the rs17445836[G] allele of IRF8 (FDR q value < 10−4, Supplementary Table 6a). This observation suggests a link between the functional consequences of the IRF8 locus and those of the newly identified TNFRSF1A locus.
The possible role of the TNFRSF1A alleles in multiple sclerosis is informed by functional data from human studies. The TNFα pathway is implicated in MS susceptibility as a result of observations from human clinical data: treatment with monoclonal antibodies to TNFα may trigger acute episodes of CNS inflammation in subjects with MS40. A phase II clinical trial with a TNFRSF1A:IgG1 fusion protein (lenercept) also reported increased clinical attacks, although these occurred in the absence of enhanced disease activity on magnetic-resonance imaging and disability41. Furthermore, demyelinating lesions are a possible adverse event in subjects with Crohn’s disease or rheumatoid arthritis treated with monoclonal antibodies to TNFα42. Thus, genetic and functional data now merge and suggest that dysregulation of the TNFα pathway has a role in the onset of MS, with diminished TNFα activity being associated with onset of CNS inflammatory lesions in clinical data. The suggested association of the OLIG3-TNFAIP3 locus fits within this theme, as may the association of CD6: soluble CD6 may function as a pattern recognition receptor and influence circulating levels of TNFα26. With its observations relating to responses to class I interferons and TNFα, this study focuses our attention on dysregulation within the innate immune system in MS susceptibility. Dysfunction of the innate immune system, an important first line of defense against pathogens, has long been noted in immunopathology studies of MS. This history has contributed to the longstanding hypothesis of a viral or microbial trigger for MS, with the best evidence residing with the Epstein Barr Virus (EBV), and we must now consider our new associations in the context of such environmental risk factors43.
Given the nearly 3:1 preponderance of women in all of our cohorts, we also need to better understand the impact of gender on MS susceptibility. Our secondary analysis that includes a term for gender was conducted for this reason and was successful in highlighting the role of the CXCR4 locus (P = 1.37 × 10⁻⁷) (Supplementary Table 3). Although this locus was selected for replication on the basis of the secondary gender analysis, it showed strong evidence of replication in our primary replication analysis without a term for gender. The results of the secondary analysis of the replication data that includes gender as a covariate are shown in Supplementary Table 7 online. The top results of this analysis generally mirror those of the primary replication analysis.
Overall, most validated and strongly suggested MS susceptibility loci (CD6, CD58, CLEC16A, HLA-B, HLA-DRB1, IRF8, IL2RA, IL7R, IL12A, OLIG3-TNFAIP3, PTGER4, RGS1 and TNFRSF1A) have well-known and primarily immunologic functions. This is particularly true for our newly validated loci (CD6, IRF8 and TNFRSF1A) that were selected for replication in an unbiased manner. In addition, many of these MS susceptibility loci have validated roles in other inflammatory diseases. Thus, we inform the ongoing debate of the relative roles of neurodegeneration and inflammation in the onset of MS by reporting a preponderance of current genetic evidence in favor of early immune dysregulation that may trigger secondary neurodegenerative processes. A definitive evaluation of this question awaits a more complete map of genetic susceptibility factors and a more comprehensive understanding of the functions of the associated genes in different cell types. This search for further susceptibility loci is also guided by the important observation that a less common variant (frequency of ~2% in European populations) of stronger effect has now been associated with susceptibility to MS in the TNFRSF1A locus. This suggests that future investigations of complex traits in MS will have to target this class of low-frequency alleles, which are typically only poorly interrogated by the current set of genome-wide SNP genotyping platforms.
METHODS
Methods and any associated references are available in the online version of the paper at http://www.nature.com/naturegenetics/.
Supplementary Material
Acknowledgments
P.L.D. is a Harry Weaver Neuroscience Scholar Award of the National MS Society (NMSS); he is also a William C. Fowler Scholar in Multiple Sclerosis Research and is supported by a National Institute of Neurological Disorders and Stroke (NINDS) K08 grant, NS46341. D.A.H. is a Jacob Javits Scholar of the US National Institutes of Health; he is also supported by NINDS P01 AI039671, R01 NS049477, R01NS046630, NMSS Collaborative MS Research Award and NMSS RG3567A. The International MS Genetics Consortium is supported by R01NS049477. L.P. is supported by an NMSS fellowship grant (FG1665-A-1). The genome-wide data on the BWH subjects and the RNA data on MS and CIS subjects from the CLIMB study were generated as part of a collaboration with Affymetrix, Inc. We thank the Myocardial Infarction Genetics Consortium (MIGen) study for the use of their genotype data as control data in our study. The MIGen study was funded by the US National Institutes of Health and National Heart, Lung, and Blood Institute’s STAMPEED genomics research program and a grant from the National Center for Research Resources. We acknowledge use of genotype data from the British 1958 Birth Cohort DNA collection, funded by the Medical Research Council grant G0000934 and the Wellcome Trust grant 068545/Z/02. We thank R. Lincoln and R. Gomez for expert specimen management at UCSF as well as A. Santaniello for database management. We thank the Accelerated Cure Project for its work in collecting samples from subjects with MS and for making these samples available to MS investigators. We also thank the following clinicians for contributing to sample collection efforts: Accelerated Cure project, E. Frohman, B. Greenberg, P. Riskind, S. Sadiq, B. Thrower and T. Vollmer; Washington University, B.J. Parks and R.T. Naismith. Finally, we thank the Brigham & Women’s Hospital PhenoGenetic Project for providing DNA samples from healthy subjects that were used in the replication effort of this study.
Footnotes
AUTHOR CONTRIBUTIONS P.L.D., D.A.H., S.L.H., P.M.M. and J.R.O. designed the study. P.L.D. and J.R.O. wrote the manuscript. P.I.W.d.B., P.L.D., S.R., M.J.D., D.T., J.W., S.E.B. and X.J. performed analytical work. P.I.W.d.B., X.J. and M.J.D. developed the meta-analysis method while S.R. developed the subject matching algorithm. L.O. and P.L.D. performed the quality control analysis and quantitative trait analysis of the RNA from MS PBMC samples. C.A. generated and processed genotype data for analysis. P.L.D., N.T.A., L.P., R.B., R.A.G., P.M.M., Y.N., L.K., B.U., C.P., W.L.M., D.P.S., D.E., A.H.C., A.C., S.J.S., H.L.W., S.L.H., J.R.O. and D.A.H. contributed to DNA sample collection and genetic data. J.L.M., M.A.P.-V. and J.L.H. contributed to the interpretation of the results. All authors have read and contributed to the manuscript.
Note: Supplementary information is available on the Nature Genetics website.
Reprints and permissions information is available online at http://npg.nature.com/reprintsandpermissions/
References
- 1.Hauser SL, Oksenberg JR. The neurobiology of multiple sclerosis: genes, inflammation, and neurodegeneration. Neuron. 2006;52:61–76. doi: 10.1016/j.neuron.2006.09.011. [DOI] [PubMed] [Google Scholar]
- 2.Barcellos LF, et al. Heterogeneity at the HLA-DRB1 locus and risk for multiple sclerosis. Hum Mol Genet. 2006;15:2813–2824. doi: 10.1093/hmg/ddl223. [DOI] [PubMed] [Google Scholar]
- 3.Yeo TW, et al. A second major histocompatibility complex susceptibility locus for multiple sclerosis. Ann Neurol. 2007;61:228–236. doi: 10.1002/ana.21063. [DOI] [PMC free article] [PubMed] [Google Scholar]
- 4.Hafler DA, et al. Risk alleles for multiple sclerosis identified by a genomewide study. N Engl J Med. 2007;357:851–862. doi: 10.1056/NEJMoa073493. [DOI] [PubMed] [Google Scholar]
- 5.Rubio JP, et al. Replication of KIAA0350, IL2RA, RPL5 and CD58 as multiple sclerosis susceptibility genes in Australians. Genes Immun. 2008;9:624–630. doi: 10.1038/gene.2008.59. [DOI] [PubMed] [Google Scholar]
- 6.International Multiple Sclerosis Genetics Consortium. Refining genetic associations in multiple sclerosis. Lancet Neurol. 2008;7:567–569. doi: 10.1016/S1474-4422(08)70122-4. [DOI] [PMC free article] [PubMed] [Google Scholar]
- 7.Ramagopalan SV, Anderson C, Sadovnick AD, Ebers GC. Genomewide study of multiple sclerosis. N Engl J Med. 2007;357:2199–2200. doi: 10.1056/NEJMc072836. [DOI] [PubMed] [Google Scholar]
- 8.Baranzini SE, et al. Genome-wide association analysis of susceptibility and clinical phenotype in multiple sclerosis. Hum Mol Genet. 2009;18:767–778. doi: 10.1093/hmg/ddn388. [DOI] [PMC free article] [PubMed] [Google Scholar]
- 9.Frazer KA, et al. A second generation human haplotype map of over 3.1 million SNPs. Nature. 2007;449:851–861. doi: 10.1038/nature06258. [DOI] [PMC free article] [PubMed] [Google Scholar]
- 10.Li Y, Abecasis GR. Rapid haplotype reconstruction and missing genotype inference. Am J Hum Genet. 2006;S79:2290. [Google Scholar]
- 11.de Bakker PI, et al. Practical aspects of imputation-driven meta-analysis of genome-wide association studies. Hum Mol Genet. 2008;17:R122–R128. doi: 10.1093/hmg/ddn288. [DOI] [PMC free article] [PubMed] [Google Scholar]
- 12.Burton PR, et al. Association scan of 14,500 nonsynonymous SNPs in four diseases identifies autoimmunity variants. Nat Genet. 2007;39:1329–1337. doi: 10.1038/ng.2007.17. [DOI] [PMC free article] [PubMed] [Google Scholar]
- 13.Aulchenko YS, et al. Genetic variation in the KIF1B locus influences susceptibility to multiple sclerosis. Nat Genet. 2008;40:1402–1403. doi: 10.1038/ng.251. [DOI] [PubMed] [Google Scholar]
- 14.de Bakker PI, et al. A high-resolution HLA and SNP haplotype map for disease association studies in the extended human MHC. Nat Genet. 2006;38:1166–1172. doi: 10.1038/ng1885. [DOI] [PMC free article] [PubMed] [Google Scholar]
- 15.De Jager PL, et al. The role of the CD58 locus in multiple sclerosis. Proc Natl Acad Sci USA. 2009;106:5264–5269. doi: 10.1073/pnas.0813310106. [DOI] [PMC free article] [PubMed] [Google Scholar]
- 16.Hoffmann LA, et al. TNFRSF1A R92Q mutation in association with a multiple sclerosis-like demyelinating syndrome. Neurology. 2008;70:1155–1156. doi: 10.1212/01.wnl.0000296279.98236.8a. [DOI] [PubMed] [Google Scholar]
- 17.Kumpfel T, et al. Late-onset tumor necrosis factor receptor-associated periodic syndrome in multiple sclerosis patients carrying the TNFRSF1A R92Q mutation. Arthritis Rheum. 2007;56:2774–2783. doi: 10.1002/art.22795. [DOI] [PubMed] [Google Scholar]
- 18.Aksentijevich I, et al. The tumor-necrosis-factor receptor-associated periodic syndrome: new mutations in TNFRSF1A, ancestral origins, genotype-phenotype studies, and evidence for further genetic heterogeneity of periodic fevers. Am J Hum Genet. 2001;69:301–314. doi: 10.1086/321976. [DOI] [PMC free article] [PubMed] [Google Scholar]
- 19.Wildemann B, et al. The tumor-necrosis-factor-associated periodic syndrome, the brain, and tumor-necrosis-factor-alpha antagonists. Neurology. 2007;68:1742–1744. doi: 10.1212/01.wnl.0000260226.21010.2b. [DOI] [PubMed] [Google Scholar]
- 20.Jenne DE, et al. The low-penetrance R92Q mutation of the tumour necrosis factor superfamily 1A gene is neither a major risk factor for Wegener’s granulomatosis nor multiple sclerosis. Ann Rheum Dis. 2007;66:1266–1267. doi: 10.1136/ard.2006.065987. [DOI] [PMC free article] [PubMed] [Google Scholar]
- 21.Pedchenko TV, Park GY, Joo M, Blackwell TS, Christman JW. Inducible binding of PU.1 and interacting proteins to the Toll-like receptor 4 promoter during endotoxemia. Am J Physiol Lung Cell Mol Physiol. 2005;289:L429–L437. doi: 10.1152/ajplung.00046.2005. [DOI] [PubMed] [Google Scholar]
- 22.Lee CH, et al. Regulation of the germinal center gene program by interferon (IFN) regulatory factor 8/IFN consensus sequence-binding protein. J Exp Med. 2006;203:63–72. doi: 10.1084/jem.20051450. [DOI] [PMC free article] [PubMed] [Google Scholar]
- 23.Hassan NJ, et al. CD6 regulates T-cell responses through activation-dependent recruitment of the positive regulator SLP-76. Mol Cell Biol. 2006;26:6727–6738. doi: 10.1128/MCB.00688-06. [DOI] [PMC free article] [PubMed] [Google Scholar]
- 24.Castro MA, et al. Extracellular isoforms of CD6 generated by alternative splicing regulate targeting of CD6 to the immunological synapse. J Immunol. 2007;178:4351–4361. doi: 10.4049/jimmunol.178.7.4351. [DOI] [PubMed] [Google Scholar]
- 25.Hafler DA, et al. Immunologic responses of progressive multiple sclerosis patients treated with an anti-T-cell monoclonal antibody, anti-T12. Neurology. 1986;36:777–784. doi: 10.1212/wnl.36.6.777. [DOI] [PubMed] [Google Scholar]
- 26.Sarrias MR, et al. CD6 binds to pathogen-associated molecular patterns and protects from LPS-induced septic shock. Proc Natl Acad Sci USA. 2007;104:11724–11729. doi: 10.1073/pnas.0702815104. [DOI] [PMC free article] [PubMed] [Google Scholar]
- 27.Hunt KA, et al. Newly identified genetic risk variants for celiac disease related to the immune response. Nat Genet. 2008;40:395–402. doi: 10.1038/ng.102. [DOI] [PMC free article] [PubMed] [Google Scholar]
- 28.Barrett JC, et al. Genome-wide association defines more than 30 distinct susceptibility loci for Crohn’s disease. Nat Genet. 2008;40:955–962. doi: 10.1038/NG.175. [DOI] [PMC free article] [PubMed] [Google Scholar]
- 29.Graham RR, et al. Genetic variants near TNFAIP3 on 6q23 are associated with systemic lupus erythematosus. Nat Genet. 2008;40:1059–1061. doi: 10.1038/ng.200. [DOI] [PMC free article] [PubMed] [Google Scholar]
- 30.Raychaudhuri S, et al. Common variants at CD40 and other loci confer risk of rheumatoid arthritis. Nat Genet. 2008;40:1216–1223. doi: 10.1038/ng.233. [DOI] [PMC free article] [PubMed] [Google Scholar]
- 31.Musone SL, et al. Multiple polymorphisms in the TNFAIP3 region are independently associated with systemic lupus erythematosus. Nat Genet. 2008;40:1062–1064. doi: 10.1038/ng.202. [DOI] [PMC free article] [PubMed] [Google Scholar]
- 32.Nair RP, et al. Genome-wide scan reveals association of psoriasis with IL-23 and NF-κB pathways. Nat Genet. 2009;41:199–204. doi: 10.1038/ng.311. [DOI] [PMC free article] [PubMed] [Google Scholar]
- 33.Subramanian A, et al. Gene set enrichment analysis: a knowledge-based approach for interpreting genome-wide expression profiles. Proc Natl Acad Sci USA. 2005;102:15545–15550. doi: 10.1073/pnas.0506580102. [DOI] [PMC free article] [PubMed] [Google Scholar]
- 34.van Baarsen LG, et al. A subtype of multiple sclerosis defined by an activated immune defense program. Genes Immun. 2006;7:522–531. doi: 10.1038/sj.gene.6364324. [DOI] [PubMed] [Google Scholar]
- 35.Degre M, Dahl H, Vandvik B. Interferon in the serum and cerebrospinal fluid in patients with multiple sclerosis and other neurological disorders. Acta Neurol Scand. 1976;53:152–160. doi: 10.1111/j.1600-0404.1976.tb04333.x. [DOI] [PubMed] [Google Scholar]
- 36.Stranger BE, et al. Genome-wide associations of gene expression variation in humans. PLoS Genet. 2005;1:e78. doi: 10.1371/journal.pgen.0010078. [DOI] [PMC free article] [PubMed] [Google Scholar]
- 37.Greenberg SA, et al. Interferon-α/β-mediated innate immune mechanisms in dermatomyositis. Ann Neurol. 2005;57:664–678. doi: 10.1002/ana.20464. [DOI] [PubMed] [Google Scholar]
- 38.van der Pouw Kraan TC, et al. Rheumatoid arthritis subtypes identified by genomic profiling of peripheral blood cells: assignment of a type I interferon signature in a subpopulation of patients. Ann Rheum Dis. 2007;66:1008–1014. doi: 10.1136/ard.2006.063412. [DOI] [PMC free article] [PubMed] [Google Scholar]
- 39.Baechler EC, et al. Interferon-inducible gene expression signature in peripheral blood cells of patients with severe lupus. Proc Natl Acad Sci USA. 2003;100:2610–2615. doi: 10.1073/pnas.0337679100. [DOI] [PMC free article] [PubMed] [Google Scholar]
- 40.van Oosten BW, et al. Increased MRI activity and immune activation in two multiple sclerosis patients treated with the monoclonal anti-tumor necrosis factor antibody cA2. Neurology. 1996;47:1531–1534. doi: 10.1212/wnl.47.6.1531. [DOI] [PubMed] [Google Scholar]
- 41.The Lenercept Multiple Sclerosis Study Group and The University of British Columbia MS/MRI Analysis Group. TNF neutralization in MS: results of a randomized, placebo-controlled multicenter study. Neurology. 1999;53:457–465. [PubMed] [Google Scholar]
- 42.Siddiqui MA, Scott LJ. Spotlight on infliximab in Crohn disease and rheumatoid arthritis. BioDrugs. 2006;20:67–70. doi: 10.2165/00063030-200620010-00008. [DOI] [PubMed] [Google Scholar]
- 43.De Jager PL, et al. Integrating risk factors: HLA-DRB1*1501 and Epstein-Barr virus in multiple sclerosis. Neurology. 2008;70:1113–1118. doi: 10.1212/01.wnl.0000294325.63006.f8. [DOI] [PubMed] [Google Scholar]
Associated Data
This section collects any data citations, data availability statements, or supplementary materials included in this article.