

Abstract
Background
Bariatric surgery reverses obesity-related comorbidities, including type 2 diabetes mellitus. Several studies have already described differences in anthropometrics and body composition between Roux-en-Y gastric bypass and laparoscopic adjustable gastric banding patients, but the role of adipokines in the outcomes after the different types of surgery is not known.
Hypothesis
Differences in weight loss and reversal of insulin resistance exist between the two groups and correlate with changes in adipokines.
Methods
Fifteen severely obese women (mean BMI: 46.7 kg/m2) underwent two types of laparoscopic weight loss surgery (Roux-en-Y gastric bypass = 10, adjustable gastric banding = 5). Weight, waist and hip circumference, body composition, plasma metabolic markers, and lipids were measured at set intervals during a 24-month period after surgery.
Results
At 24 months, Roux-en-Y patients were overweight (BMI 29.7 kg/m2) while gastric banding patients remained obese (BMI 36.3 kg/m2). Roux-en-Y patients lost significantly more fat mass than gastric banding patients (mean difference 16.8 kg, p < 0.05). Likewise, leptin levels were lower in the Roux-en-Y patients (p = 0.003) and levels correlated with weight loss, loss of fat mass, insulin levels, and Homeostasis Model of Assessment 2 (HOMA-IR). Adiponectin correlated with insulin levels and HOMA-IR (r = −0.653, p = 0.04 and r = −0.674, p = 0.032, respectively) in the Roux-en-Y patients at 24 months.
Conclusions
After two years weight loss and normalization of metabolic parameters were less pronounced in patients who underwent gastric banding compared to patients who underwent Roux-en-Y gastric bypass. Our findings require confirmation in a prospective randomized trial.
Keywords: obesity, weight loss, bariatric surgery, insulin, leptin, adiponectin
INTRODUCTION
Obesity now affects approximately one-third of Americans and is associated with many comorbidities, including an increased risk of death from cardiovascular disease, diabetes, and cancer.1 The rapid increase in obesity and its sequelae is a worldwide phenomenon. Although current non-surgical treatments of obesity remain inadequate, it is generally accepted that weight loss can be achieved through caloric restriction and enhanced physical activity. However, lifestyle modifications that sustain success have been difficult to implement in a widespread manner.2 Bariatric surgery, on the other hand, has been shown to be an effective method for achieving sustained weight loss and improvement in comorbidities.3
The changes resulting from bariatric surgery include alterations in body composition, a reversal of insulin resistance, and improvement in control of hypertension.4,5 Additionally, systemic metabolic (glucose, insulin) and inflammatory markers of obesity (TNF-α, C-reactive protein) are known to favorably decrease after weight reduction surgery.5,6 Because some patients remain obese or regain weight after surgery, it is important to understand how co-morbid conditions associated with obesity will respond to both short and long term fluctuations in weight.
The goal of the present study was to compare changes in anthropometrics, body composition, and metabolic parameters between obese patients who either underwent a Roux-en-Y gastric bypass or adjustable gastric banding in a small group of women who were operated upon between January and July 2006. We analyzed variations in the aforementioned parameters for two years postoperatively and found significant differences in fat mass, waist circumference, and hip circumference between the Roux-en-Y and gastric banding patients at the end of the observation period. Both leptin and adiponectin varied significantly and correlated with decreasing insulin resistance in Roux-en-Y patients. Metabolic markers and changes in body composition showed a plateau in improvement at nine months and a partial rebound at two years among the gastric banding patients. However, there were further improvements in body composition and decreases in obesity markers in the Roux-en-Y patients two years postoperatively. Although these observations were made in a small cohort, we propose that the data warrant a large prospective randomized trial.
MATERIALS AND METHODS
Subject Selection
Fifteen women (Age: 49.1± 2.1 years; 11 Caucasian, 3 African-American, 1 Hispanic), scheduled to undergo bariatric surgery at the University of Texas Houston Bariatric Surgery Center, were enrolled in our study if they met the inclusion criteria outlined previously.7 Exclusion criteria were age less than 18 years, pregnancy, coronary artery disease, peripheral vascular disease, ischemic cardiomyopathy, or a current history of smoking. The Committee for the Protection of Human Subjects at the University of Texas Health Science Center at Houston approved the study. A written informed consent was obtained.
Patient Enrollment and Follow-up
Of an original cohort of 42 patients, 15 women completed the two-year protocol.7 Reasons for leaving the study were relocation (the majority of patients), lack of time, loss of interest, or our inability to contact the participants. Of the remaining cohort, 10 women had undergone gastric bypass with a Roux-en Y procedure. The other five women had undergone adjustable gastric banding. The procedures followed standard clinical practice.8,9
Study Protocol
Patients were evaluated at baseline, three months, nine months, and 24 months after surgery. Patients were instructed to fast for 12 hours, and to abstain from alcohol or exercise for 24 hours prior to their evaluations. Patient evaluation consisted of the following tests and measurements: a standard physical exam to assess height and weight, blood pressure, and heart rate as well as a history to gather information on diet, physical activity, and complications related to the obesity and operation. Anthropometric measurements (waist circumference and hip circumference) and real time bioimpedance analysis (RJL Systems, Clinton Township, Mich.) were used to quantify body composition (fat mass, lean mass, and body cell mass). Serum glucose, insulin, tumor necrosis factor alpha (TNF-α), high sensitivity C-reactive protein (hs-CRP), free fatty acids, leptin, and adiponectin were obtained. Blood chemistries included triglycerides, total serum cholesterol, low density lipoprotein (LDL), and high density lipoprotein (HDL). The Homeostasis Model of Assessment computer model (HOMA2) was used in the calculation of insulin resistance as described previously.10
Statistical Analyses
Statistical analysis was performed using SigmaStat 3.0 (Systat Software, Inc., San Jose, Calif.). Study variables for conformation to normality using Q-Q plots, skewness, and kurtosis statistics were evaluated. Significantly non-normal variables were transformed prior to analysis. Paired t-tests were performed to evaluate differences in outcomes between each visit. Two-way repeated measures ANOVA with post-hoc comparisons with multiple comparison adjustments were made across time point pairs by linear contrasts. Data are expressed as mean values plus or minus the standard error of the mean or as differences in mean values from baseline to three months, three months to nine months, and nine months to twenty four months post surgery with 95% confidence intervals. Pearson correlation coefficients were prepared to evaluate the univariate relationships between variables.
RESULTS
Anthropometric Data
After two years, Roux-en-Y patients (BMI: 29.7 kg/m2) could be classified as overweight while the gastric banding patients (BMI: 36.3 kg/m2) remained obese. Beyond nine months, significant variance attributable to surgery type in percentage of weight loss was evident between the Roux-en-Y and gastric banding groups. At 24 months, the mean differences of percentage of weight lost between the two groups was 17.9% (p<0.001). Hip circumference was less in the Roux-en-Y group (p=0.042) at nine months compared to the gastric banding group (Tables 1 and 2). A significant difference in waist circumference (p=0.015) was found attributable to surgery type at twenty four months. In terms of body composition, after 24 months Roux-en-Y patients had less fat mass (p<0.05) than the gastric banding patients. Even though lean mass was lower in the Roux-en-Y patients than in the banding patients, this difference was only significant when time was considered as the source of variation rather than surgery type.
Table 1.
Roux-en-Y Gastric Bypass Patients
| Baseline | 3 Months | 9 Months | 24 Months | |
|---|---|---|---|---|
| Anthropometric Data | ||||
| Weight (kg) | 128.58 ± 5.65 | 104.83 ± 5.45 | 83.77 ± 5.62 | 80.44 ± 5.16 |
| BMI (kg/m2) | 47.61 ± 2.21 | 38.78 ± 2.04 | 30.92 ± 2.02 | 29.66 ± 1.75 |
| Waist circumference (cm) | 126.83 ± 4.69 | 111.84 ± 4.24 | 94.96 ± 4.27 | 85.53 ± 6.01¶ |
| Hip circumference (cm) | 136.16 ± 3.54 | 119.30 ± 3.56 | 104.57 ± 4.83¶ | 105.66 ± 4.10 |
| Waist:Hip Ratio | 0.93 ± 0.03 | 0.94 ± 0.02 | 0.91 ± 0.02 | 0.81 ± 0.05 |
| Percent Weight Loss (%) | -- | 18.67 ± 1.03 | 35.31 ± 1.83† | 37.36 ± 3.13† |
| Fat mass (kg) | 65.99 ± 4.97 | 49.85 ± 4.40 | 32.33 ± 4.26 | 28.93 ± 4.03¶ |
| Lean Mass (kg) | 61.13 ± 2.40 | 54.78 ± 2.20 | 51.31 ± 2.37 | 51.51 ± 2.74 |
| Cardiovascular Data | ||||
| HR (bpm) | 80.00 ± 4.6 | 68.70 ± 7.36 | 60.80 ± 2.91 | 65.50 ± 2.25 |
| LVEF (%) | 64.90 ± 1.95 | 62.50 ± 1.11 | 66.80 ± 2.20 | 62.20 ± 1.33 |
| SBP (mm Hg) | 119.20 ± 6.63 | 124.20 ± 4.39 | 120.75 ± 8.08 | 129.80 ± 10.24 |
| DBP (mm Hg) | 69.00 ± 1.73 | 65.40 ± 3.68 | 62.00 ± 2.22 | 75.80 ± 3.31 |
| LVM (g) | 190.36 ± 10.94 | 175.69 ± 10.94 | 159.27 ± 12.17 | 157.44 ± 10.05 |
| Metabolic Data | ||||
| Glucose (mg/dL) | 115.40 ± 15.55 | 87.80 ± 15.29 | 78.00 ± 3.19 | 84.00 ± 5.09 |
| Insulin (ulU/mL) | 22.90 ± 6.77 | 9.31 ± 1.79 | 6.94 ± 2.49 | 4.87 ± 1.28 |
| HOMA | 4.61 ± 1.22 | 2.55 ± 1.12 | 1.49 ± 0.65 | 1.12 ± 0.33 |
| TNF-α (pg/mL) | 8.33 ± 0.87 | 8.85 ± 0.45 | 6.35 ± 0.52 | 4.10 ± 2.27 |
| Adiponectin (μg/mL) | 9.60 ± 2.53 | 10.50 ± 1.57 | 10.00 ± 1.06 | 21.10 ± 2.90 |
| Leptin (ng/mL) | 57.80 ± 9.73 | 26.77 ± 5.49 | 13.82 ± 4.26 | 13.18 ± 3.19‡ |
| hs-CRP (mg/mL) | 0.70 ± 0.11 | 0.32 ± 0.07 | 0.14 ± 0.04 | 0.12 ± 0.04 |
| Free Fatty Acids (mmol/L) | 0.81 ± 0.09 | 1.04 ± 0.09 | 0.77 ± 0.09 | 0.78 ± 0.06 |
| Lipid Profiles | ||||
| Triglycerides (mg/dL) | 197.10 ± 83.38 | 102.40 ± 8.89 | 76.50 ± 14.54 | 89.70 ± 18.63 |
| Total Cholesterol (mg/dL) | 183.00 ± 9.69 | 164.90 ± 9.77 | 166.40 ± 11.04 | 173.60 ± 10.92 |
| HDL (mg/dL) | 43.80 ± 2.73 | 39.30 ± 2.33 | 49.20 ± 3.94 | 54.90 ± 4.63 |
| LDL (mg/dL) | 112.56 ± 9.81 | 103.90 ± 9.46 | 101.80 ± 8.93 | 100.90 ± 9.09 |
All data are reported as mean ± SEM for 10 patients.
Significant (p = 0.003) between surgery groups.
Significant (p < 0.001) between surgery groups.
Significant (p < 0.05) between surgery groups.
Abbreviations: BMI, body mass index; HR, heart rate; LVEF, left ventricular ejection fraction; SBP, systolic blood pressure; DBP, diastolic blood pressure; LVM, left ventricular mass; HOMA, homeostasis model of assessment; TNF-α, tumor necrosis factor alpha; hs-CRP, high sensitivity C-reactive protein; HDL, high density lipoprotein; LDL, low density lipoprotein.
Table 2.
Gastric Banding Patients
| Baseline | 3 Months | 9 Months | 24 Months | |
|---|---|---|---|---|
| Anthropometric Data | ||||
| Weight (kg) | 123.02 ± 10.88 | 106.68 ± 11.04 | 103.70 ± 12.99 | 99.56 ± 11.93 |
| BMI (kg/m2) | 44.93 ± 3.51 | 38.90 ± 3.54 | 37.70 ± 4.14 | 36.27 ± 3.85 |
| Waist circumference (cm) | 127.50 ± 9.53 | 115.70 ± 9.59 | 110.00 ± 10.17 | 111.85 ± 9.16¶ |
| Hip Circumference (cm) | 136.55 ± 8.11 | 123.45 ± 7.59 | 125.00 ± 7.92¶ | 117.50 ± 7.30 |
| Waist: Hip Ratio | 0.93 ± 0.05 | 0.93 ± 0.04 | 0.88 ± 0.04 | 0.95 ± 0.03 |
| Percent Weight Loss (%) | -- | 13.65 ± 1.92 | 16.56 ± 2.53† | 19.54 ± 3.81† |
| Fat Mass (kg) | 65.26 ± 8.45 | 50.89 ± 8.21 | 50.55 ± 9.79 | 45.69 ± 7.46¶ |
| Lean Mass (kg) | 57.52 ± 2.72 | 55.57 ± 2.97 | 52.97 ± 3.28 | 53.87 ± 4.79 |
| Cardiovascular Data | ||||
| HR (bpm) | 78.80 ± 4.71 | 71.60 ± 6.71 | 71.75 ± 4.07 | 67.60 ± 3.44 |
| LVEF (%) | 59.60 ± 7.80 | 52.40 ± 8.14 | 58.00 ± 8.53 | 63.00 ± 1.58 |
| SBP (mm Hg) | 119.20 ± 6.63 | 124.20 ± 4.39 | 120.75 ± 8.08 | 129.80 ± 10.24 |
| DBP (mm Hg) | 69.00 ± 1.73 | 65.40 ± 3.68 | 62.00 ± 2.22 | 75.80 ± 3.31 |
| LVM (g) | 191.27 ± 62.01 | 187.02 ± 53.78 | 214.20 ± 53.77 | 119.75 ± 21.74 |
| Metabolic Data | ||||
| Glucose (mg/dL) | 99.20 ± 9.44 | 88.20 ± 4.36 | 86.25 ± 3.00 | 99.00 ± 8.98 |
| Insulin (ulU/mL) | 21.22 ± 5.18 | 13.16 ± 2.20 | 10.05 ± 2.25 | 18.70 ± 7.04 |
| HOMA | 5.62 ± 1.67 | 2.88 ± 0.48 | 2.16 ± 0.51 | 4.77 ± 2.63 |
| TNF-α (pg/mL) | 7.10 ± 1.27 | 8.38 ± 0.93 | 7.33 ± 1.30 | 0.60 ± 0.60 |
| Adiponectin (μg/mL) | 8.20 ± 1.07 | 10.20 ± 1.53 | 8.75 ± 1.12 | 14.60 ± 1.36 |
| Leptin (ng/mL) | 43.80 ± 13.10 | 32.08 ± 10.19 | 26.25 ± 11.03 | 52.64 ± 22.32‡ |
| hs-CRP (mg/mL) | 0.68 ± 0.17 | 0.59 ± 0.13 | 0.44 ± 0.14 | 0.49 ± 0.17 |
| Free Fatty Acids (mmol/L) | 0.86 ± 0.10 | 0.93 ± 0.18 | 0.66 ± 0.14 | 0.63 ± 0.13 |
| Lipid Profiles | ||||
| Triglycerides (mg/dL) | 134.80 ± 27.31 | 120.20 ± 27.39 | 111.00 ± 39.62 | 114.60 ± 28.49 |
| Total Cholesterol (mg/dL) | 169.80 ± 7.86 | 165.80 ± 14.60 | 184.75 ± 10.77 | 194.20 ± 18.79 |
| HDL (mg/dL) | 45.40 ± 1.89 | 40.40 ± 1.72 | 42.50 ± 4.02 | 48.80 ± 5.52 |
| LDL (mg/dL) | 97.40 ± 7.88 | 101.40 ± 12.00 | 119.75 ± 6.90 | 122.60 ± 16.90 |
All data are reported as mean ± SEM for 5 patients.
Significant (p = 0.003) between surgery groups.
Significant (p < 0.001) between surgery groups.
Significant (p < 0.05) between surgery groups.
Abbreviations: BMI, body mass index; HR, heart rate; LVEF, left ventricular ejection fraction; SBP, systolic blood pressure; DBP, diastolic blood pressure; LVM, left ventricular mass; HOMA, homeostasis model of assessment; TNF-α, tumor necrosis factor alpha; hs-CRP, high sensitivity C-reactive protein; HDL, high density lipoprotein; LDL, low density lipoprotein.
Insulin Resistance
Three months after surgery, there was a rapid reversal of insulin resistance as evidenced by decreases in fasting insulin concentrations as well as HOMA-IR values. (Figure 1) This reversal was lost at 24 months in the gastric banding patients, but not in the Roux-en-Y patients. The differences in both parameters were significant between the two surgery groups at 3 and 9 months after surgery. (Figure 1)
Figure 1.
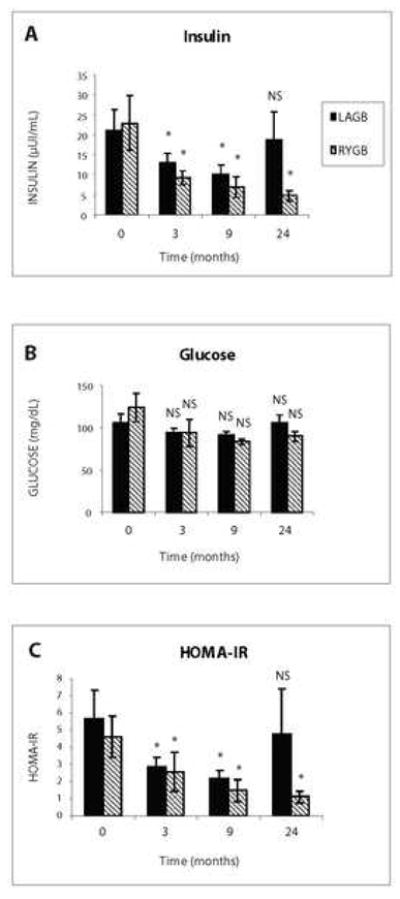
(A) Serum Insulin Levels at 3, 9, and 24 Months. While insulin levels at baseline were similar between Roux-en-Y and gastric banding cohorts at baseline, levels in Roux-en-Y patients remained low at 24 months, but increased to preoperative levels in gastric banding patients. All data are reported as mean ± SEM. * denotes p < 0.05 for comparison of preoperative and postoperative levels. NS denotes no significance.
(B) Serum Glucose at 3, 9, and 24 Months. Decrease in serum glucose in both cohorts indicates a reversal of insulin resistance within 3 months. Glucose levels at 24M in Roux-en-Y patients suggest sustained insulin sensitivity, even though differences in serum glucose between the two cohorts did not reach statistical significance. All data are reported as mean ± SEM. NS denotes no significance.
(C) HOMA-IR at 3, 9, 24 Months. The HOMA-IR index paralleled changes in insulin levels in both cohorts. A partial rebound in HOMA-IR was seen in gastric banding patients at 24 months, but did not reach statistical significance. All data are reported as mean ± SEM. * denotes p < 0.05 for comparison of preoperative and postoperative levels. NS denotes no significance.
Inflammatory Markers
Markers of chronic inflammation (TNF-α and hs-CRP) decreased with time in both cohorts when compared between baseline and 24 months, between 3 months and 24 months, and between 9 months and 24 months (p < 0.001, p < 0.001, and p = 0.01, respectively). CRP levels at all time periods post-surgery indicated a greater decrease in this inflammatory marker in the Roux-en-Y patients as compared to the gastric banding patients. Furthermore, gastric banding patients showed a non-significant rebound in CRP levels between 9 months and 24 months from 0.44 to 0.49 mg/dL while CRP levels decreased from 0.14 to 0.12 mg/dL in Roux-en-Y patients during that time period. At 24 months, CRP levels correlate with weight lost in the Roux-en-Y cohort (r = 0.618, p = 0.014).
Adipokines
Analysis of adipokines between surgery groups showed interesting trends. First, there were no significant differences in adiponectin levels between cohorts at all time periods. Secondly, while adiponectin levels were nearly identical between groups at baseline, three months, and nine months, a marked increase in adiponectin levels to 21.1 μg/mL from 9.6 μg/mL at baseline was seen in Roux-en-Y patients while levels in gastric banding patients peaked at 14.6 μg/mL at 24M from 8.2 μg/mL at baseline. At 24 months, adiponectin showed an inverse relationship with fat mass in the RYGBP cohort (r = −0.496, p = 0.145). Adiponectin did, however, correlate with both insulin and HOMA at 24 months in the Roux-en-Y patients but not in the gastric banding patients (r = −0.653, p = 0.04 and r = −0.674, p = 0.032, respectively). (Table 3)
Table 3.
Adiponectin as a Function of Parameters of Body Composition and Systemic Metabolism in Roux-en-Y Gastric Bypass Patients
| Variable | Correlation Coefficient at 24 Months | Significance† |
|---|---|---|
| Fat Mass | r = −0.496 | p = 0.145 |
| Insulin | r = −0.653 | p = 0.04 |
| HOMA-IR | r = −0.674 | p = 0.032 |
Values considered significant if p < 0.05
Abbreviations: HOMA-IR, Homeostasis Model of Assessment of Insulin Resistance
In contrast, leptin levels showed significant differences between the surgery groups at twenty four months (mean difference of 44.1 ng/mL, p = 0.003). Leptin also showed a large rebound from 26.2 to 52.6 ng/mL between nine and twenty four months among the gastric banding patients. Conversely, leptin levels continued to decrease, albeit to a small degree, in the Roux-en-Y patients (from 13.8 to 13.2 ng/mL) during this time frame.
The disparity between fat mass lost between the Roux-en-Y and gastric banding patients became evident as early as 3 months after surgery and the difference in this variable only increased between the two groups at nine and twenty four months. A strong correlation between leptin and fat mass existed at three, nine, and twenty four months (r = 0.781, p = 0.0005; r = 0.886, p < 0.0001; r = 0.792, p < 0.001, respectively) (Table 4). As the reversal of insulin resistance became evident at 3 months within the Roux-en-Y cohort, leptin correlated significantly with HOMA-IR and insulin levels (Table 4). Furthermore, this correlation grew stronger with time as indicated by the increasing magnitudes of the correlation coefficients. (Figure 2)
Table 4.
Leptin as a Function of Parameters of Body Composition and Systemic Metabolism in Roux-en-Y Gastric Bypass Patients.
| Variable | Correlation Coefficient at 3 Months | Significance† | Correlation Coefficient at 9 Months | Significance† | Correlation Coefficient at 24 Months | Significance† |
|---|---|---|---|---|---|---|
| Weight | r = 0.750 | p = 0.001 | r = 0.798 | p = 0.0006 | r = 0.809 | p < 0.0005 |
| Fat Mass | r = 0.781 | p < 0.0001 | r = 0.886 | p < 0.0001 | r = 0.791 | p = 0.0004 |
| Insulin | r = 0.644 | p < 0.01 | r = 0.584 | p = 0.02 | r = 0.932 | p < 0.00001 |
| HOMA-IR | r = 0.649 | p < 0.001 | r = 0.445 | NS | r = 0.931 | p < 0.00001 |
Values considered significant if p < 0.05
Abbreviations: HOMA, homeostasis model of assessment of insulin resistance; NS, not significant.
Figure 2.


(A) HOMA-IR as a Function of Adiponectin Levels at 24 Months in Roux-en-Y Patients. An inverse correlation (p = 0.032) between adiponectin and HOMA-IR in Roux-en-Y patients was evident at 24 months. Correlation between these two variables did not exist in the gastric banding cohort.
(B) Leptin Levels as a Function of HOMA-IR at 24 Months in Roux-en-Y Patients. A significant correlation (p < 0.00001) between leptin and HOMA-IR in Roux-en-Y patients was evident at 24 months. Correlation between these two variables did not exist in the gastric banding cohort.
(C) Adiponectin Levels as a Function of Insulin at 24 Months in Roux-en-Y Patients. An inverse correlation (p =0.04) between adiponectin and insulin in Roux-en-Y patients was evident at 24 months. Correlation between these two variables did not exist in the gastric banding cohort.
(D) Leptin Levels as a Function of Insulin at 24 Months in Roux-en-Y Patients. A significant correlation (p < 0.0001) between leptin and insulin in Roux-en-Y patients was evident at 24 months. Correlation between these two variables did not exist in the gastric banding cohort.
Lipids
While no significant differences in lipid profiles were evident between surgery groups, there were trends that suggested greater improvement in Roux-en-Y patients. Roux-en-Y patients had lower LDL, triglycerides, and total cholesterol than gastric banding patients while achieving a greater HDL than gastric banding patients (54.9 mg/dL as compared to 48.8 mg/dL). (Tables 1 and 2)
DISCUSSION
We examined the effects of two types of weight loss surgery on changes in body composition and systemic metabolism in a small group of women. At 24 months, significant differences between the two groups were found. Although both Roux-en-Y and gastric banding patients showed significant improvement in many measured parameters, Roux-en-Y patients reached a plateau while banding patients began to rebound. A progressive return of metabolic markers of obesity was seen in gastric banding patients but not in Roux-en-Y patients.
The discrepancy in results between the two cohorts suggests that the mechanisms of weight loss differ between Roux-en-Y gastric bypass surgery and gastric banding. While both Roux-en-Y gastric bypass and gastric banding have a restrictive component, recent evidence suggests that bypass of the upper intestine in the Roux en Y procedure may lead to greater weight loss through an alteration of hormone levels and other factors within the satiety crosstalk between the gut and the brain.11,12 Furthermore, the radical changes in satiety and adipose tissue derived hormone levels that occur after a Roux-en-Y procedure may sustain long term weight loss and prevent weight rebound to a greater degree than the obvious restrictive and malabsorptive nature of the surgery would predict.11,12
Others have shown that weight loss leads to improved insulin sensitivity.13,14 There is also evidence that a Roux-en-Y gastric bypass results in greater improvement in insulin resistance by bypassing the hormonally active foregut.15 In our study, Roux-en-Y patients at 24 months had significantly less fat mass than their gastric banding counterparts (28.9 kg as opposed to 45.7 kg). Yet, it is the metabolically active components of fat, the adipocytes, which are likely to play a vital role in explaining the disparity in weight loss between Roux-en-Y and gastric banding patients. Adipocytes produce many bioactive peptides, such as leptin and adiponectin, that have been shown to modulate insulin responsiveness.16 In our study, Roux-en-Y patients had significantly lower leptin levels than banding patients (13.2 ng/mL as opposed to 52.6 ng/mL, respectively). In the Roux-en-Y cohort, leptin also correlated significantly with weight, fat mass, insulin, and HOMA. (Table 4) These findings are similar to results by Infanger et al. who found that leptin levels correlated linearly with fat mass in patients who underwent weight loss surgery when compared with overweight fat mass in matched controls two years after surgery.17 These findings also suggest that leptin not only decreases with loss of weight and fat mass, but also modulates insulin resistance. In this context it is of interest that leptin receptors are expressed on pancreatic β-islet cells and leptin inhibits insulin secretion and transcription of the preproinsulin gene.18,19 Studies in mice have demonstrated that administration of leptin to either normal, obese, or diabetic animals improves insulin sensitivity and reduces hyperinsulinemia.20
Other studies have pointed to the release of factors from the duodenum and proximal foregut in response to food stimulation that may be responsible for some degree of “leptin resistance” and the corresponding elevated leptin levels observed in obese patients.21 Putting all of this together, our data suggest a change in leptin resistance that is associated with weight loss which appears to be more pronounced in the Roux-en-Y cohort.
Circulating adiponectin levels are also potent regulators of insulin sensitivity.22,23 Recent studies have indicated that by changing the activity of modulators of the insulin signaling pathway, such as 5′ AMP-activated kinase, adiponectin can improve both beta cell function and insulin secretion.24,25 After 24 months, significant correlations between adiponectin and both serum insulin and HOMA were found in our Roux-en-Y patients. Our findings are consistent with those reported by Guldstrand and colleagues who measured beta cell function and insulin resistance in obese patients. Their study found a linear correlation (r = 0.46, p = 0.012) between the increase in plasma adiponectin levels and insulin sensitivity in patients who underwent weight loss surgery.26
The partial reversal in many anthropometric parameters, measures of insulin sensitivity, and adipokines at two years in our gastric banding patients is disturbing. In a five year prospective randomized trial, Angrisani and colleagues compared the outcomes of both Roux-en-Y and gastric banding patients.27 The percentage of weight loss failure (as defined by BMI >35 kg/m2 at 5 years) was 34.6% in banding patients as opposed to 4.2% in bypass patients (p < 0.001). The BMI at only 2 years after surgery of our gastric banding patients is 36.3 kg/m2 (BMI of 44.9 kg/m2 at baseline). The large discrepancy in percent weight loss for our patients after twenty four months (37.4% for Roux-en-Y patients; 19.5% for gastric banding patients) is consistent with other studies comparing the two patient cohorts.28,29 Beyond the anthropometric values, our gastric banding patients show increases in serum glucose levels, insulin levels, and HOMA between nine and twenty four months that did not reach statistical significance.
Also observed in this group was the partial reversal in adipokines (such as leptin and hs-CRP), LDL, and total serum cholesterol. While these trends were not significant, they suggest that further research with larger numbers of patients is required. Sjostrom et al. from the Swedish Obesity Study show that gastric banding patients had a higher BMI, glucose, and insulin than the gastric bypass patients.30 In their study, adipokines were not measured. In light of the role of adipokines in insulin resistance, further research is needed to better understand the mechanism of weight loss beyond caloric restriction and malabsorption that accompanies a Roux-en-Y procedure.
CONCLUSION
Compared to patients undergoing Roux-en-Y gastric bypass, weight loss and normalization of metabolic parameters were less pronounced after two years in patients undergoing gastric banding. Our findings require confirmation in a prospective randomized trial.
Acknowledgments
Source of Support: The National Heart, Lung, and Blood Institute of the US Public Health Service (R01 HL73162); National Institute of Diabetes and Digestive and Kidney Diseases (2 T35 DK007676-16).
This study was supported by grants from the National Heart, Lung, and Blood Institute of the US Public Health Service (R01 HL73162); National Institute of Diabetes and Digestive and Kidney Diseases (2 T35 DK007676-16). We thank Dr. Erik B. Wilson, Dr. Sherman C. Yu, Dr. Terry K. Scarborough, and Dr. Barry Snyder for allowing us to study their patients, and Dr. H. Vernon Anderson for critical comments. We also thank Mrs. Roxy A. Tate for her expert editorial assistance.
Footnotes
Authors Verification: None of the authors of this work have any financial conflicts of interest to disclose. All authors had access to the data and a role in writing the manuscript.
Publisher's Disclaimer: This is a PDF file of an unedited manuscript that has been accepted for publication. As a service to our customers we are providing this early version of the manuscript. The manuscript will undergo copyediting, typesetting, and review of the resulting proof before it is published in its final citable form. Please note that during the production process errors may be discovered which could affect the content, and all legal disclaimers that apply to the journal pertain.
References
- 1.Mokdad AH, Marks JS, Stroupt D, Gerberding J. Actual causes of death in the United States, 2000. J Am Med Assn. 2004;291:1238–1245. doi: 10.1001/jama.291.10.1238. [DOI] [PubMed] [Google Scholar]
- 2.Eckel RH. Nonsurgical management of obesity in adults. N Engl J Med. 2008;358:1941–1950. doi: 10.1056/NEJMcp0801652. [DOI] [PubMed] [Google Scholar]
- 3.Buchwald H, Avidor Y, Braunwald E, Jensen MD, Pories W, Fahrbach K, et al. Bariatric Surgery: a systematic review and meta-analysis. J Am Med Assn. 2004;292:1724–1737. doi: 10.1001/jama.292.14.1724. [DOI] [PubMed] [Google Scholar]
- 4.Mathier MA, Ramanathan RC. Impact of obesity and bariatric surgery on cardiovascular disease. Med Clin N Am. 2007;91:415–431. doi: 10.1016/j.mcna.2007.02.002. [DOI] [PubMed] [Google Scholar]
- 5.Shah M, Simha V, Garg A. Review: long-term impact of bariatric surgery on body weight, comorbidites, and nutritional status. J Clin Endocrinol Metab. 2006;91:4223–31. doi: 10.1210/jc.2006-0557. [DOI] [PubMed] [Google Scholar]
- 6.Vazquez LA, Pazos F, Berrazueta JR, et al. Effects of changes in body weight and insulin resistance on inflammation and endothelial function in morbid obesity after bariatric surgery. J Clin Endocrinol Metab. 2005;90:316–22. doi: 10.1210/jc.2003-032059. [DOI] [PubMed] [Google Scholar]
- 7.Leichman JG, Aguilar D, King TM, et al. Improvements in systemic metabolism, anthropometrics, and left ventricular geometry 3 months after bariatric surgery. Surg Obes Relat Dis. 2006;2:592–9. doi: 10.1016/j.soard.2006.09.005. [DOI] [PMC free article] [PubMed] [Google Scholar]
- 8.Ren CJ, Fielding GA. Laparoscopic adjustable gastric banding: surgical technique. J Laparoendosc Adv Surg Tech A. 2003;13:257–63. doi: 10.1089/109264203322333584. [DOI] [PubMed] [Google Scholar]
- 9.Williams MD, Champion JK. Linear technique of lapaproscopic Roux-en-Y gastric bypass. Surg Technol Int. 2004;13:101–5. [PubMed] [Google Scholar]
- 10.Haeckel R, Raber R, Wosniok W. Comparibility of indices for insulin resistance insulin secretion determined during oral glucose tolerance tests. Clin Chem Lab Med. 2006;44:817–23. doi: 10.1515/CCLM.2006.153. [DOI] [PubMed] [Google Scholar]
- 11.Buchwald H, Buchwald JN. Evolution of operative procedures for the management of morbid obesity: 1950–2000. Obes Surg. 2002;12:705–17. doi: 10.1381/096089202321019747. [DOI] [PubMed] [Google Scholar]
- 12.Zheng H, Berthoud HR. Neural systems controlling the drive to eat: mind versus metabolism. Physiology. 2008;23:75–83. doi: 10.1152/physiol.00047.2007. [DOI] [PubMed] [Google Scholar]
- 13.Ballantyne GH, Gumbs A, Modlin IM. Changes in insulin resistance following bariatric surgery and the adipoinsular axis: role of the adipocytokines, leptin, adiponectin, and resistin. Obes Surg. 2005;15:692–99. doi: 10.1381/0960892053923789. [DOI] [PubMed] [Google Scholar]
- 14.Patriti A, Facchiano E, Sanna A, et al. The enteroinsular axis and the recovery from type 2 diabetes after bariatric surgery. Obes Surg. 2004;14:840–8. doi: 10.1381/0960892041590818. [DOI] [PubMed] [Google Scholar]
- 15.Rubino F, Gagner M. Potential of surgery for curing type 2 diabetes mellitus. Ann Surg. 2002;137:1109–17. doi: 10.1097/00000658-200211000-00003. [DOI] [PMC free article] [PubMed] [Google Scholar]
- 16.Faraj M, Lu HL, Cianflone K. Diabetes, lipids, and adipocyte secretagogues. Biochem Cell Biol. 2004;82:170–9. doi: 10.1139/o03-078. [DOI] [PubMed] [Google Scholar]
- 17.Infanger D, Baldinger R, Branson R, et al. Effect of significant intermediate-term weight loss on serum leptin levels and body composition in severely obese subjects. Obes Surg. 2003;13:879–88. doi: 10.1381/096089203322618704. [DOI] [PubMed] [Google Scholar]
- 18.Seufert J, Kieffer TJ, Leech CA, et al. Leptin suppression of insulin secretion and gene expression in human pancreatic islets: implications for the development of adipogenic diabetes mellitus. J Clin Endocrinol Metab. 1999;84:670–6. doi: 10.1210/jcem.84.2.5460. [DOI] [PMC free article] [PubMed] [Google Scholar]
- 19.Kieffer TJ, Heller RS, Leech CA, et al. Leptin suppression of insulin secretion by the activation of ATP-sensitive K+ channels in pancreatic beta-cells. Diabetes. 1997;46:1087–93. doi: 10.2337/diab.46.6.1087. [DOI] [PMC free article] [PubMed] [Google Scholar]
- 20.Kamohara S, Burcelin R, Halaas JL, et al. Acute stimulation of glucose metabolism in mice by leptin treatment. Nature. 1997;389:374–77. doi: 10.1038/38717. [DOI] [PubMed] [Google Scholar]
- 21.Mantzoros CS. The role of leptin in human obesity and disease: a review of current evidence. Ann Intern Med. 1999;130:671–80. doi: 10.7326/0003-4819-130-8-199904200-00014. [DOI] [PubMed] [Google Scholar]
- 22.Combs TP, Pajvani UB, Berg AH, et al. A transgenic mouse with a deletion in the collagenous domain of adiponectin displays elevated circulating adiponectin and improved insulin sensitivity. Endocrinology. 2004;145:367–83. doi: 10.1210/en.2003-1068. [DOI] [PubMed] [Google Scholar]
- 23.Kubota N, Yano W, Kubota T, et al. Adiponectin stimultes AMP-activated protein kinase in the hypothalamus and increases food intake. Cell Metab. 2007;6:55–68. doi: 10.1016/j.cmet.2007.06.003. [DOI] [PubMed] [Google Scholar]
- 24.Gu W, Li X, Liu C, et al. Globular adiponectin augments insulin secretion from pancreatic beta cells at high glucose concentrations. Endocrine. 2006;30:217–21. doi: 10.1385/ENDO:30:2:217. [DOI] [PubMed] [Google Scholar]
- 25.Towler MC, Hardie DG. AMP-activated protein kinase in metabolic control and insulin signaling. Circ Res. 2007;100:328–41. doi: 10.1161/01.RES.0000256090.42690.05. [DOI] [PubMed] [Google Scholar]
- 26.Guldstrand M, Ahren B, Adamson U. Improved beta-cell function after standardized weight reduction in severely obese subjects. Am J Physiol Endocrinol Metab. 2003;284:E557–E565. doi: 10.1152/ajpendo.00325.2002. [DOI] [PubMed] [Google Scholar]
- 27.Angrisani L, Lorenzo M, Borrelli V. Laparascopic adjustable gastric banding versus Roux-en-Y bypass: 5-year results of a prospective randomized trial. Surg Obes Relat Dis. 2007;3:127–32. doi: 10.1016/j.soard.2006.12.005. [DOI] [PubMed] [Google Scholar]
- 28.Mognol P, Chosidow D, Marmuse JP. Laparascopic gastric bypass versus laparscopic adjustable gastric banding in the super-obese: a comparative study of 290 patients. Obes Surg. 2005;15:76–81. doi: 10.1381/0960892052993486. [DOI] [PubMed] [Google Scholar]
- 29.Bowne WB, Julliard K, Castro AE, et al. Laparascopic gastric bypass is superior to adjustable gastric band in super morbidly obese patients: a prospective, comparative analysis. Arch Surg. 2006;141:683–9. doi: 10.1001/archsurg.141.7.683. [DOI] [PubMed] [Google Scholar]
- 30.Sjostrom L, Lindroos AK, Peltonen M, et al. Lifestyle, diabetes, and cardiovascular risk factors 10 years after bariatric surgery. N Engl J Med. 2004;351:2683–93. doi: 10.1056/NEJMoa035622. [DOI] [PubMed] [Google Scholar]