Abstract
Acoustically induced inelastic light scattering, first reported in 1922 by Brillouin1, allows non-contact, direct readout of the viscoelastic properties of a material and has widely been investigated for material characterization2, structural monitoring3 and environmental sensing4. Extending the Brillouin technique from point sampling spectroscopy to imaging modality5 would open up new possibilities for mechanical imaging, but has been challenging because rapid spectrum acquisition is required. Here, we demonstrate a confocal Brillouin microscope based on a fully parallel spectrometer—a virtually imaged phased array—that improves the detection efficiency by nearly 100-fold over previous approaches. Using the system, we show the first cross-sectional Brillouin imaging based on elastic properties as the contrast mechanism and monitor fast dynamic changes in elastic modulus during polymer crosslinking. Furthermore, we report the first in situ biomechanical measurement of the crystalline lens in a mouse eye. These results suggest multiple applications of Brillouin microscopy in biomedical and biomaterial science.
The mechanical properties of biological tissues and biomaterials are closely related to their functional abilities6, and thus play significant roles in many areas of medicine. For example, coronary arteries hardened by calcification can cause heart problems, mechanically weakened bones resulting from osteoporosis represent a serious orthopaedic concern, and the stiffness of the extra-cellular matrix influences drug delivery and cell motility7. As such, the ability to measure mechanical properties non-invasively in vivo at the microscopic (cellular) scale would have a wide range of biomedical applications, as well as uses in material science and engineering8,9.
Conventional mechanical tests, such as dynamic mechanical analysis and rheometry, require mechanical forces to be applied to samples through contact and, although accurate and comprehensive, they are therefore not well suited to in situ high-resolution measurements. Miniaturized mechanical methods have become increasingly sophisticated10, but they are still limited to surface measurement. Elastography is a promising technique used to extract mechanical information from structural deformation images11; however, sensitivity to the assumed stress distribution and physiological motion limit spatial resolution and measurement precision. Acoustic techniques, such as ultrasound and acoustic microscopy, are non-invasive and can offer microscopic resolution. However, these techniques tend to be effective only for samples with simple internal structures12, because the detected signals (acoustic echoes) originate from the spatial derivative of the acoustic impedance to be measured, rather than its absolute magnitude.
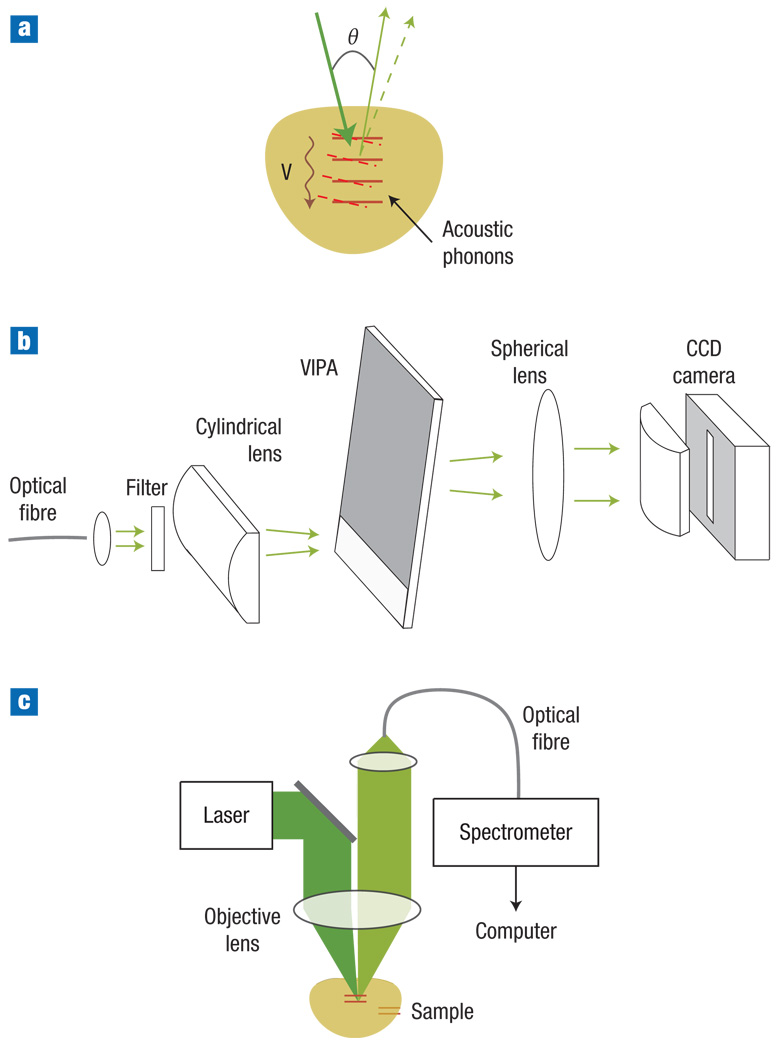
Spontaneous Brillouin scattering is an inelastic scattering process arising from inherent density fluctuations, or acoustic phonons, in the medium (Fig. 1a). Brillouin spectroscopy measures spectral changes upon scattering, providing direct information on the phonon’s properties that are closely related to the viscoelastic properties of the medium (see Methods). Previously, Brillouin spectroscopy has been used successfully to measure the viscoelastic properties of samples ex vivo, including collagen fibres13,14, bone15, cornea and crystalline lens16,17. Nevertheless, this technique has remained a point sampling method, mainly because the measurement time to perform imaging was too long, typically minutes per spectrum (pixel).
Figure 1. Principle and schematic of the experimental set-up.
a, Illustration of Brillouin light scattering originating from acoustic phonons (waves). b, Schematic of spectrometer based on a VIPA. c, Schematic of the confocal Brillouin microscope system.
A challenge in Brillouin spectroscopy is separating Brillouin light from elastically scattered light, which arises from Rayleigh and Mie scattering or reflections from optical components. This can be orders of magnitude stronger than Brillouin scattered light in most biological tissues. In addition, the Brillouin frequency shift, in the order of GHz (0.1–0.5 cm−1), is too small to resolve with conventional spectrometers. For high spectral resolution and extinction, Brillouin spectroscopy has relied on multiple-pass scanning Fabry–Perot (FP) interferometers18, grating-based monochromators19 and optical beating methods20. These scanning approaches are slow, however, as they measure individual spectral components sequentially. A non-scanning parallel approach has been demonstrated recently using an angle-dispersive FP etalon5,21. However, at each beam incidence angle, only a specific narrowband spectral component is transmitted and detected, while the rest is reflected. Consequently, in both the non-scanning and the scanning approaches, the throughput efficiency is fundamentally limited to less than 1/ℱ, where ℱ denotes the finesse of etalon; this results in a trade-off between measurement resolution and acquisition speed.
To circumvent this problem, we developed a fully parallel dispersive imaging spectrometer based on a virtually imaged phased array22,23 (VIPA) (Fig. 1b; see also Methods). Our custom-built VIPA spectrometer featured high finesse of up to 56 and high throughput efficiency over 80%, and has a free spectral range (FSR) of 33.3 GHz. The spectrometer was integrated into a home-built confocal microscope set-up (Fig. 1c). Using a single-mode fibre ensured strict confocality, flexible beam delivery, and minimal stray light in the spectrometer. We used a dual-axis configuration24 with 6° beam cross angle to reduce backscattered light and to achieve high spatial resolution with a low numerical aperture (NA). Epiconfocal detection, on the other hand, can maximize light collection. The three-dimensional resolution, measured by sliding the interface of two materials with distinctly different Brillouin shifts over the beam focus, was 6 µm (x) × 6 µm (y) × 60 µm (z). The resolution can be improved by increasing the NA. However, a high NA (>0.5) will involve noticeable Brillouin line broadening as a result of the dependence of the frequency shift on the scattering angle, as well as through the reduced acousto–optic interaction length (axial resolution)25.
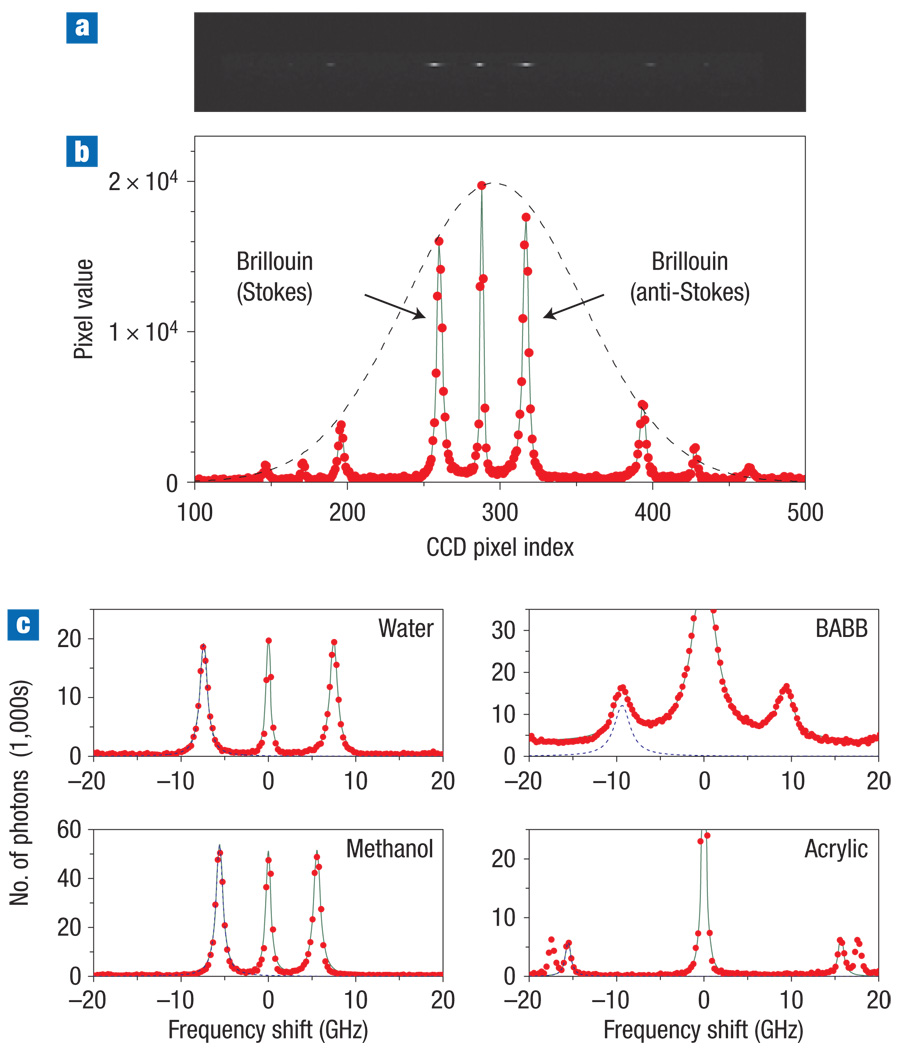
Figure 2a shows a typical spectrometer output obtained from distilled water with a CCD integration time of 1 s and laser power of 10 mW on the sample. We optimized the number of diffraction orders to effectively one within the transmission window (dotted line) by spectrometer design. The acquired spectrum shows the Stokes and anti-Stokes Brillouin lines at both sides of a central elastic scattering line (Fig. 2b). About 100,000 photons contributed to each Brillouin line. The electrical readout noise level of the camera was between 5 and 30 photons depending on the gain level used. We measured the frequency sensitivity (the root-mean-square error) to be ±7 MHz Hz−1/2, which corresponds to ±4 MPa (±0.1% error) for 1 s integration.
Figure 2. Brillouin spectra of various samples.
a, Typical CCD output obtained from distilled water. b, The width of the transmission profile (dotted line) matched to the FSR to maximize the signal. c, Calibrated optical spectra: experimental data (red circles); overall curve fit based on lorentzian functions (solid green line); and a curve fit to the Stokes Brillouin spectrum (blue dashed line). The measured Brillouin shifts and linewidths are 7.46 GHz and 0.79 GHz for water, 5.57 GHz and 0.46 GHz for methanol, 9.23 GHz and 1.97 GHz for benzyl alcohol and benzyl benzoate (BABB), and 15.6 GHz and 0.26 GHz for acrylic glass (Plexiglas).
We also tested various liquid and solid samples (Fig. 2c) and obtained Brillouin shifts and linewidths that agree with previously published data5,26. The majority of the scattered light had the same polarization state as the input laser beam. The efficiency of Brillouin scattering varies depending on the elasto–optic tensor of the material, beam directions, and optical and acoustic polarizations2. All of our experiments described here used isotropic materials in the quasi-epi detection (back-scattering) configuration. As a result, we observed only the Brillouin lines associated with longitudinal acoustic phonons. The amplitude of scattering from transverse (shear) acoustic phonons is zero in the backward direction.
To demonstrate Brillouin imaging, we used an acrylic intraocular lens placed in a cuvette filled with viscous polymer for optical index matching (Fig. 3a). A total of 230 (x) × 44 (z) spectra were acquired with a CCD integration time of 0.5 s and laser power of 3.5 mW, as the sample was translated stepwise over an area of 3.2 mm (x) × 1.3 mm (z). Figure 3b shows an image created by mapping the measured frequency shifts νB. The cross-section of the acrylic lens appears at the centre in dark red (νB = 14.6 GHz), the surrounding medium in blue (νB = 11.5 GHz), and a part of the polystyrene cuvette at the left top in light red (νB = 14.4 GHz). At the interface between different materials, the spectrum exhibits two Brillouin peaks corresponding to the individual materials. We defined the Brillouin shift as the weighted centroid of the peaks, so that the boundaries of objects are highlighted with a colour gradient. The lens and cuvette have similar Brillouin shifts, barely discernable in Fig. 3b, but their elasto–optic constants and thus Brillouin scattering efficiencies are substantially different. The difference produces a high contrast between the two objects in the image created by mapping the Brillouin magnitude at a shift of 14.5 GHz (Fig. 3c). The intraocular lens was almost invisible to the naked eye because of index matching; however, the Brillouin images clearly visualize it using the elastic properties as the contrast mechanism. Cross-sectional line profiles are shown in Fig. 3d.
Figure 3. Cross-sectional Brillouin image of an intraocular lens.
a, Picture of the sample used. To visualize the outline of the lens clearly, the picture was taken before filling the cuvette with index-matching viscous polymer. The imaged area is 3.2 mm (x) × 1.3 mm (z). b, Image based on measured frequency shifts, corresponding to a cross-sectional map of elastic modulus. c, Image created by using Brillouin scattering magnitudes as contrast. d, Representative cross-sectional line profiles taken along the dotted line in b and c. Arrows indicate which y axis scale applies.
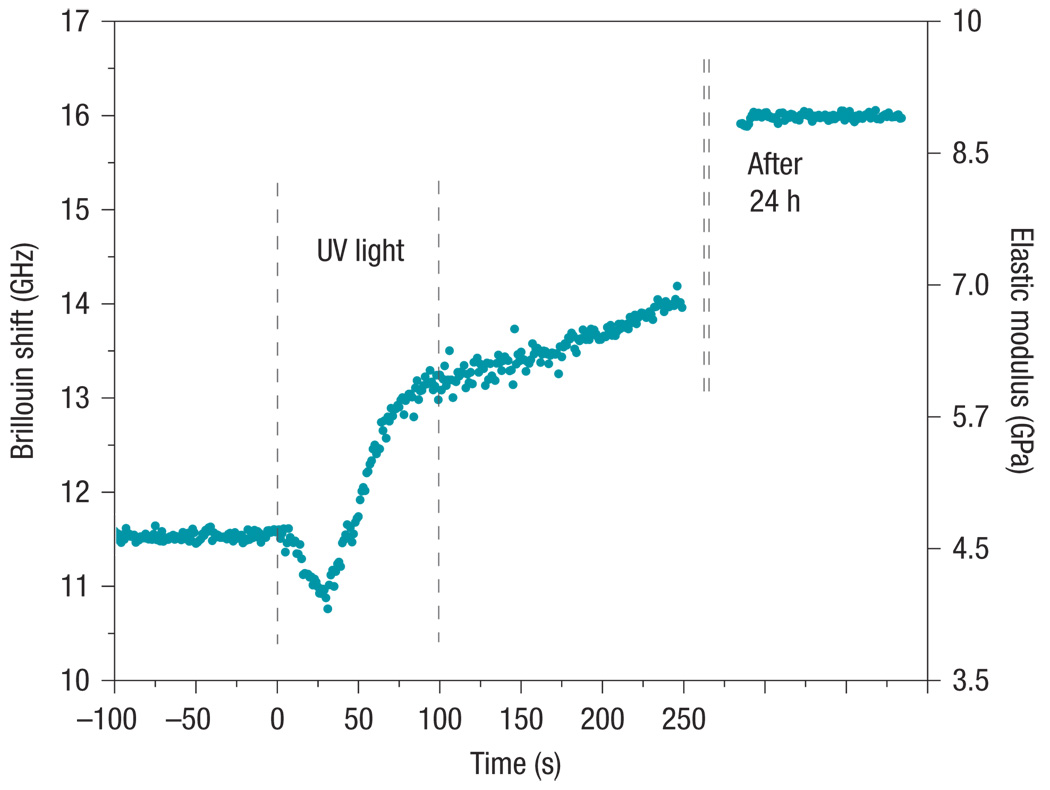
In addition to facilitating imaging, rapid measurement of Brillouin spectra can enable the dynamic changes in material to be monitored. Crosslinking collagen and biopolymers in situ is an emerging technique in tissue engineering used for constructing structurally and mechanically optimized cell scaffolds27. To test whether our system can monitor the modulus change by crosslinking, we measured the Brillouin spectra of optical adhesive polymer in response to UV curing light. Figure 4 depicts the Brillouin shifts measured continuously over time with 1 s CCD integration time. The UV lamp was turned on at t = 0 and off at t = 100 s. During this period, we observed rapid dynamic changes characterized by an initial decrease of Brillouin shift followed by a steady increase. The further increase with a reduced slope after t = 100 s is due to post-illumination crosslinking. After 24 h, the polymer appeared to reach a steady state. The right y axis denotes the elastic modulus calculated from the measured Brillouin shifts assuming a constant density of ρ = 1.2 g cm−3 and a refractive index of n = 1.56 (the actual variation of these parameters amounts to less than 1% uncertainty in the elastic modulus estimation). This experiment demonstrates the capability of monitoring dynamic mechanical changes non-invasively in situ by Brillouin spectroscopy with high temporal resolution (1 s).
Figure 4. Real-time monitoring during UV-induced crosslinking of polymer.
Four distinct phases are observed, characterized by a constant Brillouin shift before curing (−100 s to 0 s), dynamic changes during UV illumination (0 s to 100 s), an increase during post-illumination crosslinking (100 s to 250 s), and a steady state after being fully cured (after 24 h). The elastic modulus was calculated from the measured Brillouin frequency shift.
Brillouin scattering is in principle similar to Raman scattering. The molecular chemical properties of a sample can be determined from Raman scattering by measuring THz optical phonons, rather than GHz acoustic phonons, with a conventional grating-based spectrometer. Although Raman imaging has been investigated actively for biomedical sensing and diagnosis28, the effort to extend Brillouin spectroscopy to a practical imaging modality has been impeded by a dearth of sub-GHz-resolution and high-throughput spectrometers. The VIPA-based spectroscopy we have demonstrated here offers a solution to this bottleneck, providing significantly enhanced Brillouin signals compared with those produced using previous approaches5,18,19. Combined with a fibre-optic confocal microscope, this advance has enabled us to monitor dynamic changes in a polymer through crosslinking and to obtain cross-sectional images using the mechanical properties as the contrast mechanism.
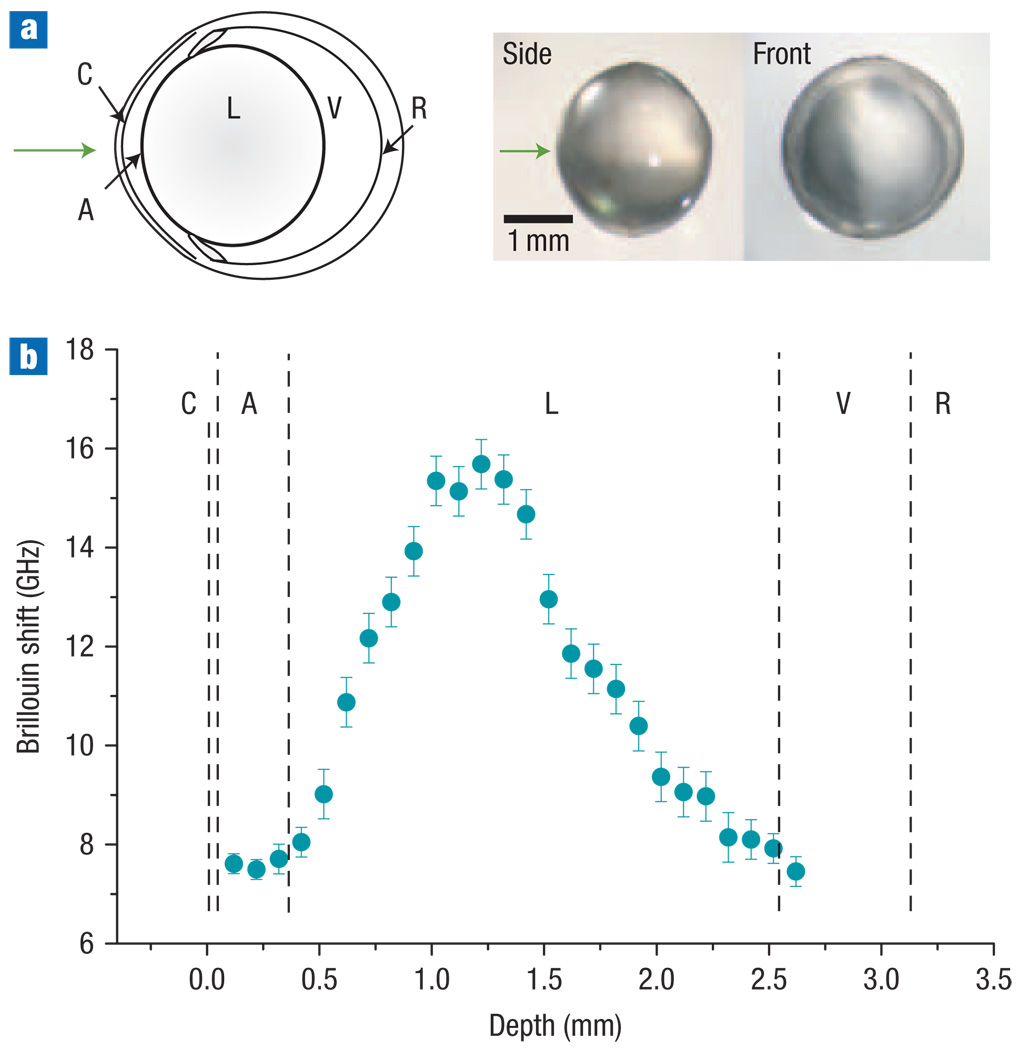
The main limitation of the single-VIPA spectrometer is low extinction of the Rayleigh signal, about −30 dB in the Brillouin-shift region. To test the feasibility of biomechanical measurement, we improved the extinction to −55 dB using a tandem VIPA and performed an in situ experiment with the eye of a mouse, post mortem (Fig. 5a; see Methods). Along the optic axis of the eye, we acquired spectra at a depth interval of 100 µm with 7 mW optical power and 10 s integration time. Figure 5b depicts the measured Brillouin frequency shift. We found that the Brillouin shifts of the aqueous and vitreous humours were about 7.55 ± 0.20 GHz, close to the 7.40 ± 0.01 GHz of distilled water. In the crystalline lens, the Brillouin shift increased from the outer layers (cortices) towards the centre (nucleus). This result is consistent with previous measurements of excised lenses in vitro16,17, obtained using a multipass FP scanning interferometer with higher power levels of 10–25 mW and a much longer integration time of 10 min per spectrum. Here we measured Brillouin scattering from the intact eye, to our knowledge for the first time, suggesting the possibility of in vivo biomechanical studies of the crystalline lens and cornea. Measuring their viscoelastic properties non-invasively with micrometre-scale resolution would greatly enhance our ability to understand their roles in a variety of ocular problems, such as presbyopia29, and to improve cornea tissue bonding and cataract surgery30. Further improving extinction, for example by cascading more VIPA stages, should make it possible to visualize and monitor the biomechanical properties of other tissues in situ at the cellular level.
Figure 5. In situ characterization of the crystalline lens in a mouse eye.
a, Left: Schematic of the murine eye. Right: images of the crystalline lens extracted after measurement. The arrow indicates the beam entrance direction. b, Brillouin frequency shifts measured at various depths along the central optic axis (blue circles), showing a twofold increase from the outer layers (cortices) towards the lens centre (nucleus). Error bars represent the measurement uncertainty. C, cornea; A, aqueous humour; L, lens; V, vitreous humour; and R, retina.
METHODS
BRILLOUIN SIGNAL AND VISCOELASTIC MODULUS
Spontaneous Brillouin scattering involves optical frequency shifts, upward and downward, by the annihilation and creation of a phase-matched acoustic phonon, respectively. The Brillouin frequency shift νB for an isotropic material can be expressed as2
where is the acoustic velocity, E the elastic modulus (Young’s modulus for solids and bulk modulus for liquids), ρ the density, n the refractive index, λ the optical wavelength and θ the scattering angle (Fig. 1a). The linewidth Δ (full-width at half-maximum, FWHM) of the Brillouin spectrum is related to the acoustic attenuation coefficient a through Δ = αV/π. These parameters are related to storage modulus M′ and loss modulus M″ through16 M′ = ρV2 and M″ = ρV2Δ/νB. The measured complex modulus would be the same as the values obtainable by hypothetical dynamic mechanical analysis at the GHz frequency range.
VIPA
The VIPA is a solid etalon with three different surface coatings. The front surface is highly reflective, except for a narrow beam entrance window, which has an antireflection coating. The back surface is partially reflective. An input beam, line-focused by a cylindrical lens, enters the etalon at an angle through the transparent window, makes multiple internal reflections, and produces an array of output beams with increasing phase delays. As in a diffraction grating, the interference among the phased array beams provides angular dispersion so that different frequency components are emitted at different angles22. High throughput is assured because nearly all the photons arriving at the VIPA are eventually transmitted forward and can be detected. This is a significant advantage over a conventional angle-dispersive FP etalon where light enters through a highly reflective surface. A tandem VIPA is constructed by using two identical VIPA etalons with orthogonal orientations and relay lenses in between. Our custom-made VIPA etalons were made of a silica substrate (25 mm × 25 mm × 3 mm) with dielectric coatings. The reflectivity values for the front and back surfaces were 99.9% and 95%, respectively. The beam entrance window was 5 mm wide and the beam entrance angle was about 1.6°.
BRILLOUIN SYSTEM
The laser used was a single-frequency frequency-doubled Nd-YAG laser operating at 532 nm (Torus, Laser Quantum). An achromatic lens (focal length = 30 mm) focused the laser light to the sample with NA = 0.03. The polarization of the input beam was linear, perpendicular to the scattering plane (that is, s-polarization). In the spectrometer, we used cylindrical and aspherical lenses with a long focal length of 200 mm to match the transmission profile to the FSR (Fig. 2b). We used an electron-multiplied CCD camera (Cascade 650, Photometrics). A 38-mm cylindrical lens in front of the CCD camera was used to maximize the pixel values by focusing the spectrally dispersed light into a line image. We determined the Brillouin parameters from the CCD output by curve fitting with lorentzian functions. To reject fluorescence and Raman scattered light generated from the sample, we used a 3-nm dielectric bandpass filter in front of the spectrometer.
BRILLOUIN IMAGING
The intraocular lens (Alcon) was made of acrylate-methacrylate copolymer and was transparent at 532 nm (90%). To match the refractive index and thereby avoid excessive Fresnel reflection at the interfaces, we filled the cuvette with uncured UV adhesive (Norland 61, n = 1.52). We processed the data and produced images with custom software written in Matlab involving lorentzian curve fitting, 3 × 3 median filtering, and standard hue-saturation-value colour mapping.
DYNAMIC MONITORING
The sample was UV adhesive (Norland 61) in a 1 cm × 1 cm × 4.5 cm cuvette. The laser beam was delivered through a side wall of the cuvette. A UV curing lamp (Opticure, Norland) illuminated the sample from a distance of 8 cm with an intensity of ~4 mW cm−2. We acquired spectra continuously with a CCD frame rate of 1 Hz. At a low laser power of 3.5 mW we did not observe any sign of crosslinking induced by the probe beam itself.
BRILLOUIN MEASUREMENT OF THE EYE
We performed the Brillouin measurement with the eye of a C57BL/6 mouse (18 months), within 20 min of killing, with the eye remaining in place. A coverslip was placed on the anterior surface of the cornea with methylcellulose to minimize corneal refraction. The laser beam entered the crystalline lens through the centre of the pupil. We acquired Brillouin spectra as we moved the sample axially with steps of 100 µm. Immediately after the measurement, the eyeball was surgically removed from the animal and dissected to measure the dimensions of the crystalline lens in vitro.
Acknowledgments
This work was supported by the US Department of Defense (FA9550-04-1-0079) and the Center for Integration of Medicine and Innovative Technologies (CIMIT). We thank P. Kim for preparing the eye sample, C.P. Lin for lending us the CCD camera, and I.E. Kochevar and R.W. Redmond for helpful comments.
Footnotes
Reprints and permission information is available online at http://npg.nature.com/reprintsandpermissions/
References
- 1.Brillouin L. Diffusion de la lumiere et des rayonnes X par un corps transparent homogene; influence del’agitation thermique. Ann. Phys. (French) 1922;17:88–122. [Google Scholar]
- 2.Dil JG. Brillouin-scattering in condensed matter. Rep. Prog. Phys. 1982;45:285–334. [Google Scholar]
- 3.Culshaw B, Michie C, Gardiner P, McGown A. Smart structures and applications in civil engineering. Proc. IEEE. 1996;84:78–86. [Google Scholar]
- 4.Eloranta EW. High spectral resolution lidar. In: Weitkamp C, editor. Lidar: Range-Resolved Optical Remote Sensing of the Atmosphere. New York: Springer-Verlag; 2005. pp. 143–164. [Google Scholar]
- 5.Koski KJ, Yarger JL. Brillouin imaging. Appl. Phys. Lett. 2005;87 061903. [Google Scholar]
- 6.Fung YC. Biomechanics: Mechanical Properties of Living Tissues. New York: Springer-Verlag; 1993. [Google Scholar]
- 7.Comoglio PM, Trusolino L. Cancer: the matrix is now in control. Nature Med. 2005;11:1156–1159. doi: 10.1038/nm1105-1156. [DOI] [PubMed] [Google Scholar]
- 8.Langer R, Tirrell DA. Designing materials for biology and medicine. Nature. 2004;428:487–492. doi: 10.1038/nature02388. [DOI] [PubMed] [Google Scholar]
- 9.Claessens MMAE, Tharmann R, Kroy K, Bausch AR. Microstructure and viscoelasticity of confined serniflexible polymer networks. Nature Phys. 2006;2:186–189. [Google Scholar]
- 10.Bao G, Suresh S. Cell and molecular mechanics of biological materials. Nature Mater. 2003;2:715–725. doi: 10.1038/nmat1001. [DOI] [PubMed] [Google Scholar]
- 11.Ophir J, Cespedes I, Ponnekanti H, Yazdi Y, Li X. Elastography—a quantitative method for imaging the elasticity of biological tissues. Ultrason. Imaging. 1991;13:111–134. doi: 10.1177/016173469101300201. [DOI] [PubMed] [Google Scholar]
- 12.Greenleaf JF, Fatemi M, Insana M. Selected methods for imaging elastic properties of biological tissues. Ann. Rev. Biomed. Eng. 2003;5:57–78. doi: 10.1146/annurev.bioeng.5.040202.121623. [DOI] [PubMed] [Google Scholar]
- 13.Harley R, James D, Miller A, White JW. Phonons and elastic-moduli of collagen and muscle. Nature. 1977;267:285–287. doi: 10.1038/267285a0. [DOI] [PubMed] [Google Scholar]
- 14.Randall J, Vaughan JM. Brillouin scattering in systems of biological significance. Phil. Trans. R. Soc. Lond. A. 1979;293:341–348. [Google Scholar]
- 15.Lees S, Tao NJ, Lindsay SM. Studies of compact hard tissues and collagen by means of Brillouin light-scattering. Connect. Tissue Res. 1990;24:187–205. doi: 10.3109/03008209009152148. [DOI] [PubMed] [Google Scholar]
- 16.Vaughan JM, Randall JT. Brillouin scattering, density and elastic properties of the lens and cornea of the eye. Nature. 1980;284:489–491. doi: 10.1038/284489a0. [DOI] [PubMed] [Google Scholar]
- 17.Randall J, Vaughan JM. The measurement and interpretation of Brillouin scattering in the lens of the eye. Proc. R. Soc. Lond. B. 1982;214:449–470. doi: 10.1098/rspb.1982.0021. [DOI] [PubMed] [Google Scholar]
- 18.Lindsay SM, Anderson MW, Sandercock JR. Construction and alignment of a high-performance multipass vernier tandem Fabry–Perot interferometer. Rev. Sci. Instrum. 1981;52:1478–1486. [Google Scholar]
- 19.Benassi P, Eramo R, Giugni A, Nardone M, Sampoli M. A spectrometer for high-resolution and high-contrast Brillouin spectroscopy in the ultraviolet. Rev. Sci. Instrum. 2005;76 013904. [Google Scholar]
- 20.Tanaka H, Sonehara T. New method of superheterodyne light beating spectroscopy for Brillouin scattering using frequency-tunable lasers. Phys. Rev. Lett. 1995;74:1609–1612. doi: 10.1103/PhysRevLett.74.1609. [DOI] [PubMed] [Google Scholar]
- 21.Itoh S. Very rapid nonscanning Brillouin spectroscopy using fixed etalons and multichannel detectors. Jpn J. Appl. Phys. 1998;37:3134–3135. [Google Scholar]
- 22.Shirasaki M. Large angular dispersion by a virtually imaged phased array and its application to a wavelength demultiplexer. Opt. Lett. 1996;21:366–368. doi: 10.1364/ol.21.000366. [DOI] [PubMed] [Google Scholar]
- 23.Diddams SA, Hollberg L, Mbele V. Molecular fingerprinting with the resolved modes of a femtosecond laser frequency comb. Nature. 2007;445:627–630. doi: 10.1038/nature05524. [DOI] [PubMed] [Google Scholar]
- 24.Wang TD, Mandella MJ, Contag CH, Kino GS. Dual-axis confocal microscope for high-resolution in vivo imaging. Opt. Lett. 2003;28:414–416. doi: 10.1364/ol.28.000414. [DOI] [PMC free article] [PubMed] [Google Scholar]
- 25.Danielmeyer HG. Aperture corrections for sound-absorption measurements with light scattering. J. Acoust. Soc. Am. 1970;47:151–154. [Google Scholar]
- 26.Faris GW, Jusinski LE, Hickman AP. High-resolution stimulated Brillouin gain spectroscopy in glasses and crystals. J. Opt. Soc. Am. B. 1993;10:587–599. [Google Scholar]
- 27.Ahsan T, Harwood F, McGowan KB, Amiel D, Sah RL. Kinetics of collagen crosslinking in adult bovine articular cartilage. Osteoarth. Cart. 2005;13:709–715. doi: 10.1016/j.joca.2005.03.005. [DOI] [PubMed] [Google Scholar]
- 28.Zumbusch A, Holtom GR, Xie XS. Three-dimensional vibrational imaging by coherent anti-Stokes Raman scattering. Phys. Rev. Lett. 1999;82:4142–4145. [Google Scholar]
- 29.Heys KR, Cram SL, Truscott RJW. Massive increase in the stiffness of the human lens nucleus with age: the basis for presbyopia? Mol. Vis. 2004;10:956–963. [PubMed] [Google Scholar]
- 30.Ethier CR, Johnson M, Ruberti J. Ocular biomechanics and biotransport. Ann. Rev. Biomed. Eng. 2004;6:249–273. doi: 10.1146/annurev.bioeng.6.040803.140055. [DOI] [PubMed] [Google Scholar]


