Abstract
We have investigated the mechanism underlying potentiation of epidermal growth factor receptor (EGFR) and type 1 insulin-like growth factor receptor (IGFR1) signaling by IGF-binding protein-3 (IGFBP-3) in MCF-10A breast epithelial cells, focusing on a possible involvement of the sphingosine kinase (SphK) system. IGFBP-3 potentiated EGF-stimulated EGF receptor activation and DNA synthesis, and this was blocked by inhibitors of SphK activity or small interference RNA-mediated silencing of SphK1, but not SphK2, expression. Similarly, IGFR1 phosphorylation and DNA synthesis stimulated by LR3-IGF-I (an IGF-I analog not bound by IGFBP-3), were enhanced by IGFBP-3, and this was blocked by SphK1 silencing. SphK1 expression and activity were stimulated by IGFBP-3 ∼2-fold over 24 h. Silencing of sphingosine 1-phosphate receptor 1 (S1P1) or S1P3, but not S1P2, abolished the effect of IGFBP-3 on EGF-stimulated EGFR activation. The effects of IGFBP-3 could be reproduced with exogenous S1P or medium conditioned by cells treated with IGFBP-3, and this was also blocked by inhibition of S1P1 and S1P3. These data indicate that potentiation of growth factor signaling by IGFBP-3 in MCF-10A cells requires SphK1 activity and S1P1/S1P3, suggesting that S1P, the product of SphK activity and ligand for S1P1 and S1P3, is the “missing link” mediating IGF and EGFR transactivation and cell growth stimulation by IGFBP-3.
Insulin-like growth factor-binding protein-3 (IGFBP-3)2 is one of the family of six IGFBPs that bind the peptide growth factors IGF-I and IGF-II with high affinity and regulate their bioactivity (1). As the predominant carrier of IGFs in the endocrine system, IGFBP-3 regulates the movement of these growth factors from the circulation to target tissues and inhibits their proliferative and antiapoptotic cellular effects by blocking their activation of the type 1 IGF receptor (IGFR1) at the cell surface. In vitro studies in a variety of cell types have revealed that IGFBP-3 may also impact on cell growth and survival independently of modulating IGF bioactivity, inducing cell cycle arrest and apoptosis by regulation of apoptotic effector proteins (2–4) and interaction with nuclear receptors (5–7).
There is, however, also evidence of an association between IGFBP-3 and enhanced cell proliferation. Some clinical studies in breast, prostate, pancreatic, renal cell, and non-small cell lung cancers have shown that a high level of tissue expression of IGFBP-3 correlates with increased tumor growth or malignancy (8–13). Although the mechanism linking IGFBP-3 with growth stimulation in vivo remains unclear, we and others have shown that, in vitro, IGFBP-3 can enhance the effects of stimulatory growth factors. Human and bovine skin fibroblasts exposed to low concentrations of exogenous IGFBP-3 exhibit enhanced IGF-stimulated DNA synthesis (14, 15), and similarly, exogenous and endogenous IGFBP-3 enhanced the growth response to IGF-I in the MCF-7 breast cancer cell line (16). We have also shown previously that IGFBP-3 is inhibitory to DNA synthesis in MCF-10A breast epithelial cells in the absence of exogenous growth factors or serum (17), but is growth stimulatory in the presence of EGF in the same cell line (18). There is no evidence that potentiation of EGF or IGF bioactivity by IGFBP-3 requires direct interaction between IGFBP-3 and the growth factor receptors (15, 18), but the mechanism underlying the effects of IGFBP-3 on growth factor signaling has not been elucidated.
Recently it was suggested that, in human umbilical vein endothelial cells, an antiapoptotic effect of IGFBP-3 is associated with increased expression and activity of sphingosine kinase 1 (SphK1), and formation of the bioactive sphingolipid sphingosine 1-phosphate (S1P) (19, 20). SphK1 has been shown to have a role in oncogenesis (21), and S1P, acting both as an intracellular second messenger and extracellularly through activation of specific S1P receptors, stimulates cell proliferation and survival (22). In addition to transducing S1P signaling, the G-protein-coupled S1P receptors have been implicated in signal amplification of a variety of growth factors receptors, including the EGF and platelet-derived growth factor receptors, via receptor transactivation (23, 24). In this study we investigated whether the sphingosine kinase system is involved in modulation of growth factor receptor signaling pathways by IGFBP-3 and demonstrate that SphK1 expression is stimulated by IGFBP-3 in MCF-10A cells, and its activity is required for potentiation of EGF and IGF-I signaling by IGFBP-3 in these cells.
EXPERIMENTAL PROCEDURES
Materials
The MCF-10A breast epithelial cell line was the kind gift from Drs Robert Pauley and Herbert Soule of the Karmanos Cancer Institute, Detroit, MI (25). Tissue culture reagents and plasticware were from Trace Biosciences (North Ryde, New South Wales, Australia) and Nunc (Roskilde, Denmark). Fatty acid-free bovine serum albumin, bovine insulin, EGF, hydrocortisone, and α-tubulin antibody were purchased from Sigma, and Cholera enterotoxin was from List Biologicals (Campbell, CA). Long Arg3-IGF-I (LR3-IGF-I) was purchased from GroPep (Adelaide, South Australia). Antibodies against phospho-Y1135/1136 IGFR1, IGFR1 beta chain, phospho Y1068 EGFR and total EGFR were purchased from Cell Signaling (Beverley, MA). SphK1 and SphK2 antibodies were from Abnova (Walnut, CA). Recombinant human IGFBP-3 was expressed in human 911 retinoblastoma cells using an adenoviral expression system and purified by IGF-I-affinity chromatography and reversed-phase high-performance liquid chromatography as previously described (26). N,N-Dimethylsphingosine and JTE-013 were from Cayman Chemicals (Ann Arbor, MI), VPC23019 was from Avanti Polar Lipids (Alabaster, AL), and 2-(p-hydroxyanilino)-4-(p-chlorophenyl)thiazole (SKI), AG1478, and AG1024 were from Calbiochem. Gefitinib was purchased from LC Laboratories (Woburn, MA), and sphingosine 1-phosphate was from Biomol (Plymouth, NJ). Electrophoresis and ECL reagents were purchased from Bio-Rad (Hercules, CA), Amrad-Pharmacia (Ryde, New South Wales, Australia) and Pierce.
Cell Culture
MCF-10A cells were maintained in Dulbecco's modified Eagle's medium:Ham's F-12 medium (1:1) containing 15 mm Hepes, 5% horse serum, 10 μg/ml bovine insulin, 20 ng/ml EGF, 100 ng/ml Cholera enterotoxin, and 0.5 μg/ml hydrocortisone as described previously (18). Cultures were passaged every 5–7 days by trypsin/EDTA detachment and used between passages 158 and 165.
Preparation of Cell-conditioned Media
Confluent cultures of MCF-10A cells in T75 flasks were incubated with Dulbecco's modified Eagle's medium:Ham's F-12 medium (1:1) containing 15 mm Hepes and 0.5 g/liter fatty acid-free bovine serum albumin for 24 h (“serum-free medium”). This was replaced with 15 ml of fresh serum-free medium with or without 100 ng/ml recombinant human IGFBP-3, and incubations were continued for 48 h. Media were collected and centrifuged to remove cell debris. IGFBP-3 was stripped from the media by end-over-end stirring overnight at 4 °C with anti-IGFBP-3 IgG (27) immobilized on protein A-Sepharose beads. Complete removal of cell-derived IGFBP-3 and recombinant human IGFBP-3 from media was confirmed by IGFBP-3 radioimmunoassay (27).
siRNA-mediated Protein Silencing
siRNA-mediated knockdown of protein expression was achieved in MCF-10A cells by electroporation using the following siRNA duplexes from Qiagen: SphK1, Hs_SPHK1_6 and Hs_SPHK1_7; SphK2, Hs_SPHK2_5 and Hs_SPHK2_6; S1P1, Hs_EDG1_1_HP and Hs_EDG1_5_HP; S1P2, Hs_EDG5_2_HP and Hs_EDG5_6_HP; and S1P3, Hs_EDG3_5_HP and Hs_EDG3_6_HP. Silencing of IGFBP-3 was achieved using siRNA custom-made by Qiagen. The sequence for the antisense IGFBP-3 siRNA was r(UCU GAG ACU CGU AGU CAA C)dTdT.
For knockdown, cells were harvested by trypsinization and resuspended at 1 × 10⁶ cells in 100 μl of HMEC Transfection Reagent (Lonza, Cologne, Germany), then mixed with 1.5 μg of targeting siRNA or AllStars negative control siRNA (Qiagen). Nucleoporation was carried out using an Amaxa electroporation unit (Lonza), according to manufacturer's instructions. Immediately after electroporation, cells were transferred to complete medium, then plated for analysis of IGFR1 or EGFR activation, as described below. Knockdown of gene expression was confirmed by qRT-PCR and protein expression by Western analysis where antibodies were available.
Quantitative qRT-PCR
Silencing of gene expression was monitored by qRT-PCR using TaqMan Gene Expression Assays (Applied Biosystems, Foster City, CA). Total RNA was isolated from siRNA-transfected MCF-10A cells using TRIzol reagent (Invitrogen) and reverse-transcribed using Superscript III First Strand Synthesis SuperMix (Invitrogen) according to the manufacturer's protocols. The following TaqMan assays were used: SphK1, Hs00184211_m1; SphK2, Hs00219999_m1; IGFBP-3, Hs00181211_m1; S1P1, Hs00173499_m1; S1P2, Hs01003373_m1; and S1P3, Hs01019574_m1. Assays were performed using a Rotor-Gene 3000 thermal cycler (Corbett Research, Mortlake, New South Wales, Australia), with hydroxymethylbilane synthase (Hs00609297_m1) amplification used as internal control. Results were analyzed using the Rotor-Gene 6 software. Reduced expression of IGFBP-3 protein was also confirmed by radioimmunoassay of cell-conditioned media, as previously described (27).
DNA Synthesis Assays
DNA synthesis was assessed by incorporation of [methyl-3H]thymidine (Amersham Biosciences) as previously described (18). Cells were dispensed into 48-well plates at 1 × 10⁵ cells/well in the appropriate growth medium. After 48 h, media were changed to serum-free medium (Dulbecco's modified Eagle's medium/F-12 containing 0.5 g/liter fatty acid-free bovine serum albumin) for 24 h prior to treatment. Media were replaced with 200 μl of fresh serum-free medium containing IGFBP-3, inhibitors, and EGF or LR3-IGF-I at concentrations indicated for individual experiments, and incubations were continued at 37 °C for 20 h. Media were then replaced with 200 μl of serum-free medium containing 1 μCi/well [methyl-3H]thymidine, and incubations continued at 37 °C for 4 h. Monolayers were rinsed with cold saline (9 g/liter NaCl), fixed in cold methanol:acetic acid (3:1) for 2 h at 4 °C, and lysed in 0.5 ml of 1 m NaOH. Lysates were mixed with 3 ml of OptimaGold (Packard Instrument Co., Meriden, CT) before counting for 1 min in a Hewlett-Packard β-counter.
Measurement of Sphingosine Kinase Activity
This was carried out essentially as previously described (28). Briefly, 2 × 10⁶ cells were harvested on ice into homogenization buffer (25 mm Tris, pH 7.5, containing 1 mm EDTA, 1 mm MgCl2, 2 mm dithiothreitol, 10% glycerol, 0.25% Triton X-100, 0.5 mm 4-deoxypyridoxine, 0.2 mm Na3VO4, 10 mm NaF, and CompleteTM protease inhibitors (Roche Applied Science) and sheared using a 26-gauge needle. Lysates were centrifuged at 13,000 × g for 10 min at 4 °C, and protein was measured in supernatants. Cytosols containing 200–500 μg of protein were mixed with 5 μm d-erythro-sphingosine dissolved in 0.25% Triton X-100 and [γ-32P]ATP (1 mm, 0.5 Ci/ml) in a final volume of 200 μl for 30 min at 37 °C. Reactions were terminated by addition of 300 μl of chloroform/methanol/HCl (100:100:1, v/v), vigorous mixing for 1 min, and centrifugation at 13,000 × g for 2 min. The labeled S1P in the organic (bottom) phase was isolated by TLC on Silica Gel 60 TLC plates (Sigma) resolved with 1-butanol/methanol/acetic acid/water (8:2:1:2, v/v), and quantified using a PhosphorImager (Amersham Biosciences).
Analysis of EGFR and IGFR1 Phosphorylation
Cells were plated into 6-well plates at 5 × 10⁵ cells/well and maintained in growth medium for 48 h, then serum-free medium for 24 h. Fresh medium containing IGFBP-3 with or without inhibitors was added for 24 h, then EGF or LR3-IGF-I was added directly to cells as 20-fold concentrates to give final concentrations of 10 and 25 ng/ml, respectively. Incubations were continued at 37 °C for 5 min, then cells were washed with ice-cold phosphate-buffered saline and lysed in Laemmli sample buffer (62.5 mm Tris-HCl, pH 6.8, containing 20 g/liter SDS, 100 ml/liter glycerol, 1 g/liter bromphenol blue, and 50 mm dithiothreitol) at 4 °C for 10 min.
Cell lysates were prepared for SDS-PAGE analysis by sonication for 15 s on ice, and proteins were separated in 6% (for EGFR) or 7.5% (for IGFR1) SDS-polyacrylamide gels and transferred to Hybond C nitrocellulose for Western analysis (18). After transfer, filters were blocked in 50 g/liter skim milk powder in TBS-T (Tris-buffered saline with Tween 20: 10 mm Tris, 150 mm NaCl, pH 7.4, containing 1 ml/liter Tween 20) and probed with primary antibodies diluted in TBS-T containing 50 g/liter bovine serum albumin at 4 °C for 16 h. Filters were washed in cold TBS-T and incubated with the appropriate horseradish peroxidase-labeled secondary antibody for 1–2 h at room temperature. Washed filters were developed by enhanced chemiluminescence (ECL) using SuperSignal West Pico substrate (Pierce). Total and phosphorylated proteins were analyzed on replicate blots, and filters were also probed with α-tubulin antibody as a loading control. Bands were visualized using a FujiFilm Luminescent Image Analyzer LAS-300 (Stamford, CT), and quantified using ImageGuage software (Science Lab 2004).
RESULTS
SphK Inhibitors Block Potentiation of EGF Action by IGFBP-3 in MCF-10A Cells
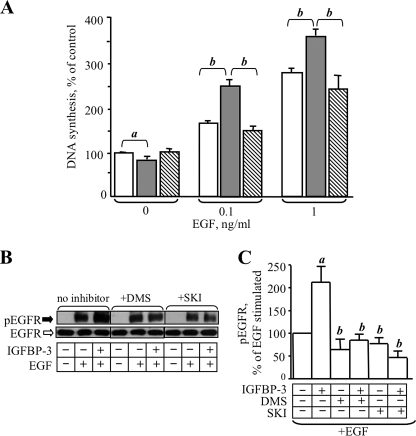
The SphK system has been implicated in the amplification of signaling mediated by a variety of growth factor receptors, including EGFR. We therefore investigated the involvement of this system in the stimulatory effect of IGFBP-3 on EGF-stimulated DNA synthesis and EGFR signaling. MCF-10A cells in serum- and growth factor-free media were treated with IGFBP-3 without or with the SphK inhibitor SKI (10 μm) and EGF at final concentrations of 0, 0.1, or 1 ng/ml for 24 h, then DNA synthesis was determined by incorporation of radiolabeled thymidine. As previously reported (18), IGFBP-3 had a small inhibitory effect on DNA synthesis in the absence of EGF, but potentiated the effect of EGF on DNA synthesis (Fig. 1A). In the presence of SKI, the effect of IGFBP-3 on EGF-stimulated DNA synthesis was lost (Fig. 1A).
FIGURE 1.
Inhibition of sphingosine kinase activity blocks potentiation of EGF action by IGFBP-3. A, MCF-10A cells were treated with serum-free medium containing EGF at the indicated concentration (open bars), and IGFBP-3 (10 ng/ml, shaded bars) or IGFBP-3 and SKI (10 μm, diagonal stripe). DNA synthesis was determined 24 h later by incorporation of radiolabeled thymidine, as described under “Experimental Procedures.” a, p < 0.05; b, p < 0.01 (by ANOVA). B, MCF-10A cells were incubated with IGFBP-3 (10 ng/ml) with or without 10 μm SKI or 10 μm DMS as indicated for 16 h, then stimulated with EGF (10 ng/ml final) for 5 min at 37 °C. Harvested cell lysates were subjected to SDS-PAGE and Western blotting, and probed for total and phospho EGFR(Y1068) as described under “Experimental Procedures.” C, quantification of Western blot data from four experiments expressed as a percentage of EGF-stimulated EGFR phosphorylation. a, p < 0.05 compared with EGF-stimulated; b, p < 0.05 compared with EGF+IGFBP-3 (by ANOVA).
We previously reported that IGFBP-3 potentiates EGF-stimulated EGFR phosphorylation (18), and to show that this is similarly affected by blockade of SphK activity, MCF-10A cells were preincubated with IGFBP-3 with or without SKI then stimulated with EGF and analyzed for EGFR phosphorylation by Western blot using a phosphospecific antibody against Tyr-1068. As shown in Fig. 1B, IGFBP-3 preincubation enhanced EGF-stimulated EGFR phosphorylation, but this effect was lost in the presence of SKI or a second SphK inhibitor, DMS. Quantification of data from four similar experiments (Fig. 1C) indicated a >2-fold increase in EGFR phosphorylation in cells preincubated with IGFBP-3 prior to exposure to EGF compared with those stimulated with EGF alone, and complete reversal of this potentiation in the presence of inhibitors of sphingosine kinase activity. The slight inhibition of EGF-stimulated EGFR phosphorylation by SphK inhibitors in the absence of IGFBP-3 was not statistically significant (Fig. 1C).
IGFBP-3 Potentiates LR3-IGF-I-stimulated IGFR1 Phosphorylation and DNA Synthesis
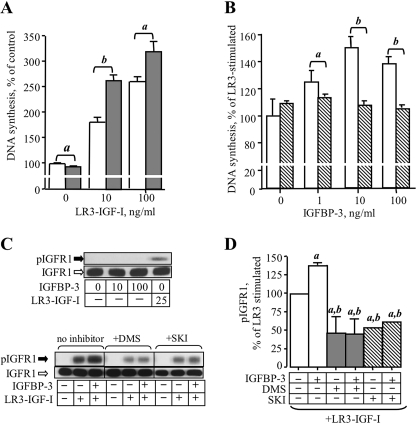
IGFBP-3 enhances IGF-stimulated DNA synthesis in fibroblasts and breast cancer cells (14–16), and involvement of the sphingosine kinase system in IGFR1 signaling has also been documented (29). We therefore investigated whether IGFBP-3 enhances IGF-I bioactivity and receptor activation in MCF-10A breast epithelial cells, and if so, whether these effects are sensitive to inhibition of sphingosine kinase activity. For this study we utilized LR3-IGF-I, an analog of IGF-I that exhibits normal binding and activation of the IGFR1, but markedly reduced affinity for IGFBPs (30), to allow us to assess whether any effects of IGFBP-3 on IGFR1 activation required direct interaction between IGFBP-3 and IGFR1 ligand. As we previously showed for wild-type IGF-I in MCF-10A cells (17), DNA synthesis was stimulated by LR3-IGF-I alone (Fig. 2A), and this was significantly enhanced by 10 ng/ml IGFBP-3 at both low and high concentrations of LR3-IGF-I (Fig. 2A). The effect of IGFBP-3 was dose-dependent, with as little as 1 ng/ml IGFBP-3 significantly enhancing the effect of 10 ng/ml LR3-IGF-I (Fig. 2B). However, when SphK was inhibited using SKI, IGFBP-3 potentiation of LR3-IGF-I-stimulated DNA synthesis was abolished (Fig. 2B).
FIGURE 2.
IGFBP-3 potentiation of LR3-IGF-I action is inhibited by SKI. A, MCF-10A cells were treated for 24 h with the indicated concentration of LR3-IGF-I without (white bars) or with (shaded bars) 10 ng/ml IGFBP-3. DNA synthesis was determined as described under “Experimental Procedures.” Results are expressed relative to control, where DNA synthesis in the absence of LR3-IGF-I or IGFBP-3 is expressed as 100%. Bars are mean ± S.E. of pooled data from three experiments performed in quadruplicate. a, p < 0.05; b, p < 0.01 (by ANOVA). B, MCF-10A cells were incubated with the indicated concentration of IGFBP-3 without (open bars) or with (diagonal stripes) 10 μm SKI for 16 h, then 10 ng/ml LR3-IGF-I was added for a further 24 h. DNA synthesis was determined as described under “Experimental Procedures.” Results are expressed relative to DNA synthesis stimulated by LR3-IGF-I, expressed as 100%. a, p < 0.05; b, p < 0.01 (by ANOVA). In C: Upper panel, cells were treated with 10 or 100 ng/ml IGFBP-3 for 16 h, then lysates were harvested into Laemmli buffer for analysis of total and phosphorylated IGFR1 by Western blot. Lysate from cells stimulated with 25 ng/ml LR3-IGF-I for 5 min was included as positive control for blotting. Lower panel, cells were treated with 10 ng/ml IGFBP-3 in the absence or presence of 10 μm SKI or 10 μm DMS, as indicated, for 16 h, then stimulated with LR3-IGF-I (25 ng/ml final) for 5 min. Cell lysates were harvested and subjected to SDS-PAGE and Western blotting for total and phospho-IGFR1. D, quantification of Western blot data from four experiments expressed as a percentage of LR3-IGF-I-stimulated IGFR1 phosphorylation. a, p < 0.05 compared with LR3-IGF-I-stimulated; b, p < 0.05 compared with LR3-IGF-I+IGFBP-3 (by ANOVA).
We then examined the effect of IGFBP-3 on IGFR1 phosphorylation stimulated by LR3-IGF-I. MCF-10A cells were preincubated for 16 h with IGFBP-3, then stimulated with LR3-IGF-I for 5 min before harvesting of cell lysates for analysis of IGFR1 phosphorylation by Western blotting. In the absence of LR3-IGF-I, preincubation with 10 or 100 ng/ml IGFBP-3 alone had no effect on phosphorylation of IGFR1 at Tyr-1135/1136, which remained undetectable (Fig. 2C, upper panel). LR3-IGF-I stimulated phosphorylation of IGFR1 at these residues, and this was enhanced in cells preincubated with IGFBP-3 (Fig. 2C, lower panel). When SKI or DMS was included with IGFBP-3 in the preincubation period, the effect of IGFBP-3 on LR3-IGF-I-stimulated IGFR1 phosphorylation was abolished (Fig. 2C). Quantification of data from four similar experiments indicated that IGFBP-3 elicited a 30–40% increase in LR3-IGF-I-stimulated IGFR1 phosphorylation (Fig. 2D) and confirmed the loss of this effect in the presence of SKI or DMS. Of note, and in contrast to their effects on EGF-stimulated EGFR phosphorylation, SKI and DMS also attenuated basal LR3-IGF-I-stimulated IGFR1 phosphorylation in the absence of exogenous IGFBP-3 (Fig. 2D) suggesting that basal SphK activity plays a role in IGFR1 activation in MCF-10A breast epithelial cells.
SphK1 Silencing Blocks IGFBP-3 Effects on Growth Factor Receptor Signaling
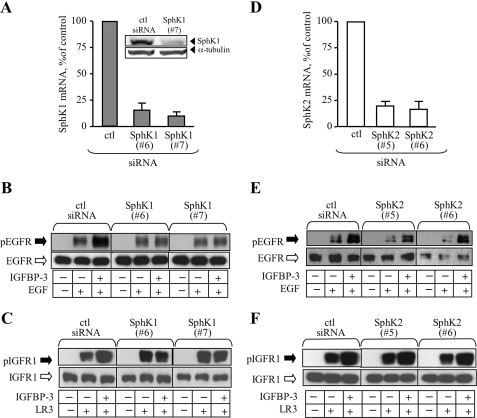
Pharmacological inhibition of SphK activity, as shown in, cannot distinguish the isoform of SphK required for IGFBP-3 effects. To determine this, MCF-10A cells transfected with SphK1 or SphK2 siRNA were treated with IGFBP-3 then stimulated with EGF or LR3-IGF-I and analyzed for growth factor receptor activation (Fig. 3). Quantification of expression of each kinase by qRT-PCR after siRNA transfection indicated ∼85–90% knockdown of SphK1 mRNA (Fig. 3A), and 75–80% knockdown of SphK2 mRNA (Fig. 3D), 24 h after transfection compared with control siRNA-transfected cells. Western analysis of SphK1 expression confirmed knockdown at the protein level at 24 h (Fig. 3A, inset); confirmation of knockdown of SphK2 protein expression could not be achieved due to lack of antibodies of sufficient specificity and sensitivity. In control siRNA-transfected MCF-10A cells, IGFBP-3 potentiated EGF-stimulated EGFR phosphorylation (Fig. 3, B and E) and LR3-IGF-I-stimulated IGFR1 phosphorylation (Fig. 3, C and F), similar to its effects in untransfected cells (Figs. 1 and 2). When SphK1 expression was reduced by siRNA, the potentiating effect of IGFBP-3 on ligand-activated phosphorylation was lost for both growth factor receptors (Fig. 3, B and C). By contrast, siRNA-mediated knockdown of SphK2 failed to block IGFBP-3 potentiation of EGF or LR3-IGF-I (Fig. 3, E and F), demonstrating the requirement for SphK1, but not SphK2, in potentiation of EGFR and IGFR1 signaling by IGFBP-3 in MCF-10A breast epithelial cells.
FIGURE 3.
siRNA-mediated knockdown of SphK1 blocks potentiation of EGFR and IGFR1 activation by IGFBP-3. MCF-10A cells were transfected with two siRNA duplexes for SphK1 siRNA (A–C), SphK2 siRNA (D–F) or control siRNA (ctl siRNA) as described under “Experimental Procedures.” SphK1 (A) and SphK2 (D) gene expression was determined by qRT-PCR 24 h after transfection. Expression of SphK1 protein was determined by Western blot of control siRNA (ctl siRNA) and SphK1 siRNA-transfected cell lysates 24 h after transfection (A inset). B, C, E, and F: control siRNA and SphK siRNA-transfected cells were changed to serum-free medium 24 h after transfection and treated without (−) or with (+) 10 ng/ml IGFBP-3 as indicated for 16 h. Cells were stimulated with EGF (10 ng/ml, B and E) or LR3-IGF-I (25 ng/ml, C and F) as indicated for 5 min, and harvested lysates were analyzed for EGFR phosphorylation (B and E) or IGFR1 phosphorylation (C and F) by Western blot. Data shown are representative of three experiments for each.
IGFBP-3 Stimulates Expression of SphK1 in MCF-10A Breast Epithelial Cells
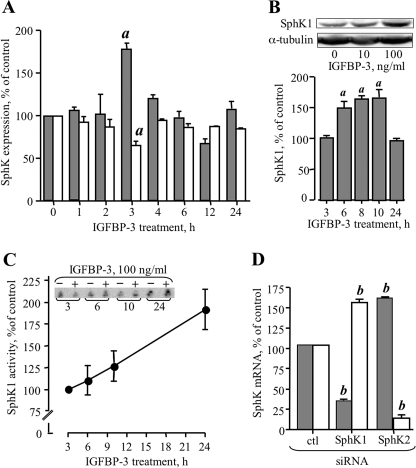
In view of a study that suggested that IGFBP-3 stimulates expression of SphK1 in human umbilical vein endothelial cells (19), we investigated the possibility that SphK expression in MCF-10A cells is also modulated by IGFBP-3. As shown in Fig. 4A, the steady-state SphK1 mRNA level measured by qRT-PCR was significantly increased by exogenous IGFBP-3. The effect was transient, peaking 3 h after addition of 100 ng/ml IGFBP-3 at 170 ± 10%. There was no effect of IGFBP-3 at time points earlier than 1 h (data not shown). By contrast, SphK2 expression did not increase over the same time course and, in fact, was significantly decreased at the 3-h time point (Fig. 4A). Western analysis of lysates of IGFBP-3-treated cells revealed an increase in SphK1 protein 6 h after addition of IGFBP-3, which was maintained up to 10 h (Fig. 4B) and declined to unstimulated levels by 24 h. Analysis of SphK1 activity indicated a time-dependent increase over 6–24 h of treatment with 100 ng/ml IGFBP-3 (Fig. 4C), with an ∼2-fold increase in total SphK1 activity after 24-h treatment with IGFBP-3 (p < 0.01).
FIGURE 4.
IGFBP-3 modulates expression and activity of SphK1 in MCF-10A cells. A, cells were plated at 2.5 × 10⁵ cells/well and incubated in serum-free medium for 24 h before addition of 100 ng/ml IGFBP-3 in fresh serum-free medium for the indicated times. Total RNA was extracted and used for qRT-PCR analysis of SphK1 (shaded bars) and SphK2 (white bars) as described under “Experimental Procedures.” Data are expressed relative to levels at the zero time point and are shown as mean ± S.D. a, p < 0.05 compared with all other time points (by ANOVA). B, SphK1 protein was analyzed by Western blot of lysates from cells treated for the indicated time with 100 ng/ml IGFBP-3. Quantification of data from three experiments is expressed as a percentage of control (untreated) and is shown as mean ± S.E. The inset shows a representative Western blot of SphK1 in control and IGFBP-3-treated lysates harvested 10 h after addition of 0, 10, or 100 ng/ml IGFBP-3, as indicated. C, SphK1 activity was determined in lysates from cells treated for the indicated time without or with 100 ng/ml IGFBP-3, as described under “Experimental Procedures.” Data from IGFBP-3-treated cells is expressed as a percentage of control at the 3-h time point and show mean ± S.E. of pooled data from four experiments. The inset shows one representative experiment of a total of four. D, MCF-10A cells were transfected with siRNA targeting SphK1 or SphK2, and RNA was isolated 48 h later and assayed for expression of SphK1 (shaded bars) or SphK2 (white bars) by qRT-PCR. Data are expressed relative to expression levels in control siRNA-transfected cells (ctl siRNA) and are shown as mean ± S.E. (pooled data from three experiments in duplicate). b, p < 0.01 compared with control siRNA.
To further explore the apparent reciprocal regulation of SphK1 and SphK2 revealed by qRT-PCR (Fig. 4A), which has not been reported previously in any cell type, gene expression of each enzyme was determined 48 h after transfection with siRNA targeting either SphK1 or Sphk2. As shown in Fig. 4D, SphK1 expression was reduced by 65–75% by siRNA targeting this isoform (p < 0.01 for each compared with control siRNA), with a concomitant increase in SphK2 expression relative to controls (Fig. 4D). Similarly, knockdown of SphK2 expression was accompanied by significantly increased expression of SphK1 (Fig. 4D). Identical results were obtained with second siRNAs targeting each gene (data not shown). These findings suggest interactive regulation of the two sphingosine kinase isoforms in MCF-10A breast epithelial cells, which is of particular interest given the reported opposing roles of these kinases in cell growth (31).
S1P1 and S1P3 Are Required for IGFBP-3 Potentiation of EGFR Signaling
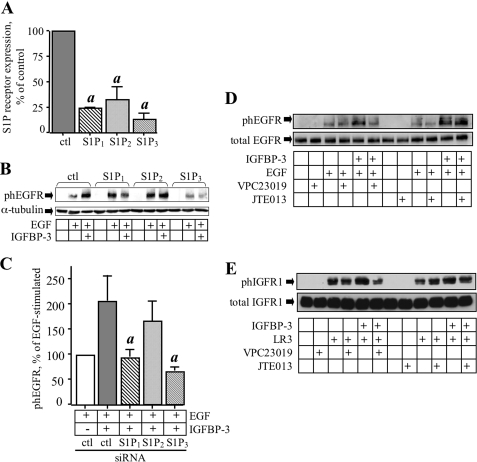
The product of sphingosine kinase enzyme activity is S1P, an extracellular ligand of five S1P receptors (S1P1–5), which mediate many of the biological effects of S1P and can transactivate growth factor receptors, including EGFR and IGFR1 (22). To investigate the involvement of S1P receptors in the effects of IGFBP-3 on EGFR signaling, siRNA was used to silence the three most widely expressed S1P receptors, S1P1, S1P2, and S1P3, and the effect of this knockdown on potentiation of EGF-stimulated EGFR phosphorylation by IGFBP-3 was determined. As shown in Fig. 5A, gene expression of each receptor was decreased ∼80% by siRNA 24 h after transfection. When expression of either S1P1 or S1P3 was abrogated, IGFBP-3 no longer potentiated EGF-stimulated EGFR phosphorylation (p < 0.05 compared with control siRNA-transfected cells), suggesting the involvement of one or both of these receptors in the effect of IGFBP-3 (Fig. 5B). By contrast, silencing of S1P2 did not significantly affect the ability of IGFBP-3 to enhance EGFR phosphorylation stimulated by EGF. Quantification of data from four similar experiments confirmed that knockdown of S1P1 or S1P3, but not S1P2, significantly affected potentiation of EGF-stimulated EGFR by IGFBP-3 (p < 0.05). To confirm the involvement of S1P1 and S1P3 but not S1P2 in IGFBP-3 effects, similar experiments were performed under conditions of pharmacological inhibition of S1P1/S1P3 using VPC23019, or S1P2 using JTE-013 (32). Cells were preincubated overnight with IGFBP-3, then exposed to 10 μm of either inhibitor for 1 h before stimulation with EGF or LR3-IGF-I. As shown in Fig. 5, VPC23019 reversed potentiation of EGFR (Fig. 5D) or IGFR1 (Fig. 5E) phosphorylation by IGFBP-3, whereas JTE-013 failed to do so, consistent with the involvement of S1P1/S1P3 but not S1P2.
FIGURE 5.
S1P1 and S1P3 are required for IGFBP-3 effects on EGFR phosphorylation. A, MCF-10A cells were transfected with control siRNA, or siRNA targeting S1P1, S1P2, or S1P3 and incubated for 24 h. RNA was extracted, and S1P receptor expression measured by qRT-PCR. a, p < 0.05 compared with control siRNA. B, S1P receptor-silenced cells were treated with IGFBP-3 (100 ng/ml) in serum-free medium for 16 h, then stimulated with 10 ng/ml EGF for 5 min. Lysates were analyzed for EGFR phosphorylation as described under “Experimental Procedures.” C, quantification of phEGFR data from five experiments conducted as described for B. Phosphorylation stimulated by EGF in the absence of IGFBP-3 is shown as 100% (white bar), with phosphorylation in the presence of IGFBP-3 shown relative to this. Pooled data from five experiments is shown as mean ± S.E. a, p < 0.05 compared with ctl siRNA treated with EGF plus IGFBP-3. D and E, MCF-10A cells were treated with IGFBP-3 (100 ng/ml) for 16 h, then VPC23019 (S1P1/S1P3 inhibitor) or JTE-013 (S1P2 inhibitor) was added to a final concentration of 10 μm. Cells were incubated for 1 h, then stimulated with EGF (10 ng/ml) or LR3-IGF-I (25 ng/ml) for 5 min. Lysates were analyzed by Western blot for phosphorylated EGFR (D) or IGFR1 (E), as described under “Experimental Procedures.”
Media Conditioned by IGFBP-3-treated Cells Enhances EGF-stimulated EGFR Phosphorylation
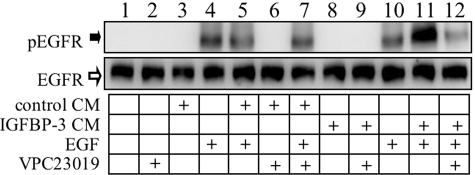
Three lines of evidence led us to hypothesize that increased extracellular S1P released in response to IGFBP-3 stimulation mediates the effects of IGFBP-3 on growth factor receptor phosphorylation: 1) the effects of IGFBP-3 on ligand-stimulated growth factor receptor activation require an enzyme responsible for synthesis of S1P, SphK1 (Figs. 1–3), 2) IGFBP-3 stimulates expression and activity of SphK1 (Fig. 4), and 3) knockdown of S1P receptors S1P1 and S1P3 abolished potentiation of EGFR phosphorylation by IGFBP-3 (Fig. 5). Attempts to measure S1P in conditioned medium were unsuccessful, because levels were below the sensitivity of the assay (not shown); however, we reasoned that if extracellular S1P is involved, then medium conditioned by IGFBP-3-treated cells but stripped of endogenous IGFBP-3 should still contain S1P, and would therefore potentiate EGF-stimulated EGFR activation in a manner inhibitable by blockade of S1P1/S1P3. This was investigated by comparing the effects of IGFBP-3-stripped medium (prepared as described under “Experimental Procedures”) from untreated MCF-10A cells (“control CM”) or IGFBP-3-treated MCF-10A cells (“IGFBP-3 CM”) on EGF-stimulated EGFR activation in the absence and presence of VPC23019. As shown in Fig. 6, in the absence of EGF neither control CM (lane 3) nor IGFBP-3 CM (lane 8) stimulated EGFR phosphorylation. EGFR phosphorylation stimulated by EGF (lanes 4 and 10) was not increased by control CM (lane 5), but was markedly enhanced by IGFBP-3 CM (lane 11). In the presence of VPC23019 (used to inhibit S1P1/S1P3), the potentiating effect of IGFBP-3 CM on EGFR phosphorylation was abolished (lane 12); VPC23019 had no effect on EGFR phosphorylation stimulated by EGF in the presence of control CM (lane 7). This demonstrates that stimulation of MCF-10A cells by IGFBP-3 generates a secreted factor that acts through S1P receptors to potentiate ligand-stimulated EGFR signaling, further supporting the central role of S1P in these effects.
FIGURE 6.
IGFBP-3-conditioned medium enhances EGF-stimulated EGFR phosphorylation. MCF-10A were stimulated with 10 ng/ml EGF in serum-free unconditioned medium, or EGF in 1 ml of conditioned medium from control cells (control CM) or IGFBP-3-treated cells (IGFBP-3 CM) prepared as described under “Experimental Procedures.” Where VPC23019 was used, cells were preincubated for 1 h with 10 μm VPC23019 in serum-free unconditioned medium prior to stimulation with EGF. Harvested lysates were analyzed for phosphorylated EGFR by Western blot as described under “Experimental Procedures.”
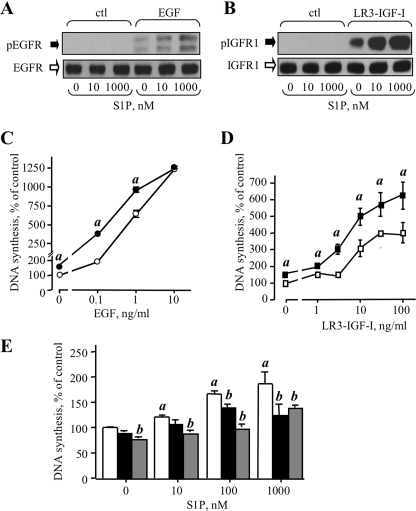
To confirm this, we then examined whether exogenous S1P could mimic the effect of IGFBP-3 on EGFR and IGFR1 phosphorylation, by treating MCF-10A cells with EGF or LR3-IGF-I without and with S1P, and analyzing growth factor receptor phosphorylation in cell lysates. In the absence of exogenous EGF or LR3-IGF-I, S1P did not induce EGFR or IGFR1 phosphorylation to a level detectable by Western blotting (Fig. 7, A and B). However, receptor phosphorylation stimulated by either EGF (Fig. 7A) or LR3-IGF-I (Fig. 7B) was enhanced in the presence of 10 and 1000 nm S1P, and DNA synthesis stimulated by these growth factors was also significantly enhanced by 1 μm S1P (Fig. 7, C and D). In addition, S1P had a small (∼50%) but statistically significant stimulatory effect on DNA synthesis in the absence of exogenous growth factors (Fig. 7, C and D).
FIGURE 7.
Effects of exogenous S1P on EGF and IGF bioactivity. EGFR (A) and IGFR1 (B) phosphorylation was determined by Western blot of lysates from cells treated for 5 min with the indicated concentration of S1P alone, or in the presence of 10 ng/ml EGF (A) or 25 ng/ml LR3-IGF-I (B). C and D, DNA synthesis stimulated by EGF (C) or LR3-IGF-I (D) in the absence (open symbols) or presence (closed symbols) of 1000 nm S1P was determined as described under “Experimental Procedures.” Data are mean ± S.E. of one experiment of representative of three performed in quadruplicate, where thymidine incorporation in the absence of EGF or LR3-IGF-I is expressed as 100% (% control). a, p < 0.05 compared with the same concentration of EGF or LR3-IGF-I in the absence of S1P. E, DNA synthesis stimulated by the indicated concentration of S1P of in the absence (white bars) or presence of 1 μm AG1478 (EGFR tyrosine kinase inhibitor, black bars) or AG1024 (IGFR1 tyrosine kinase inhibitor, shaded bars) was determined as described under “Experimental Procedures.” Data are mean ± S.E. of one experiment representative of three performed in quadruplicate, where thymidine incorporation in the absence of S1P or inhibitors is expressed as 100% (% control). a, p < 0.05 compared with control (no S1P); b, p < 0.01 compared with the same concentration of S1P in the absence of inhibitor.
S1P, IGFBP-3, and Receptor Transactivation
Exogenous S1P can induce transactivation of EGFR (28, 33, 34). To investigate whether the intrinsic activity of S1P (Fig. 7) might reflect transactivation of growth factor receptors, S1P stimulation was carried out in the presence of the EGFR tyrosine kinase inhibitor AG1478, or the IGFR1 inhibitor AG1024, but in the absence of exogenous growth factors. As shown in Fig. 7E, S1P alone elicited a dose-dependent stimulatory effect on DNA synthesis at concentrations up to 1000 nm. In the presence of either AG1024 or AG1478, S1P-stimulated DNA synthesis was inhibited, with a greater effect apparent with AG1024 than AG1478. In addition, AG1024 but not AG1478, inhibited basal DNA synthesis in the absence of exogenous S1P, consistent with our data shown in Fig. 2 (C and D) that suggest a role for basal SphK activity and endogenous S1P in IGFR1 activation. Similar results were obtained with a second inhibitor of EGFR kinase activity, gefitinib (data not shown). Attempts to perform these experiments in cells where IGFR1 expression was silenced using siRNA were unsuccessful due to poor cell attachment and significant cell death when the expression of the receptor was reduced (data not shown).
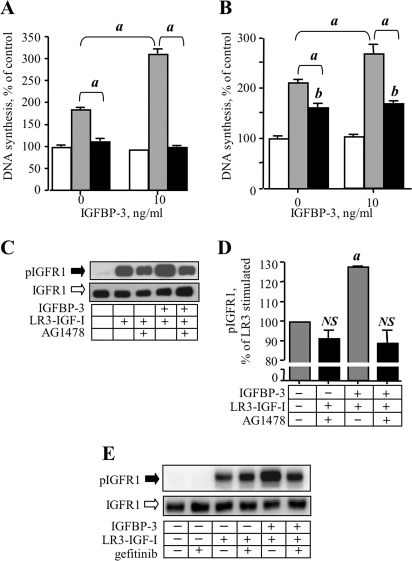
The data shown in Fig. 7E indicated that inhibition of either EGFR or IGFR1 kinase activity abrogated the stimulatory effect of S1P, implying significant cross-talk of these receptor signaling systems in MCF-10A cells. To investigate this in the context of IGFBP-3 modulation of growth factor receptor signaling, the effect of inhibiting EGFR kinase activity on IGFBP-3-potentiation of LR3-IGF-I-stimulated IGFR1 phosphorylation was examined. DNA synthesis was determined in cells treated with LR3-IGF-I and IGFBP-3 alone or in the presence of AG1478, the EGFR kinase inhibitor. We confirmed that EGF-stimulated DNA synthesis and potentiation of this by IGFBP-3 were completely inhibited by AG1478 (Fig. 8A). As shown in Fig. 8B, AG1478 partially inhibited DNA synthesis stimulated by LR3-IGF-I alone, and completely abolished the potentiation of LR3-IGF-I-stimulated DNA synthesis seen in the presence of IGFBP-3. Similarly, potentiation of LR3-IGF-I-stimulated IGFR1 phosphorylation by IGFBP-3 was reversed by AG1478 (Figs. 8C). The slight inhibitory effect of AG1478 on LR3-IGF-I-stimulated IGFR1 activation in the absence of IGFBP-3 (Fig. 8C), was not significant when quantified over three experiments (Fig. 8D). A second EGFR kinase inhibitor, gefitinib, confirmed the results obtained with AG1478 (Fig. 8E), with potentiation of LR3-IGF-I-stimulated IGFR1 activation by IGFBP-3 reversed by 10 μm gefitinib. These experiments suggest that transactivation of IGFR1 by EGF receptor is required for enhancement of ligand-stimulated IGFR1 activation by IGFBP-3.
FIGURE 8.
EGFR kinase inhibition abrogates IGFBP-3 potentiation of LR3-IGF-I-stimulated DNA synthesis and IGFR1 activation. DNA synthesis was determined in MCF-10A cells treated without or with 10 ng/ml IGFBP-3 as indicated, and A, 1 ng/ml EGF (shaded bars) or EGF and the EGFR kinase inhibitor, AG1478 (1 μm, black bars) or B, 10 ng/ml LR3-IGF-I (shaded bars) or LR3-IGF-I and AG1478 (black bars). For A and B, data are expressed as % of control (no addition) and are mean ± S.E. of quadruplicate determinations in one experiment representative of three for each. a, p < 0.001; b, p < 0.01 compared with control (i.e. open bars). C, MCF-10A cells were preincubated with IGFBP-3 for 16 h, then AG1478 (1 μm final) was added for 1 h. LR3-IGF-I was added to give a final concentration of 25 ng/ml, cells were lysed 5 min later by addition of Laemmli buffer, and lysates were subjected to Western analysis of total and phosphorylated IGFR1. The blot shown is one of three giving identical results. D, quantification of Western blot data from three experiments expressed as a percentage of LR3-IGF-I-stimulated IGFR1 phosphorylation. a, p < 0.05 compared with LR3-IGF-I-stimulated; NS, not significantly different from LR3-IGF-I alone (by ANOVA). E, MCF-10A cells were preincubated with IGFBP-3 for 16 h, then gefitinib (EGFR kinase inhibitor, 10 μm final) was added for 1 h prior to stimulation with LR3-IGF-I as described for C. The blot shown is representative of two experiments.
Endogenous IGFBP-3 Enhances Ligand-stimulated EGFR and IGFR1 Activation
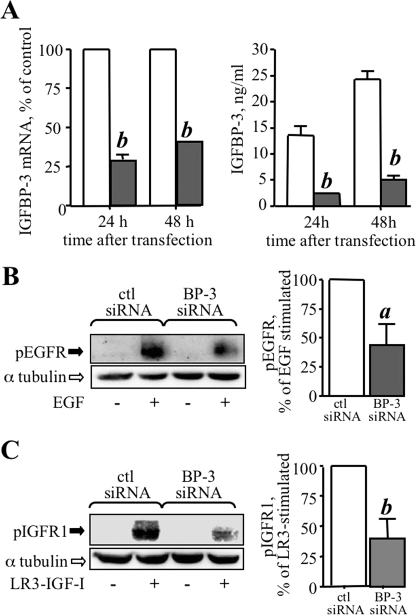
A high level of expression of IGFBP-3 is associated with increased growth in a number of malignancies (8–13). We investigated potentiation of EGFR and IGFR1 signaling by endogenous IGFBP-3 as a possible underlying mechanism for this by silencing its expression in MCF-10A cells and determining the effect on EGF- or LR3-IGF-I-stimulated receptor activation. As shown in Fig. 9A, IGFBP-3 gene expression was reduced 60–70%, and IGFBP-3 protein levels were reduced by 80–90%, following transfection with siRNA targeting IGFBP-3. Analysis of EGF-stimulated EGFR phosphorylation (Fig. 9B) and LR3-IGF-I-stimulated IGFR1 phosphorylation (Fig. 9C) in IGFBP-3-silenced cells revealed that the activation of both receptors by their respective ligands was significantly decreased when endogenous IGFBP-3 expression was attenuated, compared with non-silencing siRNA. These data indicate that endogenous IGFBP-3 enhances activation of EGFR and IGFR1 stimulated by their ligands, and suggest tonic sensitization of these receptors to their respective ligands by endogenous IGFBP-3.
FIGURE 9.
siRNA-mediated silencing of endogenous IGFBP-3 attenuates ligand-stimulated EGFR and IGFR1 activation. A, MCF-10A cells were transfected with control siRNA duplexes (open bars), or siRNA targeting IGFBP-3 (shaded bars), as described under “Experimental Procedures.” IGFBP-3 gene expression (A, left) was determined 24 and 48 h later by qRT-PCR of total RNA, and IGFBP-3 protein expression (A, right) by radioimmunoassay of cell-conditioned medium as described under “Experimental Procedures.” B and C, ctl siRNA and IGFBP-3 siRNA-transfected cells were changed to serum-free medium 24 h after transfection, and 24 h later cells were stimulated with EGF (10 ng/ml, B) or LR3-IGF-I (25 ng/ml, C) for 5 min. Harvested lysates were analyzed for EGFR phosphorylation (B) or IGFR1 phosphorylation (C) by Western blot, with α-tubulin analyzed as loading control. Quantification of pooled data from three experiments, corrected for α-tubulin, is indicated at the right of B and C, with the IGFBP-3 siRNA data expressed relative to control siRNA. a, p < 0.05, b, p < 0.01 compared with control, by ANOVA.
DISCUSSION
Despite well documented growth-inhibitory and apoptotic activity in many cell types (3, 4, 35), IGFBP-3 is associated with growth stimulation in a variety of in vitro and in vivo models (14–16, 36, 37). In a number of cancers, IGFBP-3 protein or gene expression levels correlate with tumor size or a malignant phenotype (8–11, 13, 20, 38), implying not only that cells may be resistant to antiproliferative and apoptotic effects of IGFBP-3, but may also be growth-stimulated by IGFBP-3. Indeed, we and others have described cell models where IGFBP-3 bioactivity undergoes a switch from antiproliferative to proliferative (36, 39) or pro-apoptotic to antiapoptotic (19, 40). Understanding the mechanisms underlying this switch, and IGFBP-3's growth stimulatory and survival activity, are particularly important in light of suggestions that IGFBP-3 may constitute a novel therapy for the treatment of some malignancies (41, 42).
Enhancement of growth factor activity by IGFBP-3 was first described by the authors' laboratory two decades ago, when it was shown that preincubation with IGFBP-3 enhanced subsequent IGF-I-stimulated DNA synthesis in human skin fibroblasts (14). This observation was later confirmed in bovine fibroblasts (15), and the demonstration of enhancement of IGF bioactivity in IGFBP-3-overexpressing MCF-7 breast cancer cells (16) and bovine mammary cells (43) indicated that the phenomenon was neither cell type-specific or peculiar to non-transformed cell lines. More recently, we showed that IGFBP-3 also potentiates signaling and growth effects stimulated by EGF, with no evidence of direct interaction between IGFBP-3, and EGFR or EGF (18). However, the explanation of these stimulatory effects of IGFBP-3 has remained elusive.
A clue that IGFBP-3 modulation of growth factor receptor signaling might explain, at least in part, its growth promoting effects in vivo came with our observation that xenograft tumors of T47D breast cancer cells expressing IGFBP-3, which grow faster than T47D cells that do not express IGFBP-3, have elevated tissue levels of EGFR, and exhibit increased sensitivity to EGF in vitro (36). This, taken together with the observation that the effects of IGFBP-3 on IGF-I bioactivity are also independent of direct interaction between growth factor and binding protein (15, 43, 44), prompted us to explore the possibility of a single mechanism by which IGFBP-3 enhances growth factor signaling. The data presented here support this postulate by showing that the effects of IGFBP-3 on both EGFR and IGFR1 signaling pathways are blocked when SphK1 activity is down-regulated, either pharmacologically or by RNA interference silencing of expression. Although we have previously shown that IGFBP-3 potentiates the stimulatory effect of EGF on cell growth over 7 days, as well as DNA synthesis (18), it was not possible in the present study to examine the effect of reducing SphK1 activity on 7-day cell growth, because SphK1 down-regulation or inhibition caused substantial cell death over this period (data not shown).
The involvement of the SphK system in the effects of IGFBP-3 on growth factor receptor signaling is further supported by our finding that pharmacological inhibition or reduced expression of the S1P receptors S1P1 and S1P3 abolished potentiation of EGFR activation by IGFBP-3. This suggests that S1P1 and S1P3 act in a coordinated manner to enhance EGFR signaling. By contrast, silencing of S1P2 had no effect on EGFR phosphorylation. These findings are similar to those made in various cell models investigating other functions of S1P receptors, with silencing of S1P1 or S1P3 shown to abolish endothelial cell morphogenesis (45), S1P-mediated rescue from stress-induced apoptosis in human umbilical vein endothelial cells (46), and migration of ovarian cancer cells (47). By contrast, down-regulation of S1P2 is associated with increased proliferation and/or cell survival (47), suggesting that this receptor mediates inhibitory signaling.
Direct measurement of S1P levels in conditioned media by commercial enzyme-linked immunosorbent assay was unsuccessful due to insufficient assay sensitivity. However, supporting a role for extracellular S1P in IGFBP-3 effects, we showed that medium conditioned by cells treated with IGFBP-3, but stripped to remove added or cell-derived IGFBP-3, was able to enhance EGFR phosphorylation in a manner inhibitable by S1P1 and S1P3 blockade. Furthermore, exogenous S1P mimicked the effects of IGFBP-3 on growth factor receptor signaling and bioactivity. Taken together, our data point conclusively to S1P, the product of sphingosine kinase activity, being the “missing link” that mediates potentiation of IGF and EGF receptor activity and growth stimulation by IGFBP-3.
The SphK system has been implicated in signaling involving numerous growth factor receptors with diverse function, including EGFR (23), IGFR1 (29), platelet-derived growth factor receptor (24), vascular epidermal growth factor receptor (48), and transforming growth factor-β receptor (49). Some of these effects appear to involve transactivation of growth factor receptors by S1P receptors, with consequent potentiation of downstream signaling pathways to promote cell proliferation, survival, and differentiated function (22). A number of different mechanisms appear to be involved in enhancement of growth factor receptor signaling by the S1P receptors. In MCF-7 breast cancer cells, increased EGFR activation in response to estrogen was secondary to increased SphK activity and S1P production, and required matrix metalloproteinase-activated release of heparin-binding epidermal growth factor-like growth factor, a ligand for EGFR (28). It was postulated that, in this model, heparin-binding epidermal growth factor-like growth factor release required activation of S1P3 by extracellular S1P (28). In the present study there was no evidence of activation of either EGFR or IGFR1 by IGFBP-3 in the absence of exogenous growth factor receptor ligands, arguing against IGFBP-3 inducing the release of endogenous ligands for EGFR or IGFR1 whether via SphK and S1P or independently of this system. Ligand-independent transactivation of EGFR by G-protein-coupled receptor has also been described (23) and was suggested to involve intracellular signal cross-talk, although the underlying mechanism was not described. We propose that, in our cell model, the effects of IGFBP-3 on growth factor receptor activation also involve intracellular cross-talk between growth factor receptors and S1P-stimulated S1P receptors and are mediated directly by extracellular S1P.
S1P stimulation of DNA synthesis in MCF-10A cells was reversed by inhibitors of EGFR or IGFR1 tyrosine kinase activity, and importantly, IGFBP-3 potentiation of LR3-IGF-I-stimulated IGFR1 activation was also prevented by EGFR kinase inhibitors. This suggests that there is significant cross-talk between these signaling receptors and pathways in these cells, and specifically, that EGF receptor transactivation by IGFBP-3 is required for the potentiating effect of IGFBP-3 on IGFR1 signaling. Consistent with the findings of the present study, IGF-stimulated phosphorylation of p44/42 mitogen-activated protein kinase was blocked by an EGFR tyrosine kinase inhibitor (ZD1839 or gefitinib) in normal breast epithelial cells (50). Of note, however, the effects of IGF-I were not blocked by ZD1839 in mammary fibroblasts or MCF-7 breast cancer cells (50), implying the existence of complex cell type-specific mechanisms regulating receptor transactivation. Interestingly, that study also showed that IGFR1 and EGFR co-precipitated from breast epithelial cell lysates, suggesting physical interaction between the two receptors.
It remains unclear how IGFBP-3 regulates expression of SphK1 in MCF-10A cells. Granata et al. (20) suggested that IGFBP-3 stimulation of SphK1 expression in human umbilical vein endothelial cells was secondary to increased expression and release of IGF-I, but the mechanism underlying IGFBP-3's induction of IGF-I expression was not addressed. In our cell model IGFBP-3 alone did not stimulate IGFR1 phosphorylation in MCF-10A cells, excluding the release of endogenous IGFR1 ligands in response to IGFBP-3. Furthermore, by contrast with the very rapid (within 5 min) increase in SphK expression in response to IGFBP-3 in human umbilical vein endothelial cells (19), we found no significant effect of IGFBP-3 gene expression at time points earlier than 3 h in MCF-10A cells, protein expression was not elevated until 6 h after stimulation with IGFBP-3, and SphK1 activity was not significantly increased until after 10 h of treatment with IGFBP-3. Our observations are similar to a prolonged time-course reported for increased SphK expression and activity in response to estradiol in MCF-7 breast cancer cells (51), attributed to genotropic rather than non-genotropic actions of estradiol. Interestingly, we found that, whereas expression of SphK1 was reduced to unstimulated levels 24 h after addition of IGFBP-3, SphK1 enzyme activity remained high at this time point. This is likely to reflect a prerequisite for post-translational events, namely SphK1 phosphorylation and membrane translocation, for SphK1 enzyme activity (52) rather than simply the expression of the protein.
Our observation of down-regulation of SphK2 gene expression over the same time course is also novel, because IGFBP-3 was reported to have no effect on SphK2 expression in the studies of Granata and co-workers (19, 20), and SphK1 knock-out mice do not exhibit increased expression of SphK2 in the brain or kidney (53). Whether the differences between these studies and ours reflect cell- or tissue-specific regulation of these enzymes is not known. Nevertheless, it is interesting to note that down-regulation of SphK2 may contribute further to a growth-promoting effect of IGFBP-3, as this isoform of sphingosine kinase appears to act predominantly as a growth inhibitor and inducer of apoptosis (31). Elucidating the pathways and mediators of IGFBP-3 modulation of SphK expression is now an important goal of future research.
A significant role for endogenous IGFBP-3 in potentiating EGFR and IGFR1 signaling is supported by our data showing that silencing of IGFBP-3 expression attenuates ligand-stimulated phosphorylation of EGFR and IGFR1. This tonic stimulatory effect of endogenous IGFBP-3 may explain, at least in part, clinical and laboratory findings of a high level of expression of IGFBP-3 associated with increased tumor size or malignancy (8–11, 13, 20, 38), with the expressed IGFBP-3 promoting growth via its effects on various growth-stimulatory signaling pathways, mediated by S1P.
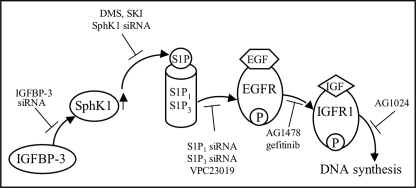
In conclusion, we have shown that IGFBP-3 stimulates expression of SphK1 in breast epithelial cells and that potentiation of EGFR and IGFR1 signaling by IGFBP-3 requires SphK1 activity and S1P1/3. EGFR kinase inhibition blocks the effects of IGFBP-3 on signaling by both growth factor receptors (Fig. 10), implicating a central role for this receptor in the effects of IGFBP-3 on growth factor receptor signaling. These findings have the potential to explain mechanistically a positive association between IGFBP-3 expression and the growth of a number of malignancies, and represent a major advance in our understanding of how IGFBP-3 can modulate signaling through a diverse range of growth-promoting and -inhibiting pathways.
FIGURE 10.
Proposed model of IGFBP-3 modulation of growth factor receptor activation mediated by S1P. IGFBP-3 up-regulates SphK1, leading to increased S1P production. S1P binds and activates S1P1 and/or S1P3, resulting in transactivation EGFR, which in turn activates IGFR1. The process can be initiated by either endogenous or exogenous IGFBP-3. Experimental interventions (inhibitors or siRNAs) that support this proposed pathway are indicated.
Acknowledgment
We thank Associate Prof. Pu Xia (Centenary Institute, Sydney) for help and advice.
This work was supported, in whole or in part, by National Health and Medical Research Council Grant 302153 (to J. L. M. and R. C. B.). This work was also supported by a Cancer Institute New South Wales Career Development and Support Fellowship (to J. L. M.) and a Cancer Institute New South Wales Early Career Award (to E. M.).
- IGFBP-3
- insulin-like growth factor-binding protein 3
- DMS
- N,N-dimethylsphingosine
- EGF
- epidermal growth factor
- EGFR
- EGF receptor/ErbB1
- IGF
- insulin-like growth factor
- IGFR1
- type 1 IGF receptor
- LR3-IGF-I
- long Arg3-IGF-I
- SKI
- 2-(p-hydroxyanilino)-4-(p-chlorophenyl)thiazole
- SphK
- sphingosine kinase
- S1P
- sphingosine 1-phosphate
- S1P1–3
- S1P receptors 1, 2, and 3
- siRNA
- small interference RNA
- qRT
- quantitative reverse transcription
- ANOVA
- analysis of variance.
REFERENCES
- 1.Firth S. M., Baxter R. C. (2002) Endocrine Rev. 23, 824–854 [DOI] [PubMed] [Google Scholar]
- 2.Butt A. J., Firth S. M., King M. A., Baxter R. C. (2000) J. Biol. Chem. 275, 39174–39181 [DOI] [PubMed] [Google Scholar]
- 3.Butt A. J., Fraley K. A., Firth S. M., Baxter R. C. (2002) Endocrinology 143, 2693–2699 [DOI] [PubMed] [Google Scholar]
- 4.Bhattacharyya N., Pechhold K., Shahjee H., Zappala G., Elbi C., Raaka B., Wiench M., Hong J., Rechler M. M. (2006) J. Biol. Chem. 281, 24588–24601 [DOI] [PubMed] [Google Scholar]
- 5.Liu B. R., Lee H. Y., Weinzimer S. A., Powell D. R., Clifford J. L., Kurie J. M., Cohen P. (2000) J. Biol. Chem. 275, 33607–33613 [DOI] [PubMed] [Google Scholar]
- 6.Schedlich L. J., O'Han M. K., Leong G. M., Baxter R. C. (2004) Biochem. Biophys. Res. Commun. 314, 83–88 [DOI] [PubMed] [Google Scholar]
- 7.Lee K. W., Ma L., Yan X., Liu B., Zhang X. K., Cohen P. (2005) J. Biol. Chem. 280, 16942–16948 [DOI] [PubMed] [Google Scholar]
- 8.Yu H., Levesque M. A., Khosravi M. J., Papanastasiou D. A., Clark G. M., Diamandis E. P. (1996) British J. Cancer 74, 1242–1247 [DOI] [PMC free article] [PubMed] [Google Scholar]
- 9.Rocha R. L., Hilsenbeck S. G., Jackson J. G., Lee A. V., Figueroa J. A., Yee D. (1996) J. Natl. Cancer Inst. 88, 601–606 [DOI] [PubMed] [Google Scholar]
- 10.Singh D., Febbo P. G., Ross K., Jackson D. G., Manola J., Ladd C., Tamayo P., Renshaw A. A., D'Amico A. V., Richie J. P., Lander E. S., Loda M., Kantoff P. W., Golub T. R., Sellers W. R. (2002) Cancer Cell 1, 203–209 [DOI] [PubMed] [Google Scholar]
- 11.Yamazaki K., Sakamoto M., Ohta T., Kanai Y., Ohki M., Hirohashi S. (2003) Oncogene 22, 847–852 [DOI] [PubMed] [Google Scholar]
- 12.Okami J., Simeone D. M., Logsdon C. D. (2004) Cancer Res. 64, 5338–5346 [DOI] [PubMed] [Google Scholar]
- 13.Kettunen E., Anttila S., Seppanen J. K., Karjalainen A., Edgren H., Lindstrom I., Salovaara R., Nissen A. M., Salo J., Mattson K., Hollmen J., Knuutila S., Wikman H. (2004) Cancer Gen. Cytogenet. 149, 98–106 [DOI] [PubMed] [Google Scholar]
- 14.DeMellow J. S., Baxter R. C. (1988) Biochem. Biophys. Res. Commun. 156, 199–204 [DOI] [PubMed] [Google Scholar]
- 15.Conover C. A. (1992) Endocrinology 130, 3191–3199 [DOI] [PubMed] [Google Scholar]
- 16.Chen J. C., Shao Z. M., Sheikh M. S., Hussain A., LeRoith D., Roberts C. J., Fontana J. A. (1994) J. Cell. Physiol. 158, 69–78 [DOI] [PubMed] [Google Scholar]
- 17.Martin J. L., Baxter R. C. (1999) J. Biol. Chem. 274, 16407–16411 [DOI] [PubMed] [Google Scholar]
- 18.Martin J. L., Weenink S. M., Baxter R. C. (2003) J. Biol. Chem. 278, 2969–2976 [DOI] [PubMed] [Google Scholar]
- 19.Granata R., Trovato L., Garbarino G., Taliano M., Ponti R., Sala G., Ghidoni R., Ghigo E. (2004) FASEB J. 18, 1456–1458 [DOI] [PubMed] [Google Scholar]
- 20.Granata R., Trovato L., Lupia E., Sala G., Settanni F., Camussi G., Ghidoni R., Ghigo E. (2007) J. Thromb. Haemostasis 5, 835–845 [DOI] [PubMed] [Google Scholar]
- 21.Xia P., Gamble J. R., Wang L., Pitson S. M., Moretti P. A., Wattenberg B. W., D'Andrea R. J., Vadas M. A. (2000) Curr. Biol. 10, 1527–1530 [DOI] [PubMed] [Google Scholar]
- 22.Spiegel S., Milstien S. (2003) Nat. Rev. Molec. Cell Biol. 4, 397–407 [DOI] [PubMed] [Google Scholar]
- 23.Daub H., Weiss F. U., Wallasch C., Ullrich A. (1996) Nature 379, 557–560 [DOI] [PubMed] [Google Scholar]
- 24.Rosenfeldt H. M., Hobson J. P., Milstien S., Spiegel S. (2001) Biochem. Soc. Trans. 29, 836–839 [DOI] [PubMed] [Google Scholar]
- 25.Basolo F., Elliott J., Tait L., Chen X. Q., Maloney T., Russo I. H., Pauley R., Momiki S., Caamano J., Klein-Szanto A. J., Koszalka M., Russo J. (1991) Mol. Carcinogen. 4, 25–35 [DOI] [PubMed] [Google Scholar]
- 26.Firth S. M., Ganeshprasad U., Poronnik P., Cook D. I., Baxter R. C. (1999) Protein Express Purif. 16, 202–211 [DOI] [PubMed] [Google Scholar]
- 27.Baxter R. C., Martin J. L. (1986) J. Clin. Invest. 78, 1504–1512 [DOI] [PMC free article] [PubMed] [Google Scholar]
- 28.Sukocheva O., Wadham C., Holmes A., Albanese N., Verrier E., Feng F., Bernal A., Derian C. K., Ullrich A., Vadas M. A., Xia P. (2006) J. Cell Biol. 173, 301–310 [DOI] [PMC free article] [PubMed] [Google Scholar]
- 29.El-Shewy H. M., Johnson K. R., Lee M. H., Jaffa A. A., Obeid L. M., Luttrell L. M. (2006) J. Biol. Chem. 281, 31399–31407 [DOI] [PubMed] [Google Scholar]
- 30.Forbes B. E., Hartfield P. J., McNeil K. A., Surinya K. H., Milner S. J., Cosgrove L. J., Wallace J. C. (2002) Eur. J. Biochem. 269, 961–968 [DOI] [PubMed] [Google Scholar]
- 31.Spiegel S., Milstien S. (2007) J. Biol. Chem. 282, 2125–2129 [DOI] [PubMed] [Google Scholar]
- 32.Salomone S., Potts E. M., Tyndall S., Ip P. C., Chun J., Brinkmann V., Waeber C. (2008) Br. J. Pharmacol. 153, 140–147 [DOI] [PMC free article] [PubMed] [Google Scholar]
- 33.Kim J. H., Song W. K., Chun J. S. (2000) IUBMB Life 50, 119–124 [DOI] [PubMed] [Google Scholar]
- 34.Tanimoto T., Lungu A. O., Berk B. C. (2004) Circ. Res. 94, 1050–1058 [DOI] [PubMed] [Google Scholar]
- 35.Oh Y., Muller H. L., Lamson G., Rosenfeld R. G. (1993) J. Biol. Chem. 268, 14964–14971 [PubMed] [Google Scholar]
- 36.Butt A. J., Martin J. L., Dickson K. A., McDougall F., Firth S. M., Baxter R. C. (2004) J. Clin. Endocrinol. Metab. 89, 1950–1956 [DOI] [PubMed] [Google Scholar]
- 37.Murphy L. J., Molnar P., Lu X., Huang H. (1995) J. Mol. Endocrinol. 15, 293–303 [DOI] [PubMed] [Google Scholar]
- 38.Hansel D. E., Rahman A., House M., Ashfaq R., Berg K., Yeo C. J., Maitra A. (2004) Clin. Cancer Res. 10, 6152–6158 [DOI] [PubMed] [Google Scholar]
- 39.Firth S. M., Fanayan S., Benn D., Baxter R. C. (1998) Biochem. Biophys. Res. Commun. 246, 325–329 [DOI] [PubMed] [Google Scholar]
- 40.McCaig C., Perks C. M., Holly J. M. (2002) J. Cell Sci. 115, 4293–4303 [DOI] [PubMed] [Google Scholar]
- 41.Perks C., Holly J. (2003) Horm. Metab. Res. 35, 828–835 [DOI] [PubMed] [Google Scholar]
- 42.Ali O., Cohen P., Lee K. W. (2003) Horm. Metab. Res. 35, 726–733 [DOI] [PubMed] [Google Scholar]
- 43.Grill C. J., Cohick W. S. (2000) J. Cell. Physiol. 183, 273–283 [DOI] [PubMed] [Google Scholar]
- 44.Conover C. A., Bale L. K., Durham S. K., Powell D. R. (2000) Endocrinology 141, 3098–3103 [DOI] [PubMed] [Google Scholar]
- 45.Lee M. J., Thangada S., Claffey K. P., Ancellin N., Liu C. H., Kluk M., Volpi M., Sha'afi R. I., Hla T. (1999) Cell 99, 301–312 [DOI] [PubMed] [Google Scholar]
- 46.Kwon Y. G., Min J. K., Kim K. M., Lee D. J., Billiar T. R., Kim Y. M. (2001) J. Biol. Chem. 276, 10627–10633 [DOI] [PubMed] [Google Scholar]
- 47.Wang D., Zhao Z., Caperell-Grant A., Yang G., Mok S. C., Liu J., Bigsby R. M., Xu Y. (2008) Mol. Cancer Ther. 7, 1993–2002 [DOI] [PMC free article] [PubMed] [Google Scholar]
- 48.Visentin B., Vekich J. A., Sibbald B. J., Cavalli A. L., Moreno K. M., Matteo R. G., Garland W. A., Lu Y., Yu S., Hall H. S., Kundra V., Mills G. B., Sabbadini R. A. (2006) Cancer Cell 9, 225–238 [DOI] [PubMed] [Google Scholar]
- 49.Xin C., Ren S., Kleuser B., Shabahang S., Eberhardt W., Radeke H., Schafer-Korting M., Pfeilschifter J., Huwiler A. (2004) J. Biol. Chem. 279, 35255–35262 [DOI] [PubMed] [Google Scholar]
- 50.Ahmad T., Farnie G., Bundred N. J., Anderson N. G. (2004) J. Biol. Chem. 279, 1713–1719 [DOI] [PubMed] [Google Scholar]
- 51.Sukocheva O. A., Wang L., Albanese N., Pitson S. M., Vadas M. A., Xia P. (2002) Mol. Endocrinol. 17, 2002–2012 [DOI] [PubMed] [Google Scholar]
- 52.Pitson S. M., Moretti P. A., Zebol J. R., Lynn H. E., Xia P., Vadas M. A., Wattenberg B. W. (2003) EMBO J. 22, 5491–5500 [DOI] [PMC free article] [PubMed] [Google Scholar]
- 53.Allende M. L., Sasaki T., Kawai H., Olivera A., Mi Y., van Echten-Deckert G., Hajdu R., Rosenbach M., Keohane C. A., Mandala S., Spiegel S., Proia R. L. (2004) J. Biol. Chem. 279, 52487–52492 [DOI] [PubMed] [Google Scholar]


