Abstract
It has been known for some time that many tumors have a significantly different conductivity and permittivity from surrounding normal tissue. This high “contrast” in tissue electrical properties, occurring between a few kilohertz and several megahertz, may permit differentiating malignant from benign tissues. Here we show the ability of electrical impedance spectroscopy (EIS) to roughly localize and clearly distinguish cancers from normal tissues and benign lesions. Localization of these lesions is confirmed by simultaneous, in register digital breast tomosynthesis (DBT) mammography or 3-D mammograms.
Index Terms: Breast cancer detection, digital breast tomosynthesis (DBT) mammography, electrical impedance spectroscopy (EIS), electrical impedance tomography (EIT)
I. INTRODUCTION
Electrical impedance properties have been used to discriminate between healthy and cancerous breast tissue [1]. Electrical impedance tomography (EIT) is a noninvasive imaging modality that estimates the electrical properties of the interior of a body from measurements made on its surface. Typically, currents are injected into the body through electrodes placed on its surface and the resulting electrode voltages are measured. Because the electrical properties of many breast tumors are different from those of surrounding normal tissue, a fact that has been known for seven decades [2], imaging these tissue properties may provide useful diagnostic information. Surowiec et al. [3] studied the conductive and dielectric properties of freshly-excised ductal and lobular carcinomas and found them markedly different from adjacent tissue in an in vitro impedance cell. These findings are consistent with those in many other organs, and may be due to the higher water content of tumors, compared to normal tissue [4]. Other studies of excised breast tumors have shown similar results. Swarup et al. [5] studied the dielectric properties of mouse MCA1 fibrosarcoma tumors between 10 and 100 kHz, and found significant differences between the tumor and the surrounding normal tissue. Breast lesions which may appear similar to carcinomas, along with cancers and normal tissues were also studied in vitro by Morimoto et al. [6].
Further delineation of the spectral characteristics of excised breast tissue was provided by Jossinet and Schmitt [1] and by Estrela et al. [7] who measured complex admittivity in a range of frequencies from 0.5 to 1000 kHz. They excised samples of normal tissues (mammary glandular, connective, and adipose tissue), and three pathological groups (general mastopathy, fibroadenoma, and carcinoma). Data were then analyzed by plotting the admittivity spectra and extracting specific parameters from these spectra. These parameters could be combined to yield quantitative, statistically significant discrimination among the tissue groups. In particular, the carcinoma tissues could be uniquely distinguished from other tissues by two or more of the extracted parameters.
Several research groups have reported in vivo breast tumor diagnosis systems based on electrical impedance measurements [8]–[12]. In 1999, the U.S. Food and Drug Administration (FDA) approved an instrument designed in Israel, called T-Scan [13], for use as an adjunctive diagnostic instrument in cases with ambiguous mammographic findings [14]. Relatively little technical information about the T-Scan system was provided in the FDA report. Limited further technical detail can be found in Assenheimer et al. [13].
In order to achieve a higher sensitivity and specificity for breast cancer diagnosis, we have built a high performance impedance imaging system and reconstruction algorithms [15]–[22] for the breast specifically for use in conjunction with mammography. This system reconstructs approximations to the conductivity and permittivity inside the breast over a broad frequency band, at high speed, and displays these properties in 3-D. The system has been designed with radiolucent electrodes [23], permitting simultaneous X-ray and electrical study of breast cancer patients. Regional impedance spectroscopy is acquired simultaneously and in register with digital breast tomosynthesis (DBT) mammography at Massachusetts General Hospital. This paper reports our initial findings that show an ability of electrical impedance tomography (EIT) to localize and distinguish some cancers from normal tissues in vivo. The findings are verified by simultaneous, in register DBT, and by pathology reports of tissue biopsied on the same day.
II. REGISTRATION WITH TOMOSYNTHESIS IMAGES
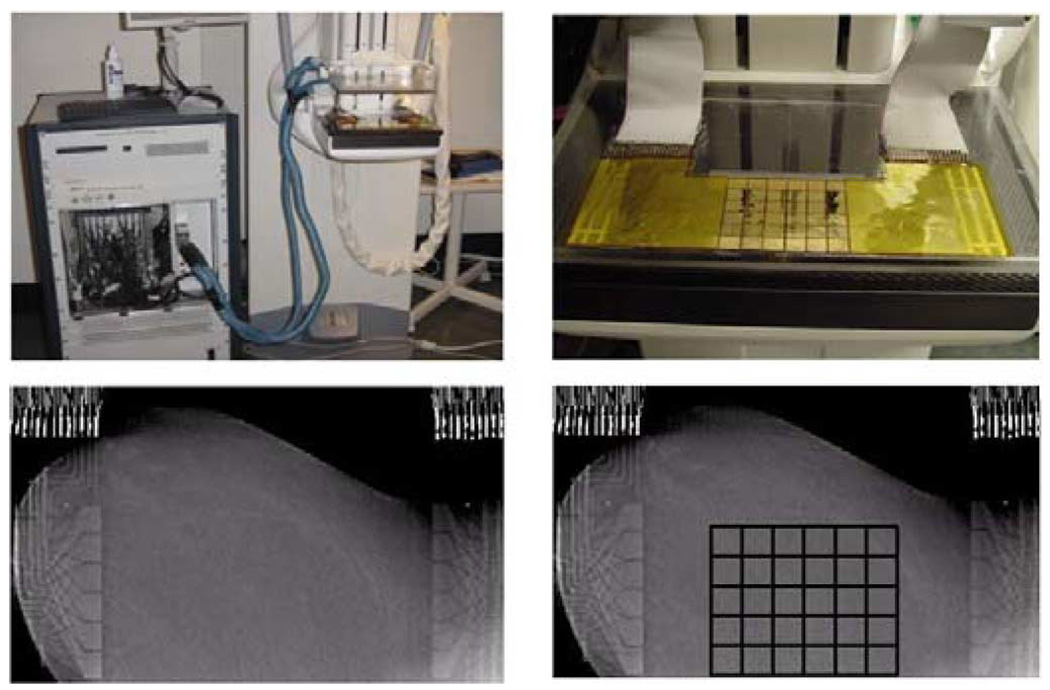
The EIT system, ACT4 [19], has 60 electrodes and can produce 3-D volume distributions of conductivity and permittivity images at a 2.5 frame/s rate using frequencies between 5 kHz and 1 MHz, presented as a series of slices. Patterns of voltages are applied to the breast using two parallel planar arrays of radiolucent electrodes [23] that are attached to the compression plates of an X-ray mammography unit [24], (Fig. 1). The 59 voltage patterns applied to produce each image are calculated from the eigenvectors of the voltage-to-current map matrix for a homogeneous admittivity field. The maximum applied voltage at any time is ±0.5 V, and a software protection system is used to report overloaded voltage sources. Further, the maximum applied voltage is reduced to ±0.25 V for current patterns of high spatial frequency when the applied voltage is at 100 kHz and above.
Fig. 1.
ACT 4 with the mammography unit (upper left), electrode array attached to the lower compression plate (upper right), one slice of the tomosynthesis image made with the electrode arrays in place on the left breast from human subject HS14 (lower left) and a tomosynthesis image with an overlaid grid showing the location of the active electrode surfaces (lower right). Note that the copper leads and ribbon cables are visible on the left and right of the tomosynthesis images but the radiolucent portion of the arrays is not visible.
To reduce the surface or contact impedance, the skin of the breast was prepared by application of PrepTrode, a commercial spray skin preparation. This fluid, which has a conductivity of about 1500 mS/m, is designed to facilitate application of electrodes to the skin.
III. RECONSTRUCTION ALGORITHMS
The reconstruction problem for EIT is to determine the electrical conductivity, σ(p, ω) and the electrical permittivity, ε(p, ω) at a point p within the body from measurements of the potential due to an applied electric field, E(p,ω), made at angular frequency ω on a portion of the surface of the body. The electric field E and magnetic field H inside a body with conductivity σ, permittivity ε, permeability μ, at angular frequency ω, satisfy Maxwell’s equations
| (1) |
Below 1 MHz we use the quasi-static approximations: ∇ × H = (σ + iωε)E and ∇ × E = 0 (see Appendix 1). Therefore, in this case, ∇ · (σ ± iωε)E = 0 and E = −∇U where U denotes the electrical potential or voltage throughout the interior of the body. Hence, in this approximation, we have that the voltage inside the body, satisfies ∇ · γ∇U = 0. On the body’s surface, S, one has
| (2) |
Here, γ denotes complex admittivity: (σ + iωε), V is the measured voltage on the surface, ν is the outward-pointing direction normal to the body’s surface, and j denotes the applied current density on the surface.
We model the region of interest within the breast as a rectangular prism, an approximation which is very useful because the potential due to applied current densitities on the top and bottom planes can be explicitly given. We have validated this geometric approximation using saline-tank experiments with a specially constructed breast-shaped tank [25]. The application of currents on the electrodes of the top plane, where z = 0, induces a current density distribution at the top plane, denoted by jt and can be written as
| (3) |
The superscript t implies the top plane, and b implies the bottom plane. The current density distribution at the bottom plane jb, where z = −h3, can be written as
| (4) |
We assume there is no current flowing through the side walls, so we can write four other boundary conditions
| (5) |
| (6) |
where, h1, h2, h3 are the dimensions of our rectangular medium: 0 ≤ x ≤ h1, 0 ≤ y ≤ h2, −h3 ≤ z ≤ 0.
Using the ave-gap electrode model [26], [27] and a rectangular geometry, we can easily compute the potential, U, due to applied current densities on the top and bottom electrode planes. See [25] for further details and a complete mathematical formulation. We then integrate this potential over the spatial extent of each electrode and divide by the electrode’s area to give the measured potential on this electrode. In future work, we plan to use the complete model [26], which includes effects of the interelectrode gaps, and surface or “contact” impedance.
The inverse problem is to determine the complex admittivity γ(x, y, z) from measurements of the potential on the electrodes resulting from applied current patterns. In fact, due to the difficulty of implementing current sources which are able to properly manage the capacitive load of our radiolucent electrode arrays, we apply voltages and measure both voltages and currents on the electrodes. In the reconstruction, we are able to synthesize the voltages that would have resulted from application of a given set of current patterns. In the solution of the inverse problem, we make use of the canonical set of current patterns [17] for our specified geometry. The applied patterns correspond to the eigenvectors of the Neumann-to-Dirichlet or current-to-voltage map in the homogeneous case.
The following steps are followed to reconstruct an approximation to the complex admittivity, γ, within the body, at each frequency.
Compute an approximation to the best homogeneous complex admittivity, γ0 [20], [22].
- Relate the potentials or fields on the surface S to the tissue electrical properties and field inside the body B by the identity
Here, the subscript 0 denotes fields due to the homogeneous admittivity γ0. The superscripts k and x denote the fields that result from different current densities. - Apply the ave-gap electrode model to convert the integrals on the left-hand side of the expression in step (2) to discrete inner products, where the subscript, l = 1,…,L, denotes the index of each electrode. The right-hand side is linearized to first order using the approximation: U = U0 + O(δγ) where δγ = γ − γ0. We then obtain an expression relating currents I and voltages V on the electrodes to moments of the potential within the medium
Measure and compute the “data” matrix D(k, x).
Choose a set of basis functions as a mesh, and use the approximation . Compute the coefficient matrix A, where .
Solve the equation δγ = (AT A + αR)−1 × AT D and display γ = δγ + γ0 on the mesh. Here, the R denotes a regularization operator and α denotes a regularization parameter [20], [22].
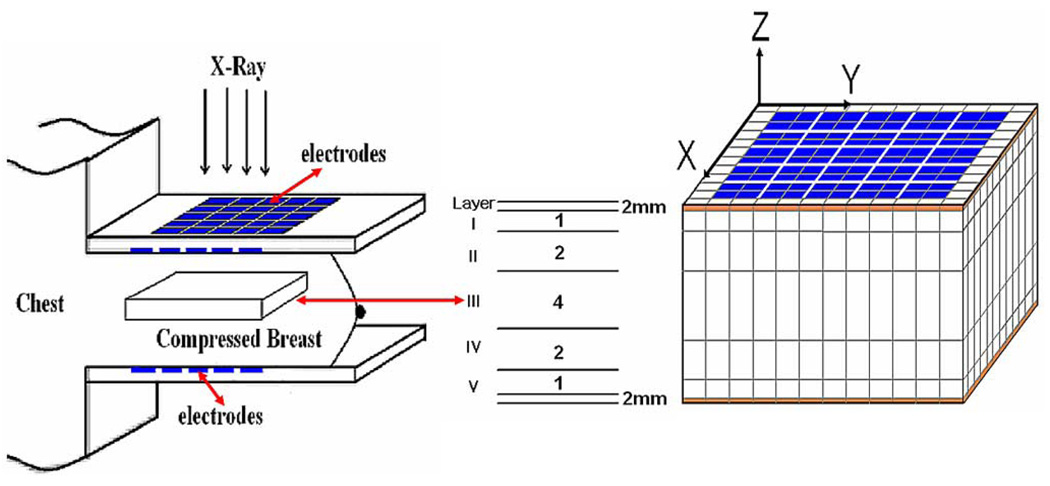
In reconstructing images from patient data, our main goal has been the development of a practical, useful, real time reconstruction algorithm [22]. To accommodate the additional ill-posedness introduced by the geometry and contact variability in the patient data, we use a reconstruction mesh with nonuniform voxel thickness, having thicker voxels at the center and thinner voxels near the electrode arrays. Fig. 2 shows the simplified geometry and the mesh for this algorithm. In addition, the reconstruction mesh extends beyond the region of interest between the electrode arrays. This margin is used to account for the unknown boundary condition presented by the different sizes and shapes of the breasts studied. These extra mesh elements are not displayed or used for data analysis. The thickness of the breast is divided into seven layers. The top and bottom layers simulate the skin tissue with 2 mm thickness which will not be shown in the displayed images. The thicknesses of the other five layers are arranged in the ratio of 1:2:4:2:1. The reason for this ratio is that the further a voxel is from the electrodes, the less its admittivity affects the data. Each electrode array consists of a 5×6 rectangular array of 10 mm × 10 mm electrodes with 1-mm gaps. Therefore, the actual region of the breast in the reconstructed image is 65 × 54 × 40 mm, 40 mm being the approximate thickness of the compressed breast.
Fig. 2.
Side view of volume and mesh elements between the arrays used in patient studies. Reconstructions from layer 3 (labeled III above) are displayed in the figures below.
This algorithm is robust and has been able to produce results that enable us to clearly distinguish malignant from benign lesions and normal tissues in the few patients studied to date. There are 30 electrodes on the top array and 30 opposite electrodes on the bottom array. This allows the maximum number of independent complex (real and imaginary) measurements to equal 1770 (30 × 59). Thus we can recover at most 1770 independent conductivities and permittivities for each frequency. The region we work with is chosen to be a rectangular solid volume bounded by the planes that contain the arrays but which extends at least one electrode width beyond the actual array. The volume is divided into 1568 rectangular boxes or voxels of varying size within which we reconstruct approximations to the electrical conductivity and permittivity. The choices of region or volume, boundary conditions, number of terms used in approximating the electrical potentials, and the dimensions and positioning of the voxels within the region of interest are critical. The parameters chosen allow us to make useful reconstructions that are as accurate as the ACT4 measurements allow, that have as many degrees-of-freedom as the number of measurements and the conditioning of the inversion problem allows, and that have small artifacts due to currents and fields that extend outside the region of interest.
IV. ANALYSIS OF PATIENT DATA
We report on a group of breast impedance distributions from a normal breast (BIRADS = 1 [28]), and breasts with the pathologies of fibroadenoma, and invasive ductal carcinomas. We show an analysis of their EIS plots and describe a parameter that appears to provide a quantitative regional indication of malignancy. (Note: BIRADS is a six-category classification system for mammographic findings. Category 1 denotes Negative which means the mammogram is normal. There is a 5/10 000 chance of cancer being present in such a patient. [29])
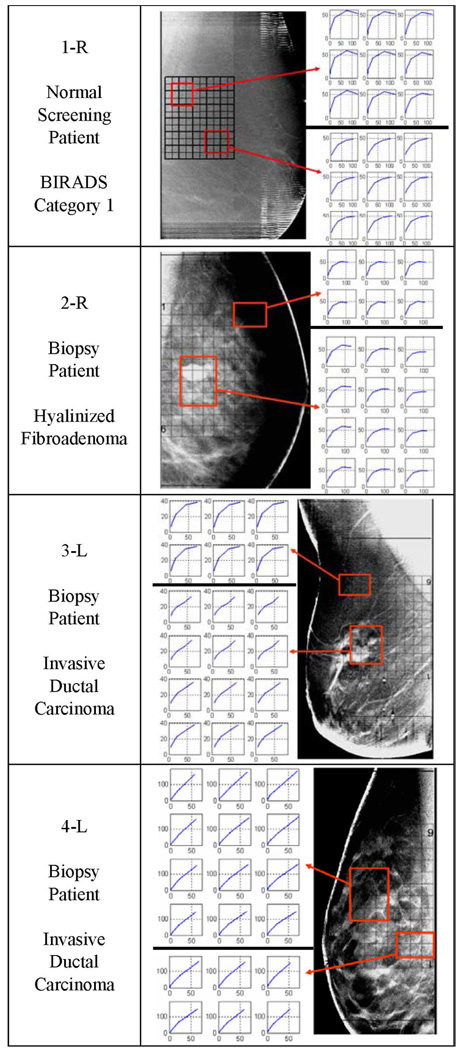
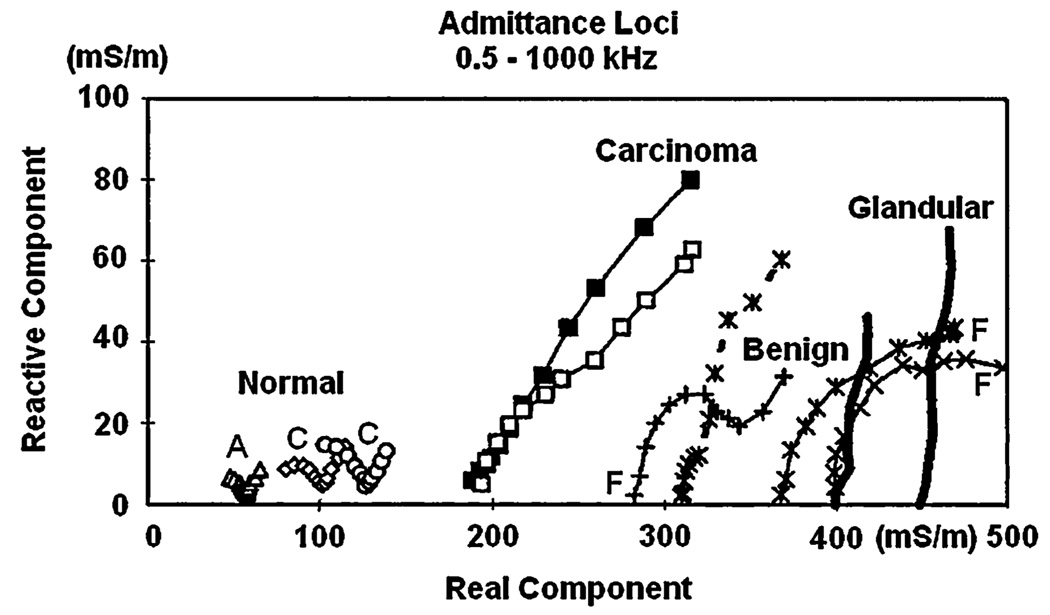
To analyze the data, we produced EIS admittivity loci reconstructed from measurements made at 5 frequencies, (5, 10, 30, 100, 300 kHz), within each voxel. Fig. 4 shows examples of these EIS loci for voxels in the center (layer III) of the regions of interest (refer to Fig. 2). Each graph plots the susceptivity [angular frequency (ω) times the reconstructed permittivity (ε)] on the vertical axis versus the reconstructed conductivities (σ) on the horizontal axis at each frequency. In this way each voxel contains a graph representing permittivity versus conductivity as a function of frequency with the same units, millisiemens/meter, on both axes. We noticed that voxels in locations corresponding to malignancies had impedance spectra that seem to approximate straight lines, whereas normal tissue had spectra that looked like arcs of a circle; benign lesions such as fibroadenoma had intermediate shapes. Fig. 4 gives examples of EIS spectra produced by our reconstruction algorithm for four breasts. These curves sometimes resemble portions of the shapes shown by Jossinet [1] in the admittance loci of excised breast tissues reproduced in Fig. 3.
Fig. 4.
Tomosynthesis images for 1-R, 2-R, 3-L, and 4-L with EIS plots for reconstructed layer 3 for the indicated regions. Each point plotted at frequency ω has coordinates (σ(ω),ωε(ω)). The scales are both in mS/m. Note that the cancer tissue produces more nearly linear EIS plots. We superimposed a grid over the tomosynthesis images to show where the reconstructed voxels are located in the breast.
Fig. 3.
Admittance loci of excised tissue samples (From Jossinet [1]).
Reconstructed EIS curves are presented from voxels within the central layer, layer 3 next to the DBT images of approximately the same plane within each breast. The locations of the array are indicated by a black grid, along with the voxels of interest selected for display.
We show four examples of patient DBT data and partial EIT plots in Fig. 4. A grid showing where the reconstructed voxels are located is superimposed over the tomosynthesis images. The EIS plots of each voxel were analyzed. The plots from two small regions of interest are displayed beside the DBT images, in the figures. The EIS plots of the normal regions, 1-R, 2-R, and the ROI_1 at the top of the 3-L plot, are all shown as arcs with good curvature. The EIS plots of the fibroadenoma region resemble normal tissue. The plots of the invasive ductal carcinoma region, the bottom plots of 3-L and both the plots for 4-L resemble straight lines. Particularly in the plots of 3-L, the plots in the normal region resemble arcs, with significant curvature arcs and the plots in the abnormal region are close to straight lines.
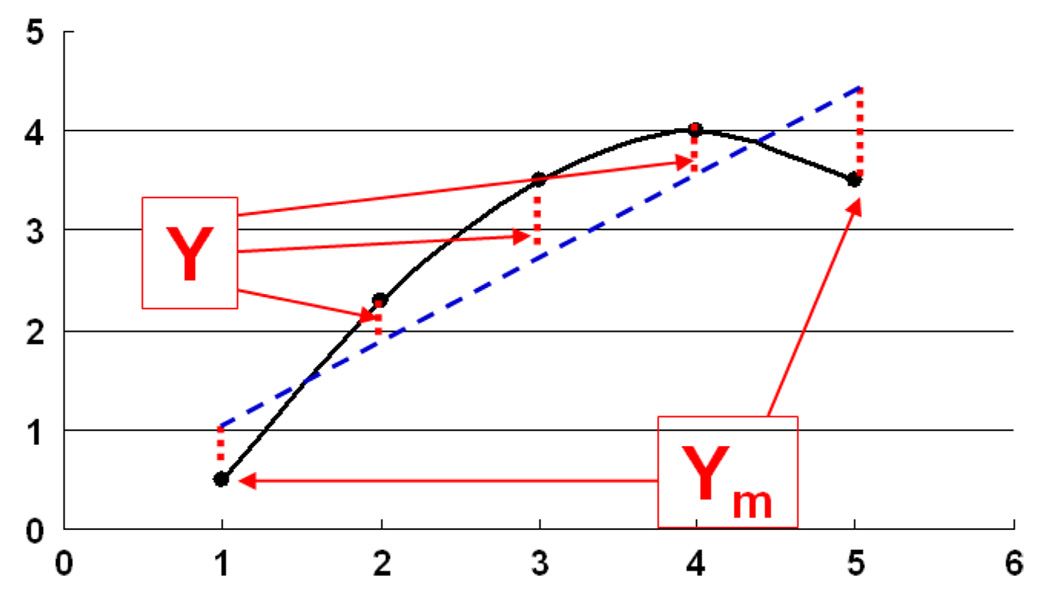
Based on these qualitative observations, we hypothesized that EIS graphs of malignant tissue should be highly correlated with straight lines. We tested this hypothesis by making a gray scale image for each patient of how correlated the EIS curve in each voxel is with a straight line. The measure of correlation is obtained by fitting the EIS curve to a line. This line is then used to predict the values of the susceptivities (vertical coordinates) denoted by the vector Y that correspond to the conductivities (horizontal coordinates). The reconstructed susceptivities are denoted by the vector Ym as shown in Fig. 5. This linear correlation measure (LCM) is defined to be
| (7) |
where < A,B > and ‖A‖ denote the inner product and norm, respectively.
Fig. 5.
A sketch of susceptivity, ωε(ω) versus conductivity σ(ω) to illustrate the LCM.
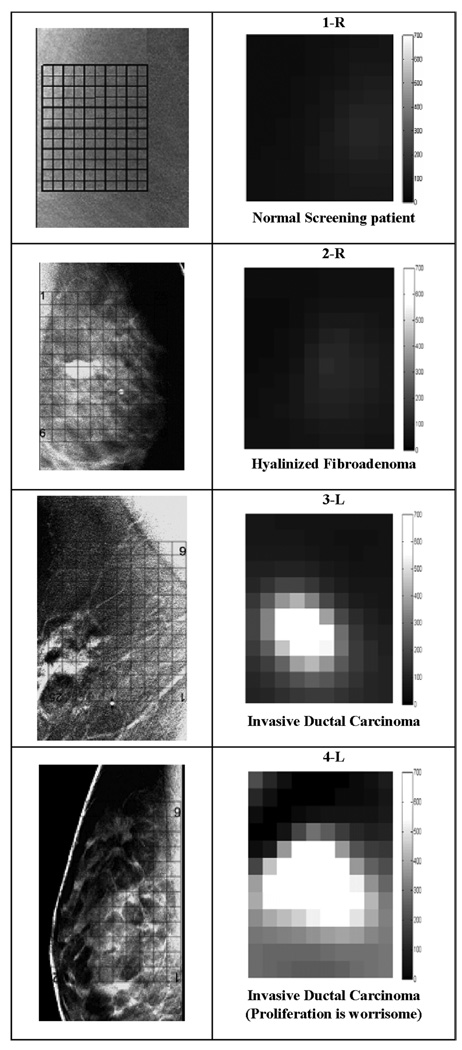
We plot this measure in gray scale so that a higher correlation with a line produces a brighter displayed voxel. We call the resulting images “LCM images” as shown in Fig. 6 on the same gray scale (0–700) for the voxels in layer 3 for each of the same four patients considered in Fig. 4. Although there are too few normals, carcinomas, and benign lesions studied to draw any statistical conclusions, it is clear that these LCM images visually distinguish malignant lesions from nonmalignant lesions and normal tissues. They also approximately localize the lesions within the low resolution of our electrode arrays and coarse meshes. These reconstructions and LCM images suggest that in this small set of patients the EIT reconstruction algorithms described above can distinguish between cancerous, normal, and benign tissue.
Fig. 6.
The zoomed Tomosynthesis images and LCM images from layer 3. Note the more linear EIS curves in Fig. 4 produce larger LCM values and, hence, brighter corresponding voxels in the LCM image. The LCM images are plotted on same gray scale, 0–700.
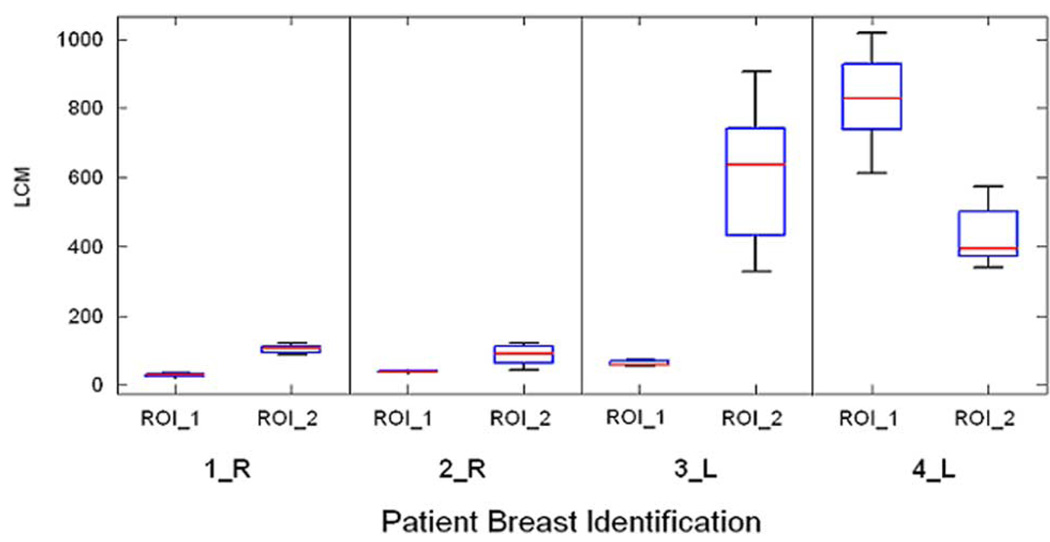
Fig. 7 shows the distributions of the LCM on the same scale for the regions of interest shown in Fig. 4. ROI_1 refers to the region of interest with the EIS graphs on the top in Fig. 4 while ROI_2 refers to those with the EIS graphs on the bottom. The LCM values in regions identified as malignant are substantially larger.
Fig. 7.
The distributions of the LCM for the regions of interest identified in Fig. 4. Note the LCM values are much larger for voxels associated with the malignant lesions. ROI_1 refers to region associated with the EIS plots at the top of Fig. 4 while ROI_2 refers to the region associated with those on the bottom.
Table I summarizes the pathology reports for the four breasts presented in Fig. 4 and Fig. 6. The cancers are graded [29] on a scale of 1 to 3: Grade 1 (low grade or well differentiated) where the cancer cells still look much like normal cells and are usually slow-growing, Grade 2 (intermediate/moderate grade or moderately differentiated) where the cancer cells do not look like normal cells and are growing somewhat faster than normal cells, and Grade 3 (high grade or poorly differentiated) where the cancer cells do not look at all like normal cells and are fast-growing.
TABLE I.
Summary of the pathology reports and the analysis of EIS plots
| Patient # | Pathology report, Grades, EIS spectra and LCM value |
|---|---|
| 1-R |
Screening patient, normal breast, BIRADS: Category 1, No biopsy report All EIS plots have good curvature. LCM < 137 for all regions. Minimum value of LCM:23 Maximum value of LCM: 137. |
| 2-R |
Hyalinized Fibroadenoma, no evidence of malignancy Most EIS Plots have good curvature. LCM < 70 for the tumor region Minimum value of LCM: 18 Maximum value of LCM: 122. |
| 3-L |
Invasive ductal carcinoma, Ductal carcinoma in-situ A few cylindrical to irregular tan-yellow soft tissue cores ranging from 0.3 to 1.2 cm in length and averaging 0.1 cm in diameter. Grade: 3/3 EIS plots on bottom right corner are abnormal. Others have good curvature. LCM > 300 for the tumor region. Minimum value of LCM:42 Maximum value of LCM: 905. |
| 4L |
Invasive ductal carcinoma, (Proliferation is worrisome) Ductal carcinoma in-situ Atypical ductal hyperplasia Tumor size: 1.1 × 0.9 × 0.7 cm and two satellite nodules, 0.14 cm and < 0.1 cm. Grade:3/3 Most EIS plots are close to a straight line. LCM > 300 for most plots. Minimum value of LCM: 4 Maximum value of LCM: 1017. |
V. DISCUSSION AND CONCLUSION
The LCM parameter that we have defined has clearly identified the three malignancies in these four patients, and no false negatives were observed. Using similar derived EIS parameters, such as the consistency of slopes between different frequencies and the distances from EIS plots to the predicted line, gives similar results. Further investigation will be needed before we are able to analyze whether the LCM is able to distinguish tumors from benign lesions and normal breast tissue in a statistically significant manner. It is premature to assert which parameter will offer the best quantitative ability to distinguish breast cancer from normal breast tissue.
The mesh used for the reconstruction algorithm in this study is coarse. The complete electrode model or a model of a layered structure to simulate skin and fat might be useful to improve the algorithm, increasing the accuracy of the estimated electrical parameters, and lead to the detection and localization of smaller malignancies.
The study of additional cancer patients conducted with improved hardware, software and algorithms will determine whether EIT can be used to improve the sensitivity and specificity of mammography. We are refining our system and reconstruction algorithm to obtain more EIT data from cancer and normal subjects, and we are investigating other parameters of EIT plots in a systematic and quantitative way in order to assess and compare their performance.
ACKNOWLEDGMENT
The authors thank Dr. H. Xia, Dr. N. Liu, and Dr. A. Ross for their excellent work in the EIT research group at RPI. The authors would also like to thank D. Scourletis, J. Cormier, D. Burgess, C. Bray, L. Ferrara, and A. Burimi for their support and dedication to collecting DBT and EIT data.
This work is supported in part by CenSSIS, the Center for Subsurface Sensing and Imaging Systems, under the Engineering Research Centers Program of the National Science Foundation under Award EEC-9986821 and in part by the National Institute of Biomedical Imaging and Bioengineering (NIBIB) under Grant Number R01-EB000456-03.
APPENDIX I
The quasi-static approximation to Maxwell’s equations is
| (A.1) |
Therefore, in this case E = −∇U, ∇·γE = 0, where U denotes the electrical potential or voltage throughout the interior of the body. Hence in this approximation, we have that the voltage inside the body, B, satisfies
| (A.2) |
Assume the homogeneous admittivity is a constant, denoted as γ0, and the resulting voltage is , using the superscript x to denote the voltage corresponding to current pattern x. The equation can be expressed as
| (A.3) |
| (A.4) |
For the inhomogeneous admittivity, denoted by γ, the voltage at the body is Uk, using the superscript k to represent the voltage corresponding to current pattern k. The equation can be expressed as
| (A.5) |
| (A.6) |
Multiply (A.3) and (A.5) by Uk and Uκ to get
| (A.7) |
Subtracting and integrating yields
| (A.8) |
| (A.9) |
By using the chain rule, (A.9) can be written as
| (A.10) |
Using the Divergence theorem on (A.10), yields
| (A.11) |
| (A.12) |
Contributor Information
Tzu-Jen Kao, Email: kaot@rpi.edu, Department of Biomedical Engineering, Rensselaer Polytechnic Institute, Troy, NY 12180 USA..
Gregory Boverman, Email: boverg@rpi.edu, Department of Biomedical Engineering, Rensselaer Polytechnic Institute, Troy, NY 12180 USA..
Bong Seok Kim, National Cancer Center, Gyeonggi-do 410-769, South Korea..
David Isaacson, Email: isaacd@rpi.edu, Department of Mathematical Sciences, Rensselaer Polytechnic Institute, Troy, NY 12180 USA.
Gary J. Saulnier, Email: saulng@rpi.edu, Department of Electrical, Computer, and Systems Engineering, Rensselaer Polytechnic Institute, Troy, NY 12180 USA..
Jonathan C. Newell, Email: newelj@rpi.edu, Department of Biomedical Engineering, Rensselaer Polytechnic Institute, Troy, NY 12180 USA..
Myoung H. Choi, Email: mhchoi@kangwon.ac.kr, Department of Electrical and Electronics Engineering, Kangwon National University, Kangwondo 200-701, Korea.
Richard H. Moore, Email: rhmoore@partners.org, Department of Radiology, Massachusetts General Hospital, Boston, MA 02114 USA..
Daniel B. Kopans, Email: dkopans@partners.org, Department of Radiology, Massachusetts General Hospital, Boston, MA 02114 USA..
REFERENCES
- 1.Jossinet J, Schmitt M. A review of parameters for bioelectrical characterization of breast tissue. Ann. NY Acad. Sci. 1999;vol. 873:30–41. doi: 10.1111/j.1749-6632.1999.tb09446.x. [DOI] [PubMed] [Google Scholar]
- 2.Fricke H, Morse S. The electric capacity of tumors of the breast. J. Cancer Res. 1926;vol. 10:340–376. [Google Scholar]
- 3.Surowiec AJ, Stuchly SS, Barr JR, Swarup A. Dielectric properties of breast carcinoma and the surrounding tissues. IEEE Trans. Biomed. Eng. 1988 Apr.vol. 35(no. 4):257–263. doi: 10.1109/10.1374. [DOI] [PubMed] [Google Scholar]
- 4.Foster KS, Schwann HP. Dielectric properties of tissues and biological materials: A critical review. Crit. Rev. Bioeng. 1989;vol. 17(no. 1):25–104. [PubMed] [Google Scholar]
- 5.Swarup A, Stuchly SS, Surowiec A. Dielectric properties of mouse MCA1 fibrosarcoma at different stages of development. Bioelectromagnetics. 1991;vol. 12(no. 1):108. doi: 10.1002/bem.2250120102. [DOI] [PubMed] [Google Scholar]
- 6.Morimoto T, Kinouchi Y, Iritani T, Kimura S, Konishi Y, Mitsuyama N, Komaki K, Monden Y. Measurement of electrical bio-impedance of breast tumors. Eur. Surg. Res. 1990;vol. 22:86–92. doi: 10.1159/000129087. [DOI] [PubMed] [Google Scholar]
- 7.da Silva JE, de Sa JPM, Jossinet J. Classification of breast tissue by electrical impedance spectroscopy. Med. Biol. Eng. Comput. 2000;vol. 38:26–30. doi: 10.1007/BF02344684. [DOI] [PubMed] [Google Scholar]
- 8.Cherepenin V, Karpov A, Korjenevsky A, Kornienko V, Mazaletskaya A, Mazourov D, Meister D. A 3D electrical impedance tomography (EIT) system for breast cancer detection. Physiol. Meas. 2001;vol. 22:9–18. doi: 10.1088/0967-3334/22/1/302. [DOI] [PubMed] [Google Scholar]
- 9.Hartov A, Mazzarese RA, Reiss FR, Kerner TE, Osterman KS, Williams DB, Paulsen KD. A multichannel continuously selectable multifrequency electrical impedance spectroscopy measurement system. IEEE Trans. Biomed. Eng. 2000 Jan.vol. 47(no. 1):49–58. doi: 10.1109/10.817619. [DOI] [PubMed] [Google Scholar]
- 10.Kerner TE, Paulsen KD, Hartov A, Soho SK, Poplack SP. Electrical impedance spectroscopy of the breast: clinical results in 26 subjects. IEEE Trans. Med. Imag. 2002 Jun.vol. 21(no. 6):638–645. doi: 10.1109/tmi.2002.800606. [DOI] [PubMed] [Google Scholar]
- 11.Korjenevsky AV, Cherepenin VA, Karpov AY, Kornienko VN, Kultiasov YS. An electrical impedance tomography system for 3-D breast tissues imaging. Proc. XI Int. Conf. Electrical Bio-Impedance; Oslo, Norway. 2001. pp. 403–407. [Google Scholar]
- 12.Osterman KS, Kerner TE, Williams DB, Hartov A, Poplack S, Paulsen KD. Multifrequency electrical impedance imaging: Preliminary in-vivo experience in the breast. Physiol. Meas. 2000;vol. 21:99–109. doi: 10.1088/0967-3334/21/1/313. [DOI] [PubMed] [Google Scholar]
- 13.Assenheimer M, Malonek D, Manor D, Nahaliel U, Nitzan R, Saad A. T-SCAN as a diagnostic tool for breast cancer detection. presented at the EPSRC Conf. Proc.; London, U.K.. 2000. [DOI] [PubMed] [Google Scholar]
- 14.Summary of safety and effectiveness data, multi-frequency impedance breast scanner. Pre-market approval number P970033 U.S. Food Drug. Admin. 1999. Apr. [Online]. Available: http://www.fda.gov/cdrh/pdf/p970033.html.
- 15.Cheney M, Isaacson D, Newell JC, Simske S, Goble J. NOSER: an algorithm for solving the inverse conductivity problem. Int. J. Imag. Syst. Technol. 1990;vol. 2:66–75. doi: 10.1002/ima.1850020203. [DOI] [PMC free article] [PubMed] [Google Scholar]
- 16.Ross AS, Saulnier GJ, Isaacson D, Newell JC. Current source design for electrical impedance tomography. Physiol. Meas. 2003;vol. 24(no. 2):509–516. doi: 10.1088/0967-3334/24/2/361. [DOI] [PubMed] [Google Scholar]
- 17.Kao T-J, Saulnier GJ, Isaacson D, Newell JC. Distinguishability of inhomogeneities using planar electrode arrays and different patterns of applied excitation. Physiol. Meas. 2003;vol. 24(no. 2):403–412. doi: 10.1088/0967-3334/24/2/352. [DOI] [PubMed] [Google Scholar]
- 18.Isaacson D, Mueller JL, Siltanen S, Newell JC. Reconstructions of chest phantoms by the D-bar method for electrical impedance tomography. IEEE Trans. Med. Imag. 2004 Jul.vol. 23(no. 7):821–828. doi: 10.1109/TMI.2004.827482. [DOI] [PubMed] [Google Scholar]
- 19.Saulnier GJ, Liu N, Tamma C, Xia H, Kao T-J, Newell JC, Isaacson D. An electrical impedance spectroscopy system for breast cancer detection. Proc. 29th Ann Int. Conf. IEEE Eng. Med. Biol. Soc.; 2007. Aug. pp. 4154–4157. [DOI] [PubMed] [Google Scholar]
- 20.Kao T-J, Kim BS, Isaacson D, Newell JC, Saulnier GJ. Reducing boundary effects in static EIT imaging. Physiol. Meas. 2006 May;vol. 27(no. 5):81–S91. doi: 10.1088/0967-3334/27/5/S02. [DOI] [PMC free article] [PubMed] [Google Scholar]
- 21.Kao T-J, Newell JC, Isaacson D, Saulnier GJ. A 3-D reconstruction algorithm for electrical impedance tomography using handheld probe for breast cancer detection. Physiol. Meas. 2006 May;vol. 27(no. 5):S1–S11. doi: 10.1088/0967-3334/27/5/S01. [DOI] [PMC free article] [PubMed] [Google Scholar]
- 22.Choi MH, Kao T-J, Isaacson D, Saulnier GJ, Newell JC. A reconstruction algorithm for breast cancer imaging with electrical impedance tomography in mammography geometry. IEEE Trans. Biomed. Eng. 2007 Apr.vol. 54(no. 4):700–710. doi: 10.1109/TBME.2006.890139. [DOI] [PMC free article] [PubMed] [Google Scholar]
- 23.Kao T-J, Saulnier GJ, Xia H, Tamma C, Newell JC, Isaacson D. A compensated radiolucent electrode array for combined EIT and mammography. Physiol. Meas. 2007;vol. 28:S291–S299. doi: 10.1088/0967-3334/28/7/S22. [DOI] [PMC free article] [PubMed] [Google Scholar]
- 24.Dobbins JT, III, Godfrey DJ. Digital x-ray tomosynthesis: Current state of the art and clinical potential. Phys. Med. Biol. 2003;vol. 48(no. 19):65–106. doi: 10.1088/0031-9155/48/19/r01. [DOI] [PubMed] [Google Scholar]
- 25.Boverman G, Kao T-J, Kulkarni R, Kim BS, Isaacson D, Saulnier GJ, Newell JC. Robust linearized image reconstruction for multifrequency EIT of the breast. IEEE Trans. Biomed. Imag. 2008 Oct.vol. 27(no. 10):1439–1448. doi: 10.1109/TMI.2008.922187. [DOI] [PMC free article] [PubMed] [Google Scholar]
- 26.Cheng KS, Isaacson D, Newell JC, Gisser DG. Electrode models for electric current computed tomography. IEEE Trans. Biomed. Eng. 1989 Sep.vol. 36(no. 9):918–924. doi: 10.1109/10.35300. [DOI] [PMC free article] [PubMed] [Google Scholar]
- 27.Mueller JL, Isaacson D, Newell JC. A reconstruction algorithm for electrical impedance tomography data collected on rectangular electrode arrays. IEEE Trans. Biomed. Eng. 1999 Nov.vol. 46(no. 11):1379–1386. doi: 10.1109/10.797998. [DOI] [PubMed] [Google Scholar]
- 28.Kopans DB. Standardized mammography reporting. Radiol. Clin. North. Am. 1992;vol. 30:257–261. [PubMed] [Google Scholar]
- 29.Breast cancer pathology report. [Online]. Available: http://www.breast-cancer.org/pathology_report.pd. [Google Scholar]


