Abstract
We studied the metabolic responses to different dopamine (DA) concentrations elicited by four doses of D-amphetamine (AMPH, 0, 0.25, 0.5, 1.0, or 3.0 mg/kg). We compared the degree of DA release (via microdialysis) to striatal cAMP activity and whole brain maps of cerebral blood volume (rCBV) changes (via pharmacological MRI, phMRI). Results: AMPH increased DA release in the caudate/putamen (CPu) and cAMP activity in the CPu, nucleus accumbens (NAc), and medial prefrontal cortex (mPFC) in a linear dose-dependent manner (p<0.0001). The cAMP data suggests that, postsynaptically, signal transduction induced by D1 receptor is stronger than that of D2 receptor at the higher doses (1–3mg/kg). phMRI showed that, while higher doses of AMPH (3mg/kg (n=7) and 1mg/kg (n=6)) induced significant rCBV increases in the CPu and NAc, the degree of rCBV increase was much smaller with AMPH of 0.5mg/kg (n=6). In contrast, AMPH of 0.25mg/kg (n=8) induced significant rCBV decreases in the anteromedial CPu and NAc. The sign switch of rCBV in response to AMPH from low to high doses likely reflects the switching in the balance of D2/D3 stimulation versus D1/D5 stimulation. In conclusion, degree of postsynaptic signal transduction is linearly correlated to the extracellular DA concentration. However, the presynaptic binding may dominate the overall DA innervation at the lower range of DA concentration.
Keywords: dopamine, fMRI, phMRI, rCBV
INTRODUCTION
Dopamine (DA) in the brain is known to have opposite effects on the signal transduction depending on its binding to D1-like receptors (D1R) or D2-like receptors (D2R) (Greengard, 2001). The balance between the D1R and D2R tone ensures appropriate responses to environmental, cognitive and behavioral stimuli. However, it is not clear if the functional balance between D1R and D2R remains the same over a wide range of DA concentrations. For drugs such as D2 agonists, clear behavioral distinctions can be made between low and high doses based upon the interpretation of low doses leading to pre-synaptic autoreceptor or D3R binding and high doses leading to post-synaptic D2R binding. This selectivity is evidenced by the behavioral effects of low doses of D2/D3 agonists such as quinpirole, that show antagonism of amphetamine-induced locomotion, while higher doses can potentiate such behaviors (Cory-Slechta et al., 1993; Furmidge et al., 1991; Widzowski and Cory-Slechta, 1993). High doses of D2/D3 antagonists are associated different behaviors than low doses with the higher doses manifesting postsynaptically-mediated behaviors such as catalepsy (Schoemaker et al., 1997; Tidey and Bergman, 1998). In this manuscript, we investigated the neuronal response to different DA concentrations elicited by four doses of D-amphetamine (AMPH), with the degree of DA release measured using microdialysis in the striatum. Postsynaptic signal transduction to the different levels of DA concentrations was assessed by cyclic AMP (cAMP) activity. In addition to these two invasive and site-specific measurements, neuronal activity was also assessed non-invasively through a whole brain map of cerebral blood volume (rCBV) response to AMPH challenge using pharmacological MRI (phMRI). Our hypothesis was that low doses would lead to more D2-like like responses than the higher doses due to the higher affinities of the pre-synaptic D2 and D3 autoreceptors for dopamine.
Both of the D1R and D2R belong to the G-protein coupling receptor (GPCR) family. Thus G-protein and cAMP activity reflect the combined functionality of D1R and D2R (Greengard, 2001). Agonizing the D1R activates the Gαs unit and deactivates the Gαi unit to increase cAMP activity while agonizing the D2R activates the Gαi unit to decrease cAMP activity (Traynor and Neubig, 2005). Since the cAMP activity is one of the first postsynaptic reactions after receptor binding, measuring the cAMP activity in response to DA stimulation can be a surrogate marker for the net signal transduction induced by both D1R and D2R innervations. We thus would predict that the signal changes measured using MRI would correlate with cAMP activity.
Successful DA receptor stimulation often leads to “neuronal activity” that often involves oxygen consumption and the support of an adequate hemodynamic supply (Attwell and Laughlin, 2001; Hoge et al., 1999). The coupling between neuronal activity and hemodynamic response makes fMRI/phMRI a great tool in assaying brain function in vivo. For the dopaminergic system, neuronal activity along the dopaminergic circuitry can be probed using phMRI when challenged with dopamine ligand, such as the DA releaser D-amphetamine (AMPH) (Chen et al., 2004; Choi et al., 2006; Dixon et al., 2005; Jenkins et al., 2004; Preece et al., 2007; Schwarz et al., 2007). AMPH leads to BOLD or rCBV increases in the DA-rich brain areas, such as in the caudate/putamen (CPu) and nucleus accumbens (NAc) where the hemodynamic changes are correlated to synaptic DA concentrations, especially at the high DA concentrations where the correlation is near linear (Chen et al., 1997; Chen et al., 2001; Choi et al., 2006). BOLD and rCBV increases are also noted in the downstream structures such as thalamus and cortex. The validity of phMRI to monitor the function of the DA-related circuitry was demonstrated by the following facts: 1. the AMPH-induced rCBV response was abolished in the DA denervated areas (6-OHDA lesioning) and the downstream structures, 2. the diminished rCBV response to AMPH was later restored after fetal cell or stem cell transplantation (Bjorklund et al., 2002; Chen et al., 1999). Prior studies also showed that challenge of D1R agonist led to rCBV increases, reflecting neuronal excitation linked to D1 agonism, whereas challenge of D2R and D3R agonists led to rCBV decreases, possibly reflecting neuronal inhibition linked to D2 agonism (Chen et al., 2004; Choi et al., 2006). D2 and D3 antagonists increase CBV (Grundt et al., 2007). Stimulated DA release via amphetamine can also be blocked by D1 antagonism or D2 agonism and potentiated by D2 or D3 antagonism (Chen et al., 2004; Choi et al., 2006; Dixon et al., 2005; Schwarz et al., 2007). The sum of these data indicate that multifarious facets of DA neurotransmission can be monitored using phMRI. Thus, phMRI not only reveals the net functionality of dopaminergic system in living subjects but also provides complementary information to the cAMP activity measurements while at the same time providing whole-brain maps – something that is impossible with the invasive techniques. We thus used phMRI to investigate rCBV response to different DA levels elicited by four doses of AMPH.
MATERIALS AND METHODS
Animals
Male Sprague Dawley rats (300–400g, Charles River Laboratories, Wilmington, MA) were used in this study. Rats were housed and provided food and water ad libitum. All procedures were conducted in accordance with the National Institute of Health Guide for the Care and Use of Laboratory Animals (NIH Publications No. 80-23) revised 1996. For all studies, animals were anesthetized with 1% halothane in mixture gas of O2 and N2O (1:1). Core temperature was maintained by a water-heating blanket.
Drugs
D-Amphetamine sulfate was obtained from Sigma (St. Louis, MO). The dextran-coated superparamagnetic contrast agent of monocrystalline iron oxide nanoparticle (MION) was synthesized in our laboratory according to (Shen et al., 1993).
Microdialysis
Microdialysis was conducted in separate groups of rats to access DA concentration upon AMPH challenge in the CPu. In order to compare the results of microdialysis to phMRI, rats were anesthetized (halothane, 1% in 1:1 air/O2 mixture) but there was no MION injection involved in the microdialysis protocol. Rats were secured to a standard stereotaxic frame through out the whole study. Preparation for microdialysis in the CPu were carried out as previous described (Chen et al., 2004). The dialysate probe was inserted into CPu (coordinate [AP 0.48; ML 3.2; DV -7.3]) (Paxinos and Watson, 1997). Continuous infusion of artificial CSF (125 mM NaCl, 2.5 mM KCl, 1.2 CaCl2, 1.0 mM MgCl2, and 0.2 mM L-ascorbic acid at pH 7.4) was delivered at 2 µl /min for at least 1 hour to stabilize brain tissue from the probe induced trauma. Dialysate tubes were pre-filled with 5 µl of 0.5M perchloric acid and dialysates were assayed at 10 min time intervals. Dopamine concentration was measured using HPLC with electrochemical detection (ESA, Chelmsford, MA): three baseline dialysates were collected before the bolus administration of AMPH), followed by 11 post drug dialysates (110min).
Cyclic AMP (cAMP) activity
Quantitative analysis of cAMP activity upon AMPH or vehicle challenge was conducted in separate groups of rats (n=5/dose). Rats were rapidly decapitated and brains frozen in − 40°C isopentane 10 minutes after AMPH/vehicle challenge. 1 mm tissue punches were obtained with 18 gauge stylets in the CPu, NAc, medial prefrontal cortex (mPFC), and thalamus (Paxinos and Watson, 1997). Tissue was homogenized and cAMP was extracted using minicolumns containing anion exchange silca sorbents (Amprep minicolumns RPN1098, Amersham Bioscience) according to the manufacturer’s instructions. Purified tissue was then dried under a stream of Nitrogen at 60 °C and tissue net weights recorded. cAMP concentration was analyzed using “cAMP Biotrak Enzymeimmunoassay (EIA) system” (RPN225, Amersham Biosciences) following the acetylation EIA procedure according to the manufacturer’s instructions. Tissue samples and working standards (2, 4, 8, 16, 32, 64, 128 fmol of cAMP) were dispensed into a 96-well microplate to be read at 450 nm. Wells with working standards were used to generate the calibration curve (optical density (OD) versus cAMP concentration/well). The samples OD readings were then mapped onto the calibration curve for corresponding cAMP concentrations. Absolute cAMP concentration was then obtained by normalized to tissue weight. Data was analyzed by one-way or two-way ANOVA with post-hoc comparisons (Fisher’s PLSD).
Pharmacological MRI (phMRI)
phMRI experiments were conducted using a 9.4T Bruker scanner (Billerica, MA). MION (Shen et al., 1993) was used to sensitize MR signal to relative cerebral blood volume (rCBV) changes (Villringer et al., 1988) with the benefits of increased sensitivity and stability in phMRI experiments (Chen et al., 2001; Mandeville and Marota, 1999). Blood pressure and blood gas was monitored throughout the study via a femoral artery catheter. Blood oxygenation was monitored via an optical sensor clipping on the hindpaw (Pulse oximeter, Nonin Medical, MN). Rats were secured to an imaging cradle through a pair of ear bars and a ventilation mask with tooth bar. A home-made single-loop surface coil used for receiving MR signal. Since AMPH has a relatively long pharmaco-hemodynamic half-life, a conventional gradient echo sequence was used in order to trade temporal resolution for a better spatial resolution (TR 300ms, TE 6ms, matrix size 128 X 128, temporal resolution 38sec/volume, FOV 3.2cm, slice thickness 1.0mm). Without interrupting image acquisition, MION was injected after five baseline points, and AMPH was injected after at least fifteen post-MION baseline points. The repeated acquisitions ended 60–90 minutes after AMPH injection.
To facilitate comparisons between animals, all functional images were registered onto a standard template according to rat brain atlas (Paxinos and Watson, 1997) by adjusting 9 registration variables (3 spatial shifts, 3 rotation angles, and 3 skew (non-rigid) angles on the 3 major planes) using an automatic routine (courtesy of Dr. JB Mendiville) (Mandeville et al., 2005). Maps of rCBV responses were calculated on a pixel-by-pixel basis as described in (Chen et al., 2004; Chen et al., 2001; Mandeville et al., 2004; Mandeville et al., 2001). Statistical P-value of the fitting of the rCBV time courses to a gamma function (t *exp(-t/τ), τ̣ represents the peak time of the gamma curve) was generated on a pixel-by-pixel basis using “general linear model” (GLM) (using a C program, courtesy of Dr. JB Mandeville). Map of peak rCBV amplitude was generated and masked by the P-value of GLM fitting (P<10−7). Regions of interesting (ROIs) were segmented by superimposing rat brain atlas (Paxinos and Watson, 1997) onto our registered images to analyze dose effect of rCBV time courses from key brain areas. Blood pressure data was used as a regressor to evaluate the correlation between rCBV and blood pressure (BP) changes. Both activation map and ROI analysis were performed on individual study and at the group level.
RESULTS
DA release
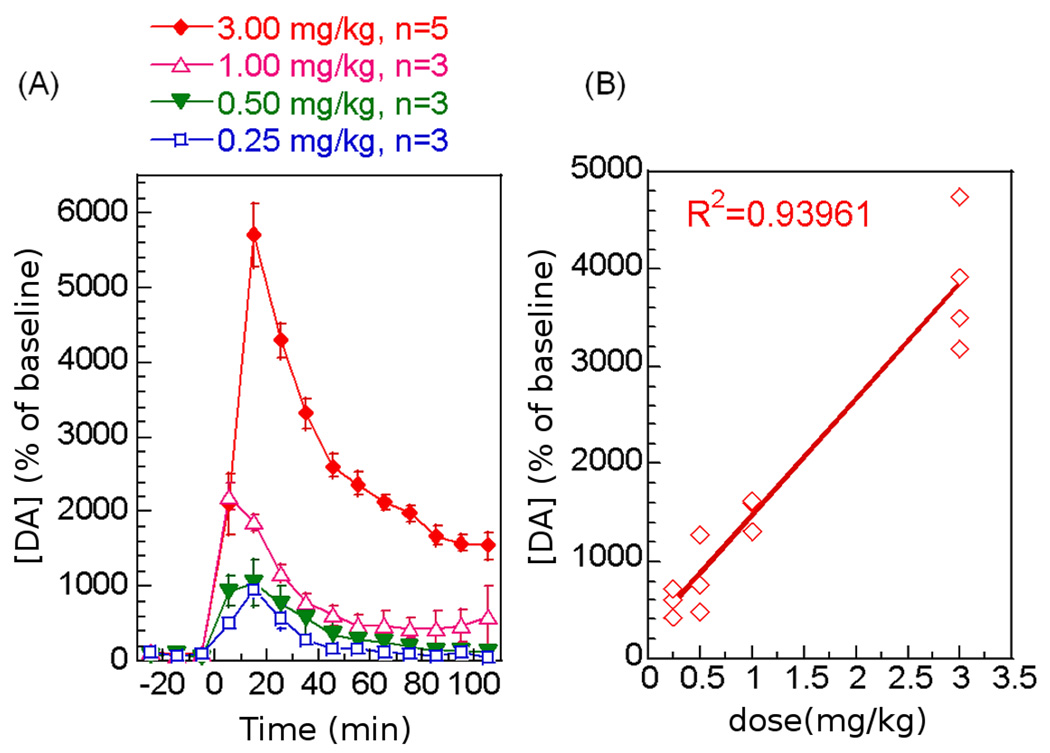
The degree of the striatal DA release in response to the four intravenous (iv) doses of AMPH was studied using microdialysis and HPLC. All doses of AMPH induced significant DA increases in the CPu (Figure 1A) in a dose-dependent manner (Figure 1B, one-way ANOVA, p<0.0001). Interestingly, except for the lowest AMPH dose (0.25mg/kg), the DA level remained above the basal level for more than 110 minutes (Table 1) in a dose-dependent manner (one-way ANOVA, p<0.0001). The persistent elevation of DA may reflect inefficient recycling of DA due to a saturated binding of the dopamine transporter protein (DAT) when the synaptic DA level is high.
Figure 1.
Dopamine release in the CPu in response to four intravenous doses of AMPH. (A) Time course of DA release upon AMPH challenge (percent of baseline ± Std. Err). (B) The linear correlation between AMPH dose and DA release.
Table 1.
DA release, percent of basal level (%)
| AMPH dose | [DA] (%) peak value |
[DA](%) residue (60–110 minutes) |
|---|---|---|
| 0.25mg/kg iv | 964±107 | 100 ± 11 |
| 0.50mg/kg iv | 1069±301 | 201 ± 49 |
| 1.00mg/kg iv | 2204±177 | 484 ± 219 |
| 3.00mg/kg iv | 5706±413 | 2060 ± 100 |
| One-way ANOVA (dose effect) |
p<0.0001 | p<0.0001 |
cAMP activity
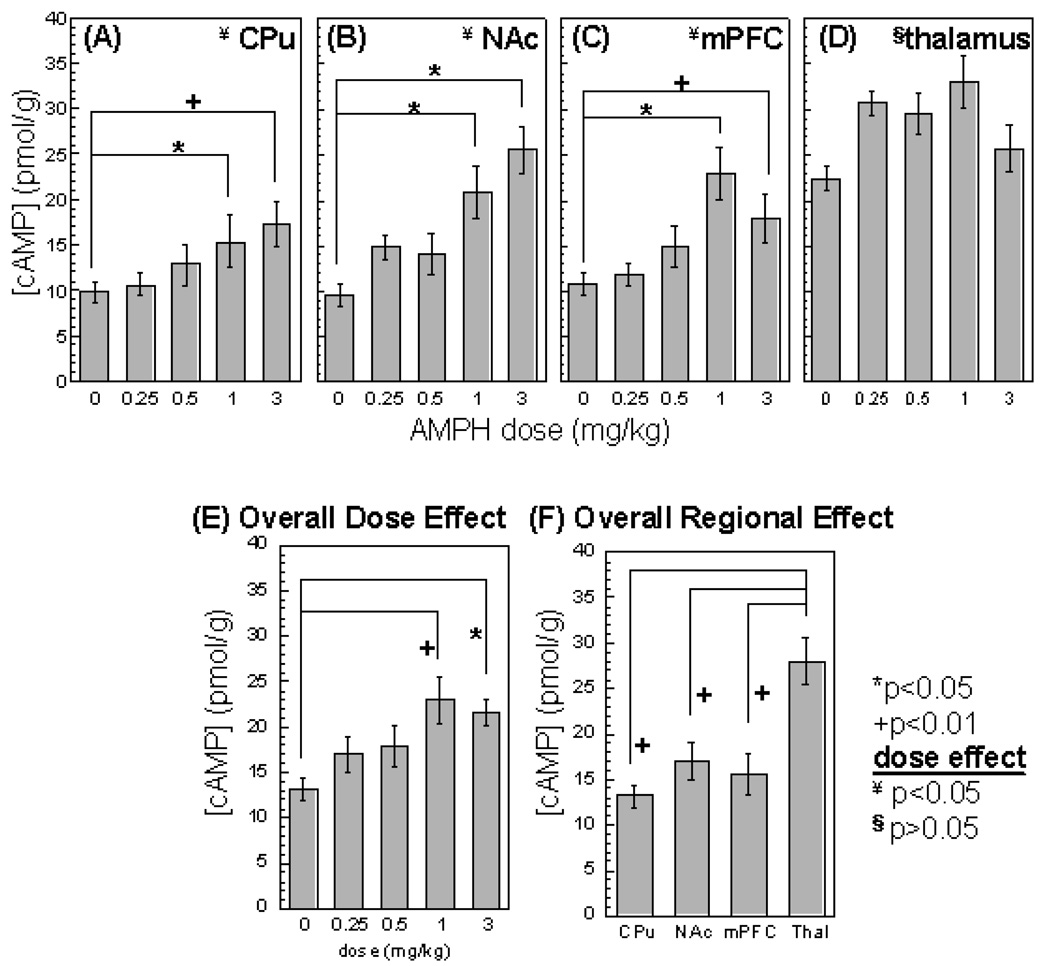
cAMP activity was significantly increased by AMPH in a dose-dependent manner in the CPu, NAc, and mPFC (one-way ANOVA, p<0.05, Figure 2A–C; post-hoc Tukey test shows that only the 1 and 3mg/kg doses caused significant changes in cAMP). In the thalamus, although all doses of AMPH led to increases in cAMP activity, there was no dose-dependent effect. Two-way ANOVA also showed an overall dose effect (Figure 2E, p<0.005) and an overall regional effect (Figure 2F, p<0.0001).
Figure 2.
cAMP activity in response to four intravenous AMPH doses and vehicle challenge. cAMP activity was measured from (A) CPu, (B)NAc, (C) mPFC, and (D) thalamus. When combined all four structures together, cAMP activity showed an overall dose effect of AMPH (E). There is also an overall regional effect of AMPH on cAMP activity (F). (mean ± Std. Err). Pair-wise comparison: *p<0.05; +p<0.01; Overall dose effect (one-way ANOVA): ¥p<0.05, §p>0.05.
rCBV response
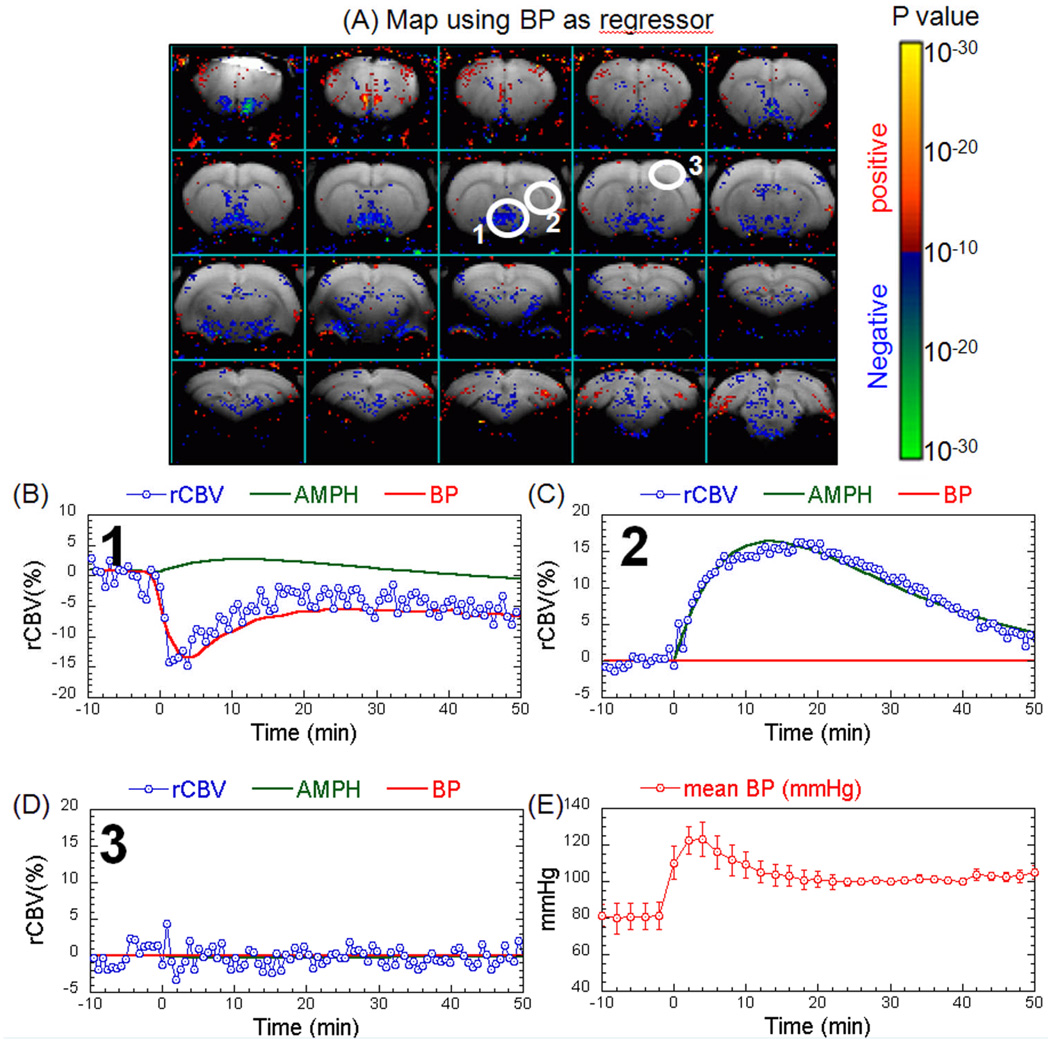
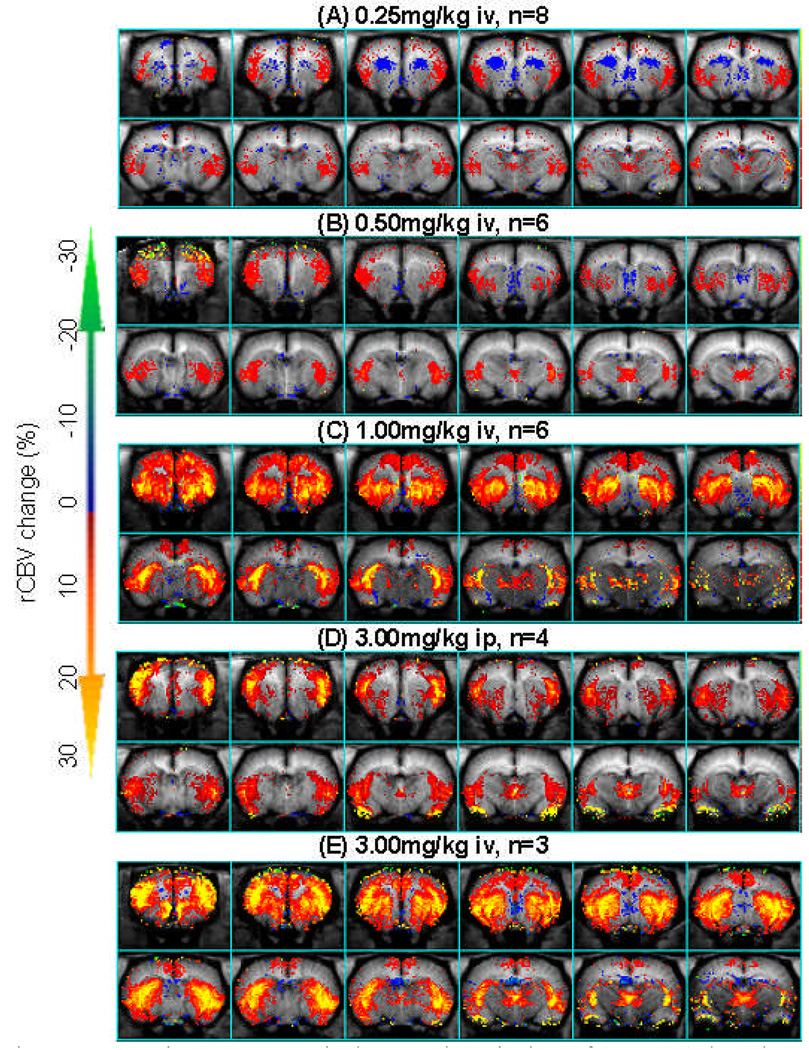
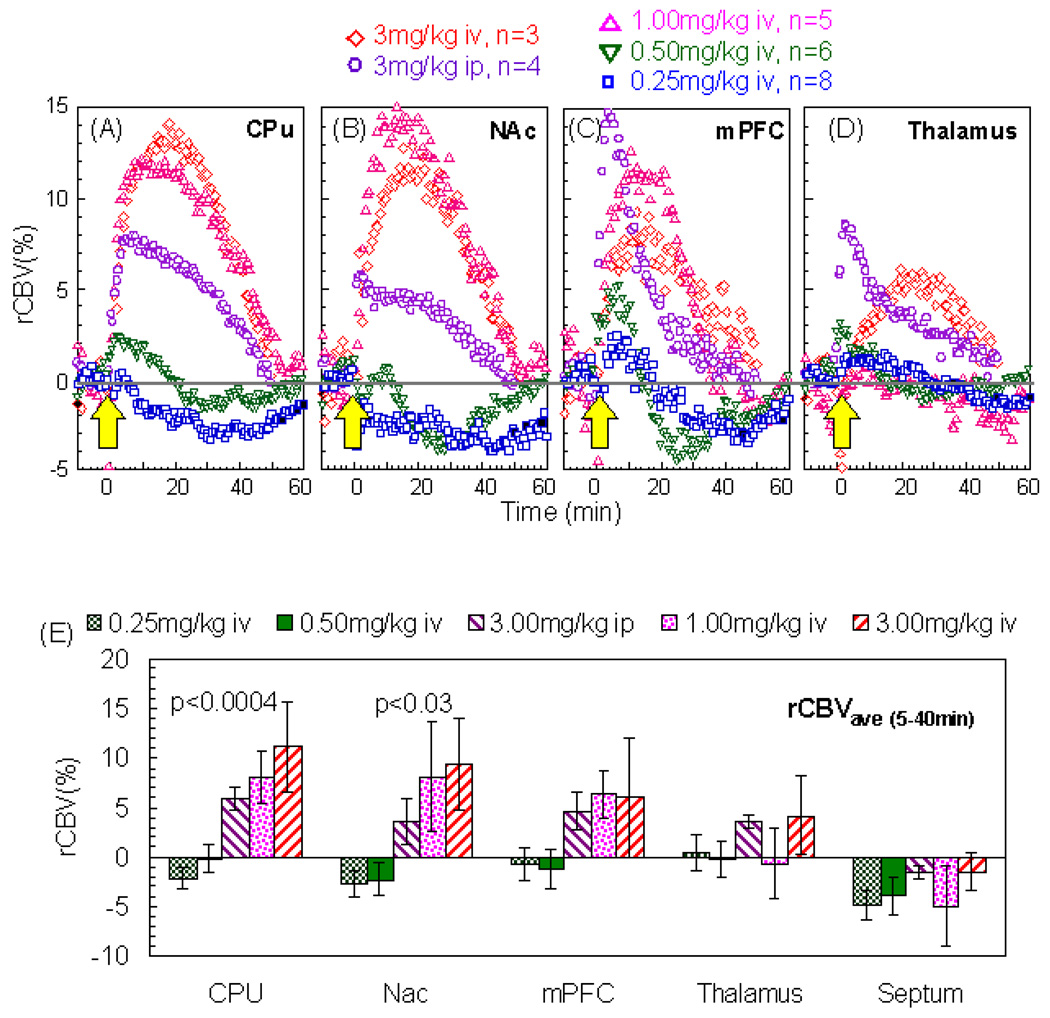
Using phMRI, we studied the rCBV response to four intravenous (iv) doses (0.25, 0.5, 1, 3 mg/kg) and one intraperitoneal (ip) dose (3mg/kg) of AMPH. The three lower doses produced no significant changes in blood pressure (BP). As we have published previously (Chen et al. 1997), there was a transient increase in BP with 3.0 mg/kg AMPH that was significantly shorter than the CBV time course induced by AMPH. We used the BP data as a regressor in the GLM to look for brain regions that significantly correlated with the BP changes. There was one region in the hypothalamic area that responded to BP (region 1 in Figure 3). As expected, the dopaminergic brain regions, such as the CPu, did not show any effects of BP (region 2 in Figure 3). Regions that did not respond to amphetamine also showed no response to BP (region 3 in Figure 3). These data point out one more advantage of the IRON technique over the BOLD technique. To evaluate the hemodynamic responses to AMPH challenge, rCBV time courses were fit to a gamma function (τ = 21 minutes) using GLM on a pixel-by-pixel basis. Figure 4 shows the amplitude of the gamma fit, representing the peak rCBV value responding to AMPH challenge. The rCBV maps were masked by the significance of GLM fitting (P<10−10). All AMPH doses significantly increased rCBV in the insulate cortex and thalamus. In the caudate/putamen (CPu), AMPH at the higher dose regimen induced greater rCBV increases that also covered a broader area in the CPu. Interestingly, AMPH of 0.25mg/kg significantly decreased rCBV in the antero-medial CPu while increasing it in the posterior-lateral CPu. rCBV time courses from CPu, NAc, mPFC, and thalamus are shown in Figure 5A–D. We further quantified rCBV responses in individual animals using ROI analysis. Figure 5E showed the average rCBV response from 5 to 40 minutes after AMPH challenge. Examining the rCBV maps (Figure 4), time courses and the average rCBV responses (Figure 5), the intraperitoneal dose of 3mg/kg appears to be equivalent to an intravenous dose between 0.5 and 1 mg/kg. We then calculated the dose-dependent effect by placing the data of 3mg/kg ip dose in the middle of those of 0.5 and 1 mg/kg iv doses. The binned rCBV values (time = 5–40 minutes post AMPH challenge) showed a dose-dependent rCBV response in the CPu and NAc (one-way ANOVA, p<0.0004 and p<0.03, respectively), but not in the mPFC, thalamus, or septum.
Figure 3.
Lack of effects of blood pressure (BP) on phMRI signal changes induced by 3mg/kg i.v. AMPH. (A) Map of brain regions that show a significant response to the transient blood pressure changes induced by 3 mg/kg amphetamine using the BP data as a regressor to the GLM. (B) Plot of the signal changes in the hypothalamic region (region 1 in Figure 3A) that correlated significantly with the BP changes. (C) Positive correlation with AMPH but not BP in the CPu (brain region 2 from Figure 1A). (D) Lack of correlation with either AMPH or BP changes in cortical area 3 from Figure 1A. (E) Time course of the BP changes induced after 3mg/kg AMPH.
Figure 4.
rCBV in response to 4 iv doses and one ip dose of AMPH. Color scheme indicates the peak value of rCBV response to AMPH challenge. The rCBV maps were masked by the significance of GLM fitting (GLM, P<10−10).
Figure 5.
rCBV time courses from (A) CPu, (B) NAc, (C) mPFC, and (D) thalamus. (E) Comparison of binned rCBV responses (time = 5–40 minutes post AMPH challenge) to the AMPH doses (mean ± Std. Err; statistics via one-way ANOVA).
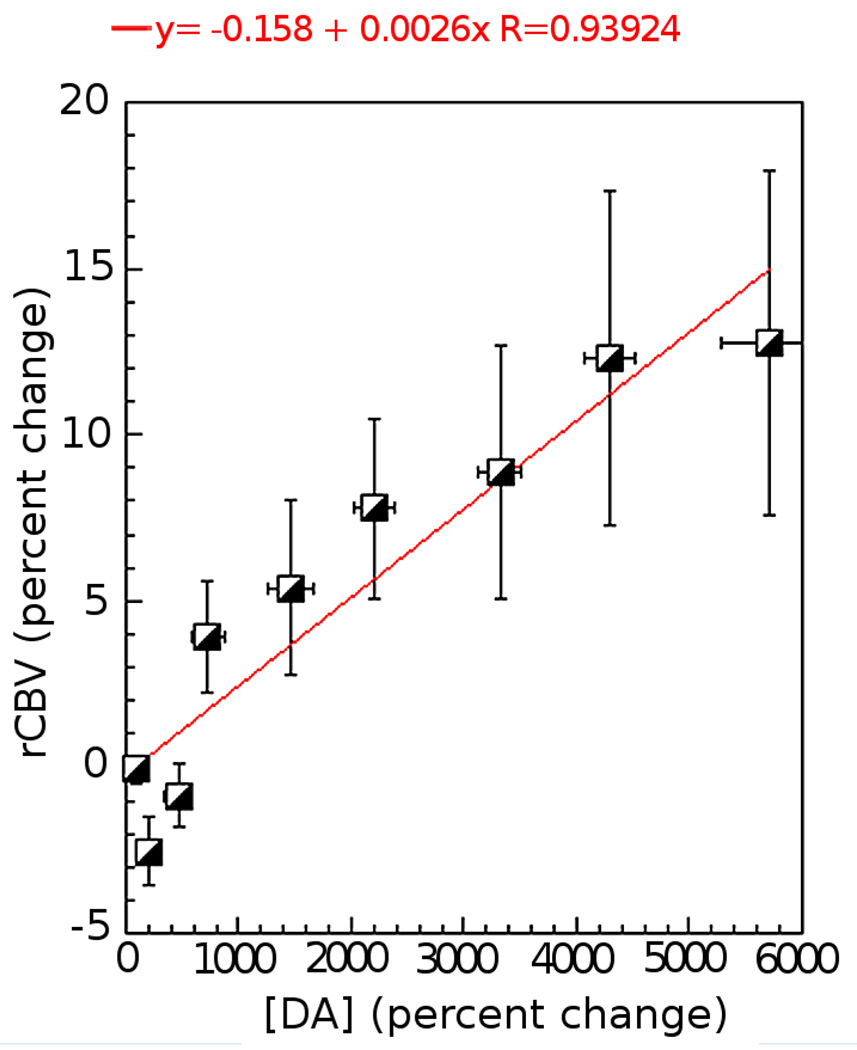
We further compared the amphetamine dose-dependent rCBV data versus the DA release measured using microdialysis. We binned the rCBV time course at the same temporal resolution as the microdialysis (10 min). Similar to our previous studies the change in rCBV with change in DA was approximately linear – especially at the higher DA concentrations (see Figure 6). At the lower increases in DA concentration the rCBV actually decreases (the effect was significant at the second point where the change in DA concentration was 220% as shown on Figure 6 (p < 0.05)).
Figure 6.
Compare the degree of rCBV changes versus the DA release. There is a linear relationship between rCBV increases and DA concentrations, especially at the higher DA concentrations ([DA]> 1000%). At the lower increases in DA concentration ([DA]<1000%), the rCBV actually decreases.
DISCUSSION
Our microdialysis results showed that all tested doses of AMPH led to DA release in the CPu in a dose-dependent manner. The increased DA levels correlated to increased cAMP activity in the CPu and NAc (R2 > 0.92). On the other hand, the rCBV responses to the same four intravenous AMPH doses showed different patterns than the cAMP activity did. Although the rCBV responses in general agreed with the cAMP activity that the higher AMPH dose led to a stronger neuronal activity, there was a decoupling between the cAMP activity and rCBV response to the lower dose of AMPH (0.25mg/kg). Since only the postsynaptic DA receptors are linked to G-protein and cAMP activity, our cAMP data suggests that D1R has a stronger influence in the postsynaptic signal transduction than D2R does at doses of AMPH above 1mg/kg (or at approximately a 1000% increase in DA). Although the apparent affinity for dopamine appears to be similar for D1 and post-synaptic D2 receptor subtypes (Sokoloff et al., 1992), the cAMP data indicates that, functionally, D1R has greater influence on the G-protein or cAMP activity than D2R does and thus linked to a positive rCBV contribution. The proportion of D1R influence increases as the DA concentration increases.
The D1R family includes D1 and D5 subtypes while the D2R receptor family includes D2, D3, and D4 subtypes. Among all of the DA receptor subtypes, the D2 autoreceptor and the D3R have highest affinity for dopamine and the D5R has higher affinity than the D1R (ki = 2300/2000/30nM for D1R/D2R/D3R) (Sokoloff et al., 1992). Thus at lower DA concentrations, we can expect higher occupancy of the D2 autoreceptors and the D3R following stimulant drug administration (Richtand et al., 2001). The presynaptic receptors (DA autoreceptor and DA transporter protein) do not couple to cAMP activity. Although there is some controversy on this topic, the D3R can act as a synthesis-modulating DA autoreceptor on the DA terminals (Aretha et al., 1995). DA thus acts as a D3 agonist to suppress DA release from the presynaptic neurons. It is possible that, at low concentration (such as induced by 0.25mg/kg AMPH), DA primarily binds to D3R and the D2 autoreceptor more than to the postsynaptic DA receptors. The presynaptic neuronal activity thus dominates the majority of the gross neuronal activity and leads to rCBV decreases. When the DA level increases (by higher dose of AMPH), the proportion of synaptic DA binding to the postsynaptic receptors increases and the postsynaptic neuronal contribution overcomes the presynaptic one and thus rCBV increases.
One interesting phenomenon is that all AMPH doses led to rCBV increases in the lateral frontal cortex, despite the sign of rCBV in the CPu. The lateral frontal cortex is considered as one of the downstream structures in the DA circuitry and receives relatively little DA innervation directly. It is plausible that the rCBV increases in the lateral frontal cortex is the consequence of a positive “postsynaptic” neuronal activity in the major DA-innervating areas, even in the case of 0.25mg/kg AMPH that had positive “postsynaptic” cAMP activity but negative overall (presumably “presynaptic”) rCBV responses. In examining the maps produced by 0.25 mg/kg AMPH, it can be seen that in the anteromedial CPu there is a decreased CBV whereas in the posterior-lateral “motor” striatum there is an increased CBV. This would accord with the greater stimulated DA overflow seen in the latter region compared to the former region (Garris et al., 1994a; Patel et al., 1992). The increased DA overflow in the latter region would thus lead to an increased CBV compared to the anteromedial CPu as we observed. These observations suggest that the posterior-lateral striatal connections to the fronto-parietal cortex are more important in driving the CBV response, consistent with the mapping of the sensory-motor cortex to this region of the CPu (Heimer et al., 1995).
One of the caveats is the direct coupling between the DA and vesculature. In addition to the receptor binding on the neurons, significant amount of DA is known to diffuse beyond synapses (Capella et al., 1993; Garris et al., 1994b) to regulate cerebrovascular smooth muscle (Edvinsson et al., 1985). It has been shown that microapplication of DA in the vicinity of larger cerebral microvessels produced vasoconstriction (Edvinsson et al., 1985; Krimer et al., 1998). However, microapplication of D1 agonist led to vesodilation (Edvinsson et al., 1985). Reverse transcription polymerase chain reaction (RT-PCR) studies for DA receptor subtypes on isolated cerebral microvessels with a size range from capillaries to aterioles with a diameter < 150µ showed only expression of D1R/D5R but not D2R/D3R (Choi et al., 2006). In addition, D3R were found abundant in endothelial cells and astrocytes but not on microvessels (Choi et al., 2006). It is likely that DA leads to vasodilation by binding to D1R on the microvessels and DA leads to vasoconstriction by binding to D3R on the glia cells to suppress the release of vasoactive molecules from astrocytes (Mulligan and MacVicar, 2004; Simard et al., 2003; Zonta et al., 2003). Again, the negative rCBV response in the CPu in response to the lower dose of AMPH (0.25mg/kg) may due to a vasoconstriction effect via D3R binding since the DA binding affinity is much higher for D3R than the other DA receptor subtypes. However, currently we are not able to separate the hemodynamic effect driven by neuronal activity or a direct neurotransmitter-vasomotor coupling.
To summarize our results, we found that all doses tested of AMPH led to DA increases in the CPu. The DA concentrations were correlated to increased cAMP activity in the CPu and NAc, in a dose-dependent manner. AMPH also led to dose-dependent rCBV changes - rCBV increases from negative to positive as the dose of AMPH increases. We conclude that at low DA levels, the combined neuronal activity is dominated by the presynaptic activity. As the DA level increases, the postsynaptic activity gradually dominates the overall neuronal activity.
Acknowledgments
Supported by : NIDA 5R01 DA16187-05 and NCCAM PO1 AT002048
Footnotes
Disclosure/Conflicts of interest: N/A
References
- Aretha CW, Sinha A, Galloway MP. Dopamine D3-preferring ligands act at synthesis modulating autoreceptors. J Pharmacol Exp Ther. 1995;274(2):609–613. [PubMed] [Google Scholar]
- Attwell D, Laughlin SB. An energy budget for signaling in the grey matter of the brain. J Cereb Blood Flow Metab. 2001;21(10):1133–1145. doi: 10.1097/00004647-200110000-00001. [DOI] [PubMed] [Google Scholar]
- Bjorklund LM, Sanchez-Pernaute R, Chung S, Andersson T, Chen YI, McNaught KS, Brownell AL, Jenkins BG, Wahlestedt C, Kim KS, Isacson O. Embryonic stem cells develop into functional dopaminergic neurons after transplantation in a Parkinson rat model. Proc Natl Acad Sci U S A. 2002;99(4):2344–2349. doi: 10.1073/pnas.022438099. [DOI] [PMC free article] [PubMed] [Google Scholar]
- Capella P, Ghasemzadeh MB, Adams RN, Wiedemann DJ, Wightman RM. Real-time monitoring of electrically stimulated norepinephrine release in rat thalamus: II. Modeling of release and reuptake characteristics of stimulated norepinephrine overflow. J Neurochem. 1993;60(2):449–453. doi: 10.1111/j.1471-4159.1993.tb03171.x. [DOI] [PubMed] [Google Scholar]
- Chen YI, Brownell AL, Galpern W, Isacson O, Bogdanov M, Beal MF, Livni E, Rosen BR, Jenkins BG. Detection of dopaminergic cell loss and neural transplantation using pharmacological MRI, PET and behavioral assessment. Neuroreport. 1999;10(14):2881–2886. doi: 10.1097/00001756-199909290-00001. [DOI] [PubMed] [Google Scholar]
- Chen YI, Choi JK, Andersen SL, Rosen BR, Jenkins BG. Mapping dopamine D2/D3 receptor function using pharmacological magnetic resonance imaging. Psychopharmacology (Berl) 2004;180(4):705–715. doi: 10.1007/s00213-004-2034-0. [DOI] [PubMed] [Google Scholar]
- Chen YI, Galpern WR, Brownell AL, Matthews RT, Bogdanov M, Isacson O, Keltner JR, Beal MF, Rosen BR, Jenkins BG. Detection of dopaminergic neurotransmitter activity using pharmacologic MRI: correlation with PET, microdialysis, and behavioral data. Magn Reson Med. 1997;38(3):389–398. doi: 10.1002/mrm.1910380306. [DOI] [PubMed] [Google Scholar]
- Chen YI, Mandeville JB, Nguyen TV, Talele A, Cavagna F, Jenkins BG. Improved mapping of pharmacologically induced neuronal activation using the IRON technique with superparamagnetic blood pool agents. J Magn Reson Imaging. 2001;14(5):517–524. doi: 10.1002/jmri.1215. [DOI] [PubMed] [Google Scholar]
- Choi JK, Chen YI, Hamel E, Jenkins BG. Brain hemodynamic changes mediated by dopamine receptors: Role of the cerebral microvasculature in dopamine-mediated neurovascular coupling. Neuroimage. 2006;30(3):700–712. doi: 10.1016/j.neuroimage.2005.10.029. [DOI] [PubMed] [Google Scholar]
- Cory-Slechta DA, Widzowski DV, Pokora MJ. Functional alterations in dopamine systems assessed using drug discrimination procedures. Neurotoxicology. 1993;14(2–3):105–114. [PubMed] [Google Scholar]
- Dixon AL, Prior M, Morris PM, Shah YB, Joseph MH, Young AM. Dopamine antagonist modulation of amphetamine response as detected using pharmacological MRI. Neuropharmacology. 2005;48(2):236–245. doi: 10.1016/j.neuropharm.2004.10.006. [DOI] [PubMed] [Google Scholar]
- Edvinsson L, McCulloch J, Sharkey J. Vasomotor responses of cerebral arterioles in situ to putative dopamine receptor agonists. Br J Pharmacol. 1985;85(2):403–410. doi: 10.1111/j.1476-5381.1985.tb08875.x. [DOI] [PMC free article] [PubMed] [Google Scholar]
- Furmidge L, Tong ZY, Petry N, Clark D. Effects of low, autoreceptor selective doses of dopamine agonists on the discriminative cue and locomotor hyperactivity produced by d-amphetamine. J Neural Transm Gen Sect. 1991;86(1):61–70. doi: 10.1007/BF01250376. [DOI] [PubMed] [Google Scholar]
- Garris PA, Ciolkowski EL, Wightman RM. Heterogeneity of evoked dopamine overflow within the striatal and striatoamygdaloid regions. Neurosci. 1994a;59(2):417–427. doi: 10.1016/0306-4522(94)90606-8. [DOI] [PubMed] [Google Scholar]
- Garris PJ, Ciolkowski EL, Pastore P, Wightman RM. Efflux of dopamine from the synaptic cleft in the nucleus accumbens of the rat brain. J Neuroscience. 1994b;14:6084–6093. doi: 10.1523/JNEUROSCI.14-10-06084.1994. [DOI] [PMC free article] [PubMed] [Google Scholar]
- Greengard P. The neurobiology of slow synaptic transmission. Science. 2001;294(5544):1024–1030. doi: 10.1126/science.294.5544.1024. [DOI] [PubMed] [Google Scholar]
- Grundt P, Prevatt KM, Cao J, Taylor M, Floresca CZ, Choi JK, Jenkins BG, Luedtke RR, Newman AH. Heterocyclic analogues of N-(4-(4-(2,3-dichlorophenyl)piperazin-1-yl)butyl)arylcarboxamides with functionalized linking chains as novel dopamine D3 receptor ligands: potential substance abuse therapeutic agents. J Med Chem. 2007;50(17):4135–4146. doi: 10.1021/jm0704200. [DOI] [PubMed] [Google Scholar]
- Heimer L, Zahm DS, Alheid GF. Basal Ganglia. In: Paxinos G, editor. The Rat Nervous System. Second ed. San Diego, CA: Academic PresS; 1995. pp. 579–628. [Google Scholar]
- Hoge RD, Atkinson J, Gill B, Crelier GR, Marrett S, Pike GB. Linear coupling between cerebral blood flow and oxygen consumption in activated human cortex. Proc Natl Acad Sci U S A. 1999;96(16):9403–9408. doi: 10.1073/pnas.96.16.9403. [DOI] [PMC free article] [PubMed] [Google Scholar]
- Jenkins BG, Sanchez-Pernaute R, Brownell AL, Chen YI, Isacson O. Mapping dopamine function in primates using pharmacologic magnetic resonance imaging. J Neurosci. 2004;24(43):9553–9560. doi: 10.1523/JNEUROSCI.1558-04.2004. [DOI] [PMC free article] [PubMed] [Google Scholar]
- Krimer LS, Muly EC, Williams GV, Goldman-Rakic PS. Dopaminergic regulation of cerebral cortical microcirculation. Nature Neurosci. 1998;1(4):286–289. doi: 10.1038/1099. [DOI] [PubMed] [Google Scholar]
- Mandeville JB, Jenkins BG, Chen YI, Choi JK, Kim YR, Belen D, Liu C, Kosofsky BE, Marota JJ. Exogenous contrast agent improves sensitivity of gradient-echo functional magnetic resonance imaging at 9.4 T. Magn Reson Med. 2004;52(6):1272–1281. doi: 10.1002/mrm.20278. [DOI] [PubMed] [Google Scholar]
- Mandeville JB, Jenkins BG, Kosofsky BE, Moskowitz MA, Rosen BR, Marota JJ. Regional sensitivity and coupling of BOLD and CBV changes during stimulation of rat brain. Magn Reson Med. 2001;45(3):443–447. doi: 10.1002/1522-2594(200103)45:3<443::aid-mrm1058>3.0.co;2-3. [DOI] [PubMed] [Google Scholar]
- Mandeville JB, Liu C, Kosofsky BE, Marota JJ. Transient signal changes in pharmacological fMRI: Effects of no interest? Miami, FL: 2005. p. 1512. [Google Scholar]
- Mandeville JB, Marota JJ. Vascular filters of functional MRI: spatial localization using BOLD and CBV contrast. Magn Reson Med. 1999;42(3):591–598. doi: 10.1002/(sici)1522-2594(199909)42:3<591::aid-mrm23>3.0.co;2-8. [DOI] [PubMed] [Google Scholar]
- Mulligan SJ, MacVicar BA. Calcium transients in astrocyte endfeet cause cerebrovascular constrictions. Nature. 2004;431(7005):195–199. doi: 10.1038/nature02827. [DOI] [PubMed] [Google Scholar]
- Patel J, Trout SJ, Kruk ZL. Regional differences in evoked dopamine efflux in brain slices of rat anterior and posterior caudate putamen. Naunyn Schmiedebergs Arch Pharmacol. 1992;346(3):267–276. doi: 10.1007/BF00173539. [DOI] [PubMed] [Google Scholar]
- Paxinos G, Watson C. The rat brain in stereotaxic coordinates. San Diego: Academic Press; 1997. [Google Scholar]
- Preece MA, Sibson NR, Raley JM, Blamire A, Styles P, Sharp T. Region-specific effects of a tyrosine-free amino acid mixture on amphetamine-induced changes in BOLD fMRI signal in the rat brain. Synapse. 2007;61(11):925–932. doi: 10.1002/syn.20442. [DOI] [PubMed] [Google Scholar]
- Richtand NM, Woods SC, Berger SP, Strakowski SM. D3 dopamine receptor, behavioral sensitization, and psychosis. Neurosci Biobehav Rev. 2001;25(5):427–443. doi: 10.1016/s0149-7634(01)00023-9. [DOI] [PubMed] [Google Scholar]
- Schoemaker H, Claustre Y, Fage D, Rouquier L, Chergui K, Curet O, Oblin A, Gonon F, Carter C, Benavides J, Scatton B. Neurochemical characteristics of amisulpride, an atypical dopamine D2/D3 receptor antagonist with both presynaptic and limbic selectivity. J Pharmacol Exp Ther. 1997;280(1):83–97. [PubMed] [Google Scholar]
- Schwarz AJ, Gozzi A, Reese T, Bifone A. In vivo mapping of functional connectivity in neurotransmitter systems using pharmacological MRI. Neuroimage. 2007;34(4):1627–1636. doi: 10.1016/j.neuroimage.2006.11.010. [DOI] [PubMed] [Google Scholar]
- Shen T, Weissleder R, Papisov M, Bogdanov A, Jr, Brady TJ. Monocrystalline iron oxide nanocompounds (MION): physicochemical properties. Magn Reson Med. 1993;29(5):599–604. doi: 10.1002/mrm.1910290504. [DOI] [PubMed] [Google Scholar]
- Simard M, Arcuino G, Takano T, Liu QS, Nedergaard M. Signaling at the gliovascular interface. J Neurosci. 2003;23(27):9254–9262. doi: 10.1523/JNEUROSCI.23-27-09254.2003. [DOI] [PMC free article] [PubMed] [Google Scholar]
- Sokoloff P, Martres MP, Giros B, Bouthenet ML, Schwartz JC. The third dopamine receptor (D3) as a novel target for antipsychotics. Biochem Pharmacol. 1992;43(4):659–666. doi: 10.1016/0006-2952(92)90227-a. [DOI] [PubMed] [Google Scholar]
- Tidey JW, Bergman J. Drug discrimination in methamphetamine-trained monkeys: agonist and antagonist effects of dopaminergic drugs. J Pharmacol Exp Ther. 1998;285(3):1163–1174. [PubMed] [Google Scholar]
- Traynor JR, Neubig RR. Regulators of G protein signaling & drugs of abuse. Mol Interv. 2005;5(1):30–41. doi: 10.1124/mi.5.1.7. [DOI] [PubMed] [Google Scholar]
- Villringer A, Rosen BR, Belliveau JW, Ackerman JL, Lauffer RB, Buxton RB, Chao YS, Wedeen VJ, Brady TJ. Dynamic imaging with lanthanide chelates in normal brain: contrast due to magnetic susceptibility effects. Magn Reson Med. 1988;6(2):164–174. doi: 10.1002/mrm.1910060205. [DOI] [PubMed] [Google Scholar]
- Widzowski DV, Cory-Slechta DA. Apparent mediation of the stimulus properties of a low dose of quinpirole by dopaminergic autoreceptors. J Pharmacol Exp Ther. 1993;266(2):526–534. [PubMed] [Google Scholar]
- Zonta M, Angulo MC, Gobbo S, Rosengarten B, Hossmann KA, Pozzan T, Carmignoto G. Neuron-to-astrocyte signaling is central to the dynamic control of brain microcirculation. Nat Neurosci. 2003;6(1):43–50. doi: 10.1038/nn980. [DOI] [PubMed] [Google Scholar]


