

Abstract
RNA conformational transformations are integral to RNA's biological functions. Further, structured RNA molecules exist as a series of dynamic intermediates in the course of folding or complexation with proteins. Thus, an understanding of RNA folding and function will require deep and incisive understanding of its dynamic behavior. However, existing tools to investigate RNA dynamics are limited. Here we introduce a powerful fluorescence polarization anisotropy approach that utilizes a rare base analog that retains substantial fluorescence when incorporated into helices. We show that 6-methylisoxanthopterin (6-MI) can be used to follow the nanosecond dynamics of individual helices. We then use 6-MI to probe the dynamics of an individual helix, referred to as P1, within the 400nt Tetrahymena group I ribozyme. Comparisons of the dynamics of the P1 helix in wild type and mutant ribozymes and in model constructs reveal a highly immobilized docked state of the P1 helix, as expected, and a relatively mobile ‘open complex’ or undocked state. This latter result rules out a model in which slow docking of the P1 helix into its cognate tertiary interactions arises from a stable alternatively docked conformer. The results are consistent with a model in which stacking and tertiary interactions of the A3 tether connecting the P1 helix to the body of the ribozyme limit P1 mobility and slow its docking, and this model is supported by cross-linking results. The ability to isolate the nanosecond motions of individual helices within complex RNAs and RNA/protein complexes will be valuable in distinguishing between functional models and in discerning the fundamental behavior of important biological species.
Introduction
It has becoming increasingly apparent that RNAs are involved in numerous complex biological processes. Interestingly, many of these processes involve dynamic rearrangements of RNA structure. Examples include the helix rearrangements in spliceosome assembly, the processive catalytic cycle of protein synthesis by the ribosome, and the multi-step self-splicing reaction carried out by more primitive RNA catalysts 1-5. RNA rearrangements are also integral to regulation of gene expression and accompany protein binding to regulatory elements and metabolite binding to riboswitches 6,7.
While powerful approaches have been developed to follow conformational transitions in RNA, including rapid chemical probing and bulk and single molecule fluorescence 3,8-10, these approaches typically follow transitions between states separated by significant barriers for interconversion and not the underlying rapid conformational excursions of the individual ensembles. Furthermore, the tools available to follow such dynamic processes are limited. Recent elegant applications of NMR to RNA molecules of moderate size have led to detailed information about local motions on the nanosecond timescale 11,12. Nevertheless, these approaches are currently limited to moderately sized molecules at high concentration and cannot be applied to transient kinetic intermediates. Recently applied site-specific paramagnetic adducts can probe nanosecond dynamics at a particular site in a complex RNA 13,14 and should also be highly useful in future studies. However, this approach also cannot interrogate transient intermediates and requires specialized experimental apparatus. Thus, additional dynamic probes of RNA would be valuable.
Traditionally, fluorescence has provided powerful probes of protein dynamics. Changes in fluorescence intensity or lifetimes provide evidence for conformational transitions, and the observed fluorescence changes are often related to changes in local dynamics, although those changes can be difficult to sort out. Fluorescence polarization anisotropy (FPA) provides a more direct readout of dynamics, as the degree of anisotropy is a function of the fluorophore's motion over its fluorescence lifetime –typically in the low nanosecond regime. FPA has been applied extensively in studies of protein dynamics and the formation of protein complexes (e.g. 15-17). However, the use of FPA for nucleic acid studies has been severely limited, as described below 18-21.
Complex RNAs are made up of short helical regions connected by junctions, and these regions are ultimately brought together or positioned by conformational preferences of the junctions, long range tertiary interactions and/or bound proteins. As RNA helices typically form rapidly and stably, the folding of complex RNAs often represent rearrangements of preformed helical elements. Thus, we would like to probe the dynamics of individual RNA helices within the context of larger RNA molecules and complexes.
Fluorescent dyes that are base analogs and incorporated into RNA are typically severely quenched upon duplex formation 22-25 and are therefore unusable for FPA studies of helices. The alternative of tethering a dye away from the helix is suboptimal in several respects. The flexibility in the tether decouples the motion of the dye from the helix and reduces the sensitivity of the anisotropy of the dye to the motion of the helix. The bulkiness of a tethered dye can also produce unwanted interactions or steric effects. Further, the fluorescence lifetime and anisotropy of such a dye can be affected by changes in the motions of the helix to which it is attached or by changes in the local environment of the dye. Attachment of base analog dyes in single-stranded regions of RNA can be powerful probes of local conformational changes but cannot cleanly report on regional dynamics. And the previous approach of using a nucleic acid intercalator such as ethidium bromide 18,19 is not generally tenable, as the dye is not localized to a single helix and may also distort the helical geometry and thus the overall RNA structure.
In this study, we utilized the unusual property of a fluorescent guanosine analog, 6-methyl isoxanthopterin (6-MI; Fig. 1A). This base maintains significant fluorescence when incorporated into duplexes 26, thereby allowing FPA measurements of individual helix dynamics. Since we initiated our studies with this dye, another class of dyes with similar properties has been reported 27-29 and should be useful for studies analogous to those presented herein.
Figure 1.
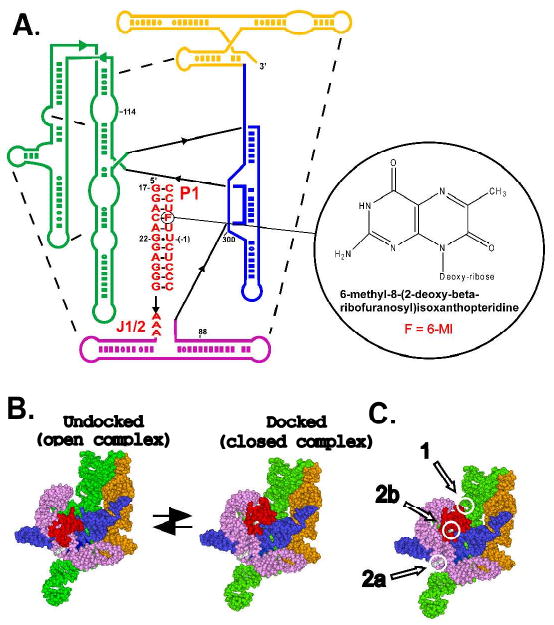
The Tetrahymena group I ribozyme (A) and docking equilibrium of its P1 duplex (B). Part B shows the tertiary structure model 30, colored as in part A. (C) Position of crosslinking sites between the P1 duplex and the ribozyme (Table 2, 1,31).
We show that 6-MI accurately reports on overall nucleic dynamics using a series of model constructs, and we use this dye to interrogate the dynamics of a single RNA helix within the ∼400 nucleotide Tetrahymena group I ribozyme (Figure 1).
Experimental Section
DNA and RNA oligonucleotides made via solid phase synthesis were obtained from Integrated DNA Technologies (Coralville, IA). 6-MI containing DNA and RNA oligonucleotides were obtained from TriLink (San Diego, CA) or Fidelity Systems (Gaithersburg, MD). All oligonucleotides were purified by gel electrophoresis or HPLC.
Ribozymes were prepared by in vitro transcription with T7 RNA polymerase and purified by gel electrophoresis as previously described for the wild type and mutant L-16 ScaI ribozyme32 and for the L-21 ScaI ribozyme used in cross-linking experiments31. Lac repressor (LacI) was expressed from plasmid pMDB1 (a gift from Michael Brenowitz, Albert Einstein College of Medicine) in E. coli and was purified as described33.
Assembly of model constructs and ribozyme complexes
Model constructs (Fig. 3A) were assembled in two steps. The partially self-complementary long oligonucleotide, 5′-r(GGACAGGAGGG-X-AGUUA)d(GCGAATTGTGAGCGCTCACAATTCGC)r(UAACU)-3′, where X = none, r(AAA), r(UUU), or -(CH2-CH2-O)6-, was annealed to from a duplex with short hangover region on both sides by annealing at 95 °C for 5 min, cooling to 50 °C over 40 min and quickly cooling to 4 °C. As the partially self-complementary long strand can also form stable hairpin structures, the purity of the annealed products were assessed by non-denaturing gel-electrophoresis, which revealed negligible amounts (2-4%) of hairpin in all cases (data not shown). The annealed long strand duplexes were then hybridized with a 6-MI-labeled short 11mer RNA strand to form the complete model constructs (Fig. 3A) to be used in FPA measurements. A mixture of long and short strand at a ratio of 4:1 was annealed at 38 °C for 30 min and complete hybridization (>98%) was confirmed by non-denaturing gel-electrophoresis (data not shown). Each model construct can bind up to two 6-MI labeled short strands. Further addition of duplexed long strands beyond the 4:1 ratio did not change the observed anisotropy or total fluorescence intensity (data not shown), providing additional evidence for complete hybridization and evidence against potential complexities from the fraction of complexes with two versus one fluorescent strand attached.
Figure 3.
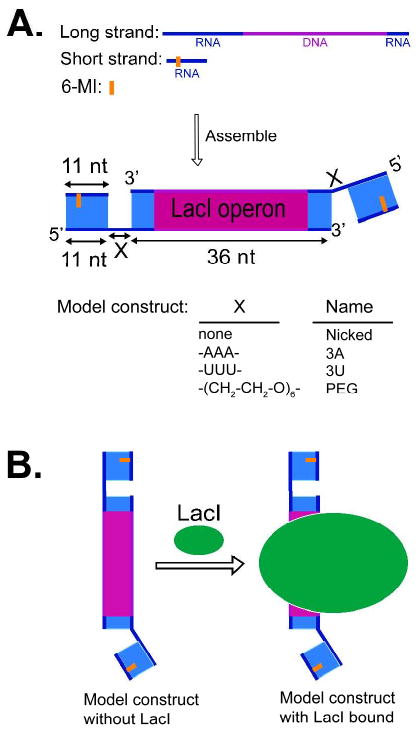
Model constructs used to study junction dynamics. (A) Model constructs (MC) with tethered RNA helices used in this study. The RNA portion of the chimera oligonucleotides is in blue; the DNA portion, in magenta; and the position of the 6-MI fluorescence probe is shown as an orange line (Table 1, see the Methods section for the assembly of the model constructs) (B) Binding of LacI reduces the overall tumbling of the constructs, isolating motions of the 6-MI-containing helix caused by the connecting junction.
Three oligonucleotide RNA strands were used: SF, 5′-(CCC UCC UFU CC)-3′, SFc, 5′-(CCC UCU UFU CC)-3′, and SFo, 5′-(CCCm UCU UFU CC)-3′, where ‘F’ refers to the 6-MI deoxyribose residue and ‘m’ refers to a 2′-OCH3 substitution. SFc and SFo are used in ribozyme experiments, as SFc and SFo favor the closed and open complexes, respectively (34,35 & see Results & Discussion). SF was used in all model construct studies except for model constructs directly compared to ribozymes; in those cases SFo was used. SF differs from SFc in only one residue: U6 of SFc forms a conserved G•U wobble base pair with the ribozyme's internal guide sequence (IGS), and this G•U pair is important for docking 36-38. SF replaces U6 with C6 to form a G•C Waton-Crick base pair with the opposite strand.
Complete binding of LacI to the model constructs was ensured by titrating concentrated LacI solution into hybridized model constructs until saturation (Fig. S1). Experiments with LacI were carried out with a constant Na+ concentration of 300 mM. Extensive control experiments showed that this concentration of Na+ prevented any significant nonspecific binding of LacI, which could otherwise affect FPA values (Supporting Information, Figure S1 and data not shown).
Ribozyme complexes for FPA experiments were assembled as follows. The ribozyme was folded at 50 °C for 30 min in 50 mM MOPS, pH 7.0, and 10 mM MgCl239. A concentrated solution of the folded ribozyme was then titrated into 200 nM of short fluorescent substrate strands until saturation of the FPA signal. Typically an excess of ∼2-fold was used. Saturation was confirmed before each experiment and was assumed to be maintained upon further addition of salt.
Fluorescence polarization anisotropy (FPA)
FPA measurements were performed on a Fluorolog-3 spectrometer using a T-format. Excitation and emission wavelengths were set to 350 and 425 nm, respectively. Each data point presented herein is the average of measurements from 2-4 independent samples. For each independent sample, samples were generally allowed at least 4 min to equilibrate before the first measurement and a total of 3-4 consecutive measurements were made over ∼10 mins, with a standard error that was generally smaller than 0.0015. The standard errors among different independent samples was generally less than 0.002. We estimate the total error in FPA value as (0.00152+0.0022)0.5 = 0.0025 and the total error has been used as error limits in figures and calculations. All FPA experiments were carried out with 50 mM sodiumMOPS, pH 7.0, with specified amounts of added NaCl and MgCl2. The FPA of the model constructs were measured at 15 °C unless noted otherwise. The ribozyme measurements were carried out at 25 °C.
Azidophenacyl cross linking
The radiolabeled 5′-azidophenacyl L-21 ScaI ribozyme used in cross-linking studies was the same as that used in previous cross-linking studies and was prepared following the same protocol1,31. Photo-crosslinking was carried out by irradiating for 10 min with a 312 nm Foto/Prep transilluminator (Fotodyne Inc., Hartland, WI) at room temperature. The crosslinking products were separated on a 6% denaturing acrylamide gel with 7 M urea and imaged using a Molecular Dynamics Phosphorimager.
Results and Discussion
As described in the Introduction, an ability to use FPA to assess motion of individual helices within a structured RNA or RNA/protein complex would greatly aid investigation of the properties and dynamics of these species. Required for such studies is a fluorescent base analog that, when incorporated into a helix, maintains substantial fluorescence so that the dye will have the same motions as the helix and be able to report on these motions. Initial reports from Hawkins and co-workers suggested that 6-MI (Fig. 1A), a fluorescent guanosine analog that can base pair effectively with C residues, might be such an analog26.
We first determined the fluorescent properties of 6-MI in simple duplexes to determine whether 6-MI FPA can accurately report on helix motions. We then extended these tests to model constructs (MC) of helices connected by single-stranded tethers. Having established the ability of 6-MI to report on helix motions, we then sought to isolate motions emanating from particular tether sequences in order to compare the behavior of model tethers with tethers of the same sequence embedded in a complex folded RNA, the group I ribozyme from Tetrahymena thermophila.
Testing 6-MI as a probe of nucleic acid dynamics using simple duplexes
Nucleic acid duplexes of moderate length are rigid elements with defined, regular shapes so that dynamic properties can be predicted and compared to experimental measures 21,40. We therefore determined the FPA of 6-MI-labeled DNA duplexes of varying length and compared the experimental values to predicted values (see Supporting Information). Duplexes ranging in length from 11 to 47 base pairs gave experimental FPA values that increase with helix length in a fashion that closely mirrors the predicted values, suggesting that 6-MI anisotropy can be used to monitor dynamic motion of helices (Fig. 2). The observation of slightly smaller values relative to the predicted values may arise from residual motion of 6-MI within the helix, from a slight offset of the transmission dipole relative to a perpendicular from the helical axis41, or from a combination of these factors. The duplexes also all have a single G•T mismatch (Table 1) that could lead to greater motion of 6-MI and lessen the observed anisotropy. Regardless of the origin of this small difference, the trend observed in Figure 2 and results described below provide strong support for the ability of 6-MI to report on helix dynamics.
Figure 2.

Predicted (black) and observed (grey) fluorescence polarization anisotropy of DNA duplexes of various lengths (Table 1A; see Supporting Information for description of duplexes and predictions).
Table 1.
Sequences of oligonucletides used in this study. A. 6-MI containing oligonucleotides used as substrates for the ribozyme or used as the short stand in model constructs (Fig. 3A). F = 6-MI, m substitution of 2′-OH with 2′-OCH3. B. The long strand of the model constructs (Fig. 3A). C. A series of model DNA duplexes of different length (Fig. 2). The ‘/’ represents the position of the nick in the 35mer (see Supporting Information text).
| A. RNA substrates or the short strand in model constructs | |
|---|---|
| Name | Sequence |
| SF | 5′-r(CCC UCC UFU CC)-3′ |
| SFc | 5′-r(CCC UCU UFU CC)-3′ |
| SFo | 5′-r(CCCm UCU UFU CC)-3′ |
| SC | 5′-r(CCC UCU)-3′ |
| SO | 5′-r(CCCm UCU)-3′ |
| B. The long strand of model constructs: | |
| Name | Sequence |
| MC-Nicked | 5′-r(GGA CAG GAG GGA GUU A)d(GC GAA TTG TGA GCG CTC ACA ATT CGC)r(UAACU)-3′ |
| MC-3A | 5′-r(GGA CAG GAG GGA AAA GUU A)d(GC GAA TTG TGA GCG CTC ACA ATT CGC)r(UAA CU)-3′ |
| MC-3U | 5′-r(GGA CAG GAG GGUUUA GUU A)d(GC GAA TTG TGA GCG CTC ACA ATT CGC)r(UAA CU)-3′ |
| MC-PEG | 5′-r(GGA CAG GAG GG–(CH2-CH2-O)6–AGU UA)d(GC GAA TTG TGA GCG CTC ACA ATT CGC)r(UAA CU)-3′ |
| C. DNA duplexes of different length | |
| Name | Sequence |
| 11mer | 5′-d(CCC TCT TFT CC)-3′ 3′-d(GGG AGG ACA GG)-5′ |
| 23mer | 5′-d(AGG TTG ATT TTG CCC TCT TFT CC)-3′ 3′-d(TCC AAC TAA AAC GGG AGG ACA GG)-5′ |
| 35mer | 5′-d(TGT GTA AGT TTT AGG TTG ATT TTG / CCC TCT TFT CC)-3′ 3′-d(ACA CAT TCA AAA TCC AAC TAA AAC GGG AGG ACA GG)-5′ |
| 47mer | 5′-d(GCG GCT CCA ATG TGT GTA AGT TTT AGG TTG ATT TTG CGC TGT TFT CC)-3′ 3′-d(CGC CGA GGT TAC ACA CAT TCA AAA TCC AAC TAA AAC GGG AGG ACA GG)-5′ |
Further testing 6-MI as a probe of nucleic acid dynamics using model nucleic acid constructs with intrinsic flexibility
A further prediction concerning the FPA of 6-MI-containing helices is that the introduction of single-stranded junction sequences should increase the dynamic motion, relative to constructs with the junctional residues engaged in base pairing or omitted. In addition, structured RNAs consist of short helical regions connected by formally single-stranded regions, so that constructs such as those studied herein can provide informative models for the constraints present for analogous sequences and structures within complex structured RNAs (see below).
Figure 3A depicts a series of model constructs (MC) with two helices connected by different junctions. Constructs with single-stranded junctions of three A residues (MC-3A), three U residues (MC-3U), and a PEG tether of the length of three residues (MC-PEG) were compared to a construct lacking a tether (MC-Nicked). Adding a single-stranded region in the model constructs is predicted to allow segmental motion and thus may lead to decreased anisotropy relative to a continuous helix. As predicted, the junction-containing constructs showed reduced anisotropies (Fig. 4).
Figure 4.

Effect of junction identity on anisotropy. Anisotropy of model oligonucleotide constructs (Fig. 3A, Table 1) without LacI bound. The oligonucleotide used is SF (see text and Table 1A). The anisotropy for the 11mer duplex with the same sequence as the 11mer region of the model constructs is shown for comparison. Conditions: 50 mM NaMOPS, pH 7.0, 280 mM NaCl, 15 °C.
The results of Figure 4 also agree with the expectation of greater stacking interactions, and thus less motion, for the construct containing a 3A junction than for the construct with a 3U junction 42,43. It is less intuitive that the 3U and PEG junctions should give similar dynamics. Small angle x-ray scattering and electrostatic computations indicate that the helices for each of these constructs are largely coaxial under the ionic conditions used in this experiment, and the preferred coaxial orientation has been attributed to electrostatic repulsion between the helices 44,45. Perhaps the restrictions from electrostatic repulsion result in similar motions on the nanosecond timescale for the 3U and PEG constructs despite the greater intrinsic flexibility of PEG. This observation underscores the importance of probing dynamics on multiple timescales in future studies.
The results of this and the previous section provide strong support for the ability of site-specifically incorporated 6-MI to probe the dynamics of individual helices. However, additional experiments gave paradoxical results that revealed a complicating factor for direct comparison of model construct mobility with mobilities observed for helices within large structured RNAs and RNA/protein complexes. We describe this complexity in the next section and the solution to it before probing the dynamics of a critical helical element of the Tetrahymena group I ribozyme.
Isolation of junctional motion in model constructs using a protein ‘anchor’
We were at first surprised to see that the anisotropy of model constructs with the 3U and PEG junctions approach that for the 3A construct with added ionic screening from Mg2+ (Fig. 5B). However, results of small angle x-ray scattering (SAXS) experiments with related constructs helped resolve this paradox and exposed the need for a helical ‘anchor’. SAXS studies revealed that constructs with 3U and PEG junctions more readily adopt a bent conformation than those with 3A junctions as ionic screening is increased44,45. Apparently the electrostatic relaxation from higher screening that allows bent conformers is opposed by the linear preference that arises from stacking of A residues 43,46. Thus, the observed FPA of the 3U and PEG constructs is a function of both the junction flexibility and the molecule's overall tumbling and rotation, and the overall motions are slower for a stably bent than for a linear molecule 20,47. The Mg2+-induced increase in FPA of the 3U and PEG constructs relative to the 3A construct may thus not represent a relative change in junction flexibility but rather differences in the overall shapes of the molecules. (There is also an effect of Mg2+ on the anisotropy of a duplex control, presumably because of an effect on local mobility of 6-MI; comparisons of FPA values obtained under different ionic conditions have therefore been normalized for this effect (see, e.g., Supporting Information, Figure S4).)
Figure 5.

Effect of LacI binding on anisotropy. Anisotropy of model oligonucletide constructs (Fig. 3) without (black) or with (grey) LacI bound obtained in the absence (A) or presence (B) of 10 mM MgCl2. Conditions: 50 mM NaMOPS, pH 7.0, 280 mM NaCl, 15 °C. The oligonucleotide used is SF (Table 1A). The LacI experiments require a NaCl concentration of 280 mM or higher. Non-specific binding of LacI with the model constructs becomes noticeable at lower NaCl concentration (see Supporting Information).
Our aim with the model constructs, in addition to establishing that 6-MI FPA can be used to monitor helical motions, was to provide benchmarks for motions of individual helices within complex RNAs. We therefore needed to isolate the helix motion due to the junction flexibility in the model constructs. To do that, we incorporated the Lac repressor binding sequence in a central DNA region of the model constructs (Fig. 3A). This sequence allowed binding of the LacI protein, which, due to its size (MW = 154 kDa), greatly restricts overall tumbling of the model construct on the nanosecond anisotropy time scale (Fig. 3B, Supporting Information and see Figure 5 below). As shown in Figure 5, addition of LacI increases the observed anisotropy. The Mg2+-induced decrease in the anisotropy difference between A3 and U3/PEG is less significant with LacI bound than without, which corresponds to a reduction in impact of the molecular shape and overall tumbling on the observed anisotropy upon LacI binding. The residual Mg2+ effect could arise from different effects of Mg2+ on junction flexibility for the different junction sequences but would require further study to resolve.
Exploration of local helix dynamics for the P1 duplex of the Tetrahymena ribozyme
The Tetrahymena group I ribozyme is one of the best studied complex RNAs48-50. In the reaction catalyzed by this ribozyme, an oligonucleotide substrate (S) mimicking the 5′-splice site in the natural self-splicing form of the intron base pairs with the ribozyme's internal guide sequence (IGS) to form the P1 helix (Fig. 1A). The P1 helix is connected to the rest of the ribozyme through a single-stranded junction region called J1/2. The P1 duplex docks into tertiary interactions with the ribozyme's conserved catalytic core. The states without and with these tertiary interactions are referred to as the ‘open’ and ‘closed’ complexes, respectively, and formation of the closed complex precedes the reaction's chemical step 3,51,52. P1 docking is slow, with a rate constant on the order of 1 s-1, and is rate-limiting under some reaction conditions 38,51,53. The slow P1 docking is one of the remaining mysteries of the Tetrahymena ribozyme, and slow conformational steps appear to be common in RNA systems38,54,55. To learn more about the docked and undocked complexes and how the mobility of the P1 helix might affect the docking process, we incorporated 6-MI into this helix.
The first simple prediction is that the closed complex, with the P1 helix docked into its tertiary interactions, will exhibit low mobility. This prediction was confirmed, as the anisotropy of 6-MI incorporated in the P1 helix in the closed complex is considerably higher than the value for the same helix and same connecting sequence (J1/2 = AAA) in model construct MC-3A under identical conditions, 0.276 versus 0.243 (Fig. 6A). The model construct measurements for this and the other ribozyme comparisons were carried out with bound Lac repressor to eliminate contributions from the faster tumbling of the free model construct, and the model construct used for this comparison contained an internal G•U wobble pair to match the conserved G•U pair within the P1 helix (Fig. 6 and Table 1). With Lac repressor bound, the overall size of the model construct is similar to the ribozyme (LacI + model construct = 154 + 34 = 188 kDa; ribozyme = 130 kDa).
Figure 6.

Comparison of the anisotropy of the L-16 ScaI ribozyme with the P1 duplex containing 6-MI and model constructs (Fig. 1A). Conditions: 50 mM MOPS, pH 7.0, 10 mM Mg2+ at 25 °C, with A. 280 mM NaCl, B. 0 mM NaCl and C. 280 mM added NaCl. R3A and R3U are ribozymes with J1/2 sequence of AAA and UUU, respectively. Oligonucleotide SFc is used for the closed complex and SFo is used for open complex and model constructs. (SFc and SFo are defined in the Methods section and Table 1A). (A) Comparison of anisotropy of the ribozyme's P1 duplex in the closed complex with model constructs containing the same junction sequence of AAA. Under the salt condition in A (280 mM added NaCl), even with SFc as the substrate, P1 is partially undocked (∼52%,38), which lowers the observed anisotropy value for the closed complex (After correction for the fraction undocked, the anisotropy of the docked P1 is calculated to be 0.296). (B) Comparison of anisotropy of the ribozymes in the closed and open complex. Under the salt condition in B (no added NaCl), even with SFo as the oligonucleotide, R3A is not completely in the open complex. (Kdock = 0.4 ± 0.1)(L.E. Bartley & D.H., unpub. results). The value in the figure is corrected accordingly. (The uncorrected value is 0.279.) (C) Comparison of anisotropy of the ribozyme's P1 duplex in the open complex with model constructs containing the same junction sequence of AAA and UUU. The data for the model constructs with LacI bound in Figure 6 differ from Figure 5 because the experiments were done at different temperature and use different oligonucleotides (see Methods & Table 1).
One model for the slow docking of P1 is that the open complex is engaged in alternative nonproductive interactions that must be broken prior to correct docking. This model is supported by the formation of a specific cross-link between the P1 duplex and the ribozyme core from the open complex1,31. However, we observed that the anisotropy of the open complex is considerably lower than that for the closed complex (Fig. 6B)1. The low anisotropy value for the open complex provides evidence against models in which the open complex is trapped in a stable alternative docked conformer.
The open complex is slightly less mobile than the corresponding model complex (Fig. 6C), an effect that could arise from an interaction of one of the A residues of the J1/2 sequence. This model is consistent with the differential reactivity of the J1/2 A residues that is observed with dimethyl sulfate (DMS) in the ribozyme's open complex56. Also, local steric effects could alter the J1/2 conformation and mobility. However, an effect from local electrostatics is argued against by the observation that a ribozyme with a J1/2 junction consisting of three U residues does not exhibit higher anisotropy than its corresponding model control (Fig. 6C & see below).
Mirroring the greater mobility of U residues observed in the model constructs, a ribozyme with three U residues for its J1/2 sequence gave lower anisotropy for its open complex than that observed with the wild type A3 sequence (Fig. 6C). In this case, the ribozyme was slightly more mobile than the corresponding model construct. It is possible that there is residual motion within the ribozyme that increases the observed relaxation of the P1 helix relative to the model construct anchored by rigid binding to the Lac repressor. Consistent with this model is the observation that mutations that disrupt the ribozyme's long range tertiary interactions increase motion of the P1 duplex (i.e., decrease the anisotropy of the bound oligonucleotide; X.S., T. Benz-Moy & D.H., unpublished results).
To learn more about the open complexes, we compared crosslinking of ribozymes containing the wild type A3 and the mutant U3 J1/2 sequences. Attachment of an azido-phenacyl crosslinker to the 5′-end of the L-21 ScaI version of the Tetrahymena group I ribozyme has been shown to give different crosslinks in the open and closed complexes as well as with the free internal guide sequence (IGS) (Table 2; Fig. 1C; 1,31).
Table 2.
Sites of photo-crosslinking between the P1 duplex with a 5′-azido group attached and the wild type L-21 ScaI ribozyme reported in the literature1,31.
| Species | Location | Complex Giving Cross-link |
|---|---|---|
| 1 | A114 | Closed complex |
| 2b | U300 | no oligonucleotide substrate |
| 2a | A88 | no oligonucleotide substrate, or open complex with oligonucleotide substrate |
| * | A photoproduct that does not involve the 5′-azido group | |
| ** | Aggregation |
The crosslinking results support the conclusions from the anisotropy measurements of additional flexibility of the ribozyme containing the U3 J1/2 tether. The results with wild type ribozyme reproduce earlier published results, indicating that different cross-linked species are preferentially formed in the unbound, open, and closed states (Fig. 7, AAA; 1,31). With the U3-containing ribozyme, the closed complex does not form to an appreciable extent (L.E. Bartley & D.H., unpub. results), so that the same cross-linking pattern is observed with the oligonucleotides that favor and disfavor closed complex formation for the wild type ribozyme (Fig. 7, SC vs SO). Remarkably, the open complex of the U3-containing ribozyme gives all three major crosslinks that are observed preferentially in the unbound, open, or closed states of the wild type ribozyme (Fig. 7, SO). Further, the open complex cross-linking pattern for the mutant open complex resembles that of the unbound state (lanes 8 vs 10), consistent with extensive conformational mobility of this open complex. In contrast, for the wild type ribozyme crosslink 2b disappears and crosslink 1 appears in the open complex (lanes 2 vs 4).
Figure 7.
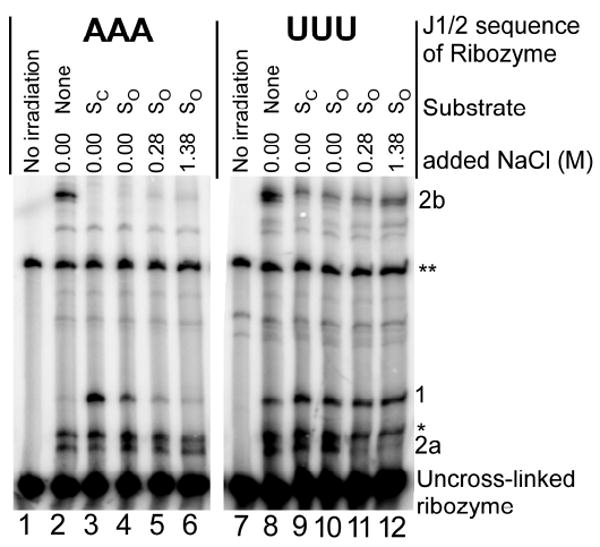
Photo-crosslinking products for 5′-azido labeled L-21 ScaI ribozymes with AAA (R3A) and UUU (R3U) in the J1/2 junction. The species listed are defined in Table 2. Conditions: 50 mM MOPS, pH 7.0, 10 mM Mg2+, 23 °C, with varying concentrations of NaCl. Oligonucleotide SC, 5′-r(CCCUCU)-3′, favors the closed complex. Oligonucleotide SO, 5′-r(CCCmUCU)-3′, favors the open complex34,35; ‘m’ refers to a 2′-OCH3 substitution. The varying NaCl concentration was used to destabilize residual closed complex1,38. As expected, intensity of band 1, the band associated with the closed complex in R3A, decreases with increasing NaCl concentration (lane 3-5). However, the intensity of band 2a, the band associated with the open complex in R3A, does not increase detectably with increasing NaCl for R3A (lane 3-5). For R3U, band 2a weakens with increasing NaCl concentration. A possible explanation is that increasing NaCl concentration renders the conformation associated with forming crosslinking at 2a less favorable compared to conformations that give crosslinking at other positions or do not give crosslinking.
Conclusions and Implications
Docking of the P1 duplex occurs on the second timescale, much slower than expected for a free conformational search38. The greater mobility of the P1 helix in the open complex compared to the closed complex indicates that slow docking does not originate from trapping of P1 in an alternatively docked state. Nevertheless, the preferred crosslink formed in the open complex (Fig. 7; 1) is consistent with restricted motion in this state, as is the slightly lower anisotropy of this state relative to the corresponding model construct control.
There is a modest increase in the rate of docking upon mutation of J1/2 to three U residues (L.E. Bartley. & D.H., unpub. results). Correspondingly, when P1 is attached to U3 in the J1/2 mutant there is an increase in the motion of the P1 duplex and the crosslinking positions that are accessible. Nevertheless, this J1/2 mutant destabilizes the docked state relative to the open complex (L.E. Bartley & D.H., unpub. results; see also Fig. 7).
Based on these results we suggest the following model. The U3 J1/2 sequence allows additional conformer sampling of the P1 helix in the open complex, relative to the A3 sequence. This broader sampling increases the probability of collisions with regions of the ribozyme that make tertiary interactions with P1 in the closed complex, thereby increasing the rate of docking (kdock = 3 s-1 for A3 and 6 s-1 for U3, L.E. Bartley & D.H., unpub. results). However, the docked complex is destabilized by the U3 mutation because tertiary and stacking interactions of the A3 sequence that are formed subsequent to the docking transition state cannot be made with the U residues (Kdock = 30 for A3 and 1 for U3, L.E. Bartley & D.H., unpub. results). The change in protection of one of the A residues within J1/2 upon docking is consistent with an alternative preferred conformation of the wild type open complex or with formation of tertiary interactions with J1/2 in the wild type closed complex56.
Relating motions within complex RNAs to defined models will aid in analysis and interpretation, as will comparison to results from other experimental approaches. Herein we have brought together fluorescence anisotropy results for wild type and mutant RNAs and model constructs with crosslinking, chemical protection and single molecule fluorescence assays of P1 docking kinetics and equilibria. Although our finding in itself cannot fully explain why P1 docking happens on the second time scale, these results rule out a previous model for slow docking and lead to a more sophisticated docking model that integrates the results from these distinct experimental modalities. Our docking model is compatible with the previously proposed scenario in which the catalytic site is not pre-aligned for docking38. Thus, even though the U3-tethered P1 duplex may attempts to dock more frequently than A3-tethered P1, of the vast majority of the attempts for both species are likely to be unsuccessful because the need of the catalytic core to rearrange, either prior to or following initial encounter with P1. Future challenges, in addition to testing and refining this model, are to better understand the molecular origins of RNA motions on the nanosecond timescale and the integration of techniques that provide dynamic and conformation information over a wide spectrum of timescales.
We have explored the nanosecond time scale dynamics of an individual helix within different conformational states of a complex functional RNA. We suggest that 6-MI and related species26-29 will be powerful and incisive probes of RNA dynamics. Effective controls for overall tumbling effects, via the addition of protein anchors, and for local effects from different ionic environments can be carried out. Nonetheless, only an average motion over the nanosecond timescale is reported, and a full understanding of RNA conformational dynamics will require additional experimental modalities likely coupled to computation.
Supplementary Material
Acknowledgments
We thank M. Brenowitz for the pMDB1 plasmid; L.E. Bartley and T. Benz-Moy for permission to cite unpublished results; and members of the Herschlag lab for comments on the manuscript. This work was supported by NIH Grants PO1 GM066275 and GM49243.
Footnotes
The open complex anisotropy was determined by using an oligonucleotide with a 2′-methoxy substitution that disrupts the closed complex but has no effect on the docking rate constant or on the anisotropy of the remote 6-MI (ref 46 and data not shown).
Supporting Information Available: Saturation of LacI with model constructs, thermal and motional properties of 6-MI in helices, fluorescence lifetime measurement and base sequence requirements for the 6-MI experiments, FPA of DNA duplexes of different length, estimating the anisotropy of simple duplexes with LacI bound and normalization of FPA of model constructs
References
- 1.Narlikar GJ, Herschlag D. Nat Struct Biol. 1996;3:701–710. doi: 10.1038/nsb0896-701. [DOI] [PubMed] [Google Scholar]
- 2.Wilson KS, Noller HF. Cell. 1998;92:337–349. doi: 10.1016/s0092-8674(00)80927-7. [DOI] [PubMed] [Google Scholar]
- 3.Zhuang XW, Bartley LE, Babcock HP, Russell R, Ha TJ, Herschlag D, Chu S. Science. 2000;288:2048–2051. doi: 10.1126/science.288.5473.2048. [DOI] [PubMed] [Google Scholar]
- 4.Smith DJ, Query CC, Konarska MM. Mol Cell. 2008;30:657–666. doi: 10.1016/j.molcel.2008.04.013. [DOI] [PMC free article] [PubMed] [Google Scholar]
- 5.Gesteland RF, Cech TR, Atkins JF, editors. The RNA World. 3rd. Cold Spring Harbor Laboratory Press; Cold Spring Harbor: 2006. [Google Scholar]
- 6.Legiewicz M, Badorrek CS, Turner KB, Fabris D, Hamm TE, Rekosh D, Hammarskjold ML, Le Grice SFJ. Proc Natl Acad Sci USA. 2008;105:14365–14370. doi: 10.1073/pnas.0804461105. [DOI] [PMC free article] [PubMed] [Google Scholar]
- 7.Montange RK, Batey RT. Ann Rev Biophys. 2008;37:117–133. doi: 10.1146/annurev.biophys.37.032807.130000. [DOI] [PubMed] [Google Scholar]
- 8.Sclavi B, Sullivan M, Chance MR, Brenowitz M, Woodson SA. Science. 1998;279:1940–1943. doi: 10.1126/science.279.5358.1940. [DOI] [PubMed] [Google Scholar]
- 9.Joo C, Balci H, Ishitsuka Y, Buranachai C, Ha T. Annu Rev Biochem. 2008;77:51–76. doi: 10.1146/annurev.biochem.77.070606.101543. [DOI] [PubMed] [Google Scholar]
- 10.Klostermeier D, Millar DP. Methods. 2001;23:240–254. doi: 10.1006/meth.2000.1135. [DOI] [PubMed] [Google Scholar]
- 11.Zhang Q, Stelzer AC, Fisher CK, Al-Hashimi HM. Nature. 2007;450:1263–U14. doi: 10.1038/nature06389. [DOI] [PubMed] [Google Scholar]
- 12.Zhang Q, Sun XY, Watt ED, Al-Hashimi HM. Science. 2006;311:653–656. doi: 10.1126/science.1119488. [DOI] [PubMed] [Google Scholar]
- 13.Edwards TE, Sigurdsson ST. Nat Protoc. 2007;2:1954–1962. doi: 10.1038/nprot.2007.273. [DOI] [PubMed] [Google Scholar]
- 14.Grant GPG, Boyd N, Herschlag D, Qin PZ. Journal of the ameican chemical society. 2009;131:3136–3137. doi: 10.1021/ja808217s. [DOI] [PMC free article] [PubMed] [Google Scholar]
- 15.Bucci E, Steiner RF. Biophys Chem. 1988;30:199–224. doi: 10.1016/0301-4622(88)85017-8. [DOI] [PubMed] [Google Scholar]
- 16.Weber G. Biochem J. 1952;51:155–168. doi: 10.1042/bj0510155. [DOI] [PMC free article] [PubMed] [Google Scholar]
- 17.LiCata VJ, Wowor AJ. Meth Cell Biol. 2008;84:243–262. doi: 10.1016/S0091-679X(07)84009-X. [DOI] [PubMed] [Google Scholar]
- 18.Millar DP, Robbins RJ, Zewail AH. J Chem Phys. 1981;74:4200–4201. [Google Scholar]
- 19.Thomas JC, Allison SA, Appellof CJ, Schurr JM. Biophys Chem. 1980;12:177–188. doi: 10.1016/0301-4622(80)80050-0. [DOI] [PubMed] [Google Scholar]
- 20.Chirico G, Collini M, Toth K, Brun N, Langowski J. Eur Biophys J Biophy. 2001;29:597–606. doi: 10.1007/s002490000110. [DOI] [PubMed] [Google Scholar]
- 21.Duhamel J, Kanyo J, DinterGottlieb G, Lu P. Biochemistry. 1996;35:16687–16697. doi: 10.1021/bi9610919. [DOI] [PubMed] [Google Scholar]
- 22.Asseline U. Curr Org Chem. 2006;10:491–518. [Google Scholar]
- 23.Rist MJ, Marino JP. Curr Org Chem. 2002;6:775–793. [Google Scholar]
- 24.Ward DC, Reich E, Stryer L. J Biol Chem. 1969;244:1228–1237. [PubMed] [Google Scholar]
- 25.Wilson JN, Kool ET. Org Biomol Chem. 2006;4:4265–4274. doi: 10.1039/b612284c. [DOI] [PubMed] [Google Scholar]
- 26.Hawkins ME, Pfleiderer W, Balis FM, Porter D, Knutson JR. Anal Biochem. 1997;244:86–95. doi: 10.1006/abio.1996.9879. [DOI] [PubMed] [Google Scholar]
- 27.Sandin P, Borjesson K, Li H, Martensson J, Brown T, Wilhelmsson LM, Albinsson B. Nucleic Acids Res. 2008;36:157–167. doi: 10.1093/nar/gkm1006. [DOI] [PMC free article] [PubMed] [Google Scholar]
- 28.Sandin P, Wilhelmsson LM, Lincoln P, Powers VEC, Brown T, Albinsson B. Nucleic Acids Res. 2005;33:5019–5025. doi: 10.1093/nar/gki790. [DOI] [PMC free article] [PubMed] [Google Scholar]
- 29.Wilhelmsson LM, Holmen A, Lincoln P, Nielson PE, Norden B. J Am Chem Soc. 2001;123:2434–2435. doi: 10.1021/ja0025797. [DOI] [PubMed] [Google Scholar]
- 30.Lehnert V, Jaeger L, Michel F, Westhof E. Chem Biol. 1996;3:993–1009. doi: 10.1016/s1074-5521(96)90166-0. [DOI] [PubMed] [Google Scholar]
- 31.Wang JF, Downs WD, Cech TR. Science. 1993;260:504–508. doi: 10.1126/science.7682726. [DOI] [PubMed] [Google Scholar]
- 32.Karbstein K, Lee J, Herschlag D. Biochemistry. 2007;46:4861–4875. doi: 10.1021/bi062169g. [DOI] [PMC free article] [PubMed] [Google Scholar]
- 33.Hsieh M, Hensley P, Brenowitz M, Fetrow JS. J Biol Chem. 1994;269:13825–13835. [PubMed] [Google Scholar]
- 34.Pyle AM, Cech TR. Nature. 1991;350:628–631. doi: 10.1038/350628a0. [DOI] [PubMed] [Google Scholar]
- 35.Herschlag D, Eckstein F, Cech TR. Biochemistry. 1993;32:8299–8311. doi: 10.1021/bi00083a034. [DOI] [PubMed] [Google Scholar]
- 36.Knitt DS, Narlikar GJ, Herschlag D. Biochemistry. 1994;33:13864–13879. doi: 10.1021/bi00250a041. [DOI] [PubMed] [Google Scholar]
- 37.Strobel SA, Cech TR. Science. 1995;267:675–679. doi: 10.1126/science.7839142. [DOI] [PubMed] [Google Scholar]
- 38.Bartley LE, Zhuang XW, Das R, Chu S, Herschlag D. J Mol Biol. 2003;328:1011–1026. doi: 10.1016/s0022-2836(03)00272-9. [DOI] [PubMed] [Google Scholar]
- 39.Herschlag D, Cech TR. Biochemistry. 1990;29:10159–10171. doi: 10.1021/bi00496a003. [DOI] [PubMed] [Google Scholar]
- 40.Smith AL, Cekan P, Rangel DP, Sigurdsson ST, Mailer C, Robinson BH. J Phys Chem B. 2008;112:9219–9236. doi: 10.1021/jp7111704. [DOI] [PubMed] [Google Scholar]
- 41.Lakowicz JR. Principles of Fluorescence Spectroscopy. 3rd. Springer: New York: 2006. [Google Scholar]
- 42.Tso POP, Melvin IS, Olson AC. J Am Chem Soc. 1963;85:1289–1296. [Google Scholar]
- 43.Holcomb DN, Tinoco I. Biopolymers. 1965;3:121–133. [Google Scholar]
- 44.Bai Y. PhD dissertation. Stanford University; 2007. [Google Scholar]
- 45.Bai Y, Chu VB, Lipfert J, Pande VS, Herschlag D, Doniach S. J Am Chem Soc. 2008;130:12334–12341. doi: 10.1021/ja800854u. [DOI] [PMC free article] [PubMed] [Google Scholar]
- 46.Brahms J, Michelso AM, Van Holde KE. J Mol Biol. 1966;15:467–488. doi: 10.1016/s0022-2836(66)80122-5. [DOI] [PubMed] [Google Scholar]
- 47.Levene SD, Wu HM, Crothers DM. Biochemistry. 1986;25:3988–3995. doi: 10.1021/bi00362a003. [DOI] [PubMed] [Google Scholar]
- 48.Woodson SA. Curr Opin Struct Biol. 2005;15:324–330. doi: 10.1016/j.sbi.2005.05.007. [DOI] [PubMed] [Google Scholar]
- 49.Hougland JL, Piccirilli JA, Forconi M, Lee J, Herschlag D. In: The RNA World. 3rd. Gesteland RF, Cech TR, Atkins JF, editors. Cold Spring Harbor Laboratory Press; Cold Spring Harbor: 2006. pp. 133–205. [Google Scholar]
- 50.Vicens Q, Cech TR. Trends Biochem Sci. 2006;31:41–51. doi: 10.1016/j.tibs.2005.11.008. [DOI] [PubMed] [Google Scholar]
- 51.Bevilacqua PC, Kierzek R, Johnson KA, Turner DH. Science. 1992;258:1355–1357. doi: 10.1126/science.1455230. [DOI] [PubMed] [Google Scholar]
- 52.Herschlag D. Biochemistry. 1992;31:1386–1399. doi: 10.1021/bi00120a015. [DOI] [PubMed] [Google Scholar]
- 53.Narlikar GJ, Bartley LE, Khosla M, Herschlag D. Biochemistry. 1999;38:14192–14204. doi: 10.1021/bi9914309. [DOI] [PubMed] [Google Scholar]
- 54.Zarrinkar PP, Williamson JR. Science. 1994;265:918–924. doi: 10.1126/science.8052848. [DOI] [PubMed] [Google Scholar]
- 55.Zhuang XW, Kim H, Pereira MJB, Babcock HP, Walter NG, Chu S. Science. 2002;296:1473–1476. doi: 10.1126/science.1069013. [DOI] [PubMed] [Google Scholar]
- 56.Engelhardt MA, Doherty EA, Knitt DS, Doudna JA, Herschlag D. Biochemistry. 2000;39:2639–2651. doi: 10.1021/bi992313g. [DOI] [PubMed] [Google Scholar]
Associated Data
This section collects any data citations, data availability statements, or supplementary materials included in this article.