Abstract
Compared to conventional piezoelectric transducers, new capacitive microfabricated ultrasonic transducer (CMUT) technology is expected to offer a broader bandwidth, higher resolution and advanced 3D/4D imaging inherent in a 2D array. For ultrasound scatterer size imaging, a broader frequency range provides more information on frequency-dependent backscatter, and therefore, generally more accurate size estimates. Elevational compounding, which can significantly reduce the large statistical fluctuations associated with parametric imaging, becomes readily available with a 2D array. In this work, we show phantom and in vivo breast tumor scatterer size image results using a prototype 2D CMUT transducer (9 MHz center frequency) attached to a clinical scanner. A uniform phantom with two 1 cm diameter spherical inclusions of slightly smaller scatterer size was submerged in oil and scanned by both the 2D CMUT and a conventional piezoelectric linear array transducer. The attenuation and scatterer sizes of the sample were estimated using a reference phantom method. RF correlation analysis was performed using the data acquired by both transducers. The 2D CMUT results indicate that at a 2 cm depth (near the transmit focus for both transducers) the correlation coefficient reduced to less than 1/e for 0.2 mm lateral or 0.25 mm elevational separation between acoustic scanlines. For the conventional array this level of decorrelation requires a 0.3 mm lateral or 0.75 mm elevational translation. Angular and/or elevational compounding is used to reduce the variance of scatterer size estimates. The 2D array transducer acquired RF signals from 140 planes over a 2.8 cm elevational direction. If no elevational compounding is used, the fractional standard deviation of the size estimates is about 12% of the mean size estimate for both the spherical inclusion and the background. Elevational compounding of 11 adjacent planes reduces it to 7% for both media. Using an experimentally estimated attenuation of 0.6 dB cm−1MHz−1, scatterer size estimates for an in vivo breast tumor also demonstrate improvements using elevational compounding with data from the 2D CMUT transducer.
1. Introduction
Recent advances that incorporate capacitive microfabricated ultrasonic transducers (CMUTs) (Haller and KhuriYakub 1996, Ladabaum et al 1998) in clinical scanners (Daft et al 2005) may offer advantages in parametric ultrasound imaging as well as in conventional B-mode imaging. With a CMUT transducer a large number of air-gap capacitors form each ‘transducer element’. The capacitors are driven electrostatically to create an acoustic pressure wave. CMUT’s provide design flexibility, use manufacturing processes that are employed in computer chips, and may facilitate integration of various electronic devices into the probe handle (Daft et al 2005). Compared to conventional piezoelectric transducers, CMUT technology is expected to offer a higher SNR, a broader bandwidth, better resolution and advanced 3D/4D imaging inherent in 2D arrays (Oralkan et al 2003).
In this paper, we describe initial evaluations of a CMUT array for quantitative imaging of ultrasonic scatterer size. Conventional ultrasound imaging displays only the amplitudes of echo signals, discarding phase and frequency information in the processing. Work, for example, by Lizzi et al (1983, 1997, 2006), has demonstrated that parameters derived from the echo-signal spectrum yield information related to the sources of scattering from tissues. Insana et al (Insana and Hall 1990, Insana et al 1993) and Hall et al (1996) computed effective scatterer sizes from the ultrasonic backscatter coefficient; they demonstrated that estimates of effective scatterer size can track changes in the size of glomeruli and afferent and efferent arterioles, and can potentially be used to detect kidney disease. Oelze et al (2002, 2004) applied a Gaussian model to spectral data derived from echo signals and produced images that relate to scatterer size. They observed significant differences in the sizes of scatterers computed from echo data from a breast-tumor model compared to sizes derived from nonmalignant breast tissues. Wilson et al (2006) demonstrated that scatterer-size estimates reveal differences in microstructure between thyroid tumors and surrounding normal thyroid tissues, while Liu (2007) presented results suggesting that scatterer sizes in liver hemangiomas are somewhat larger than scatterer sizes in the surrounding liver parenchyma, which could offer diagnostic benefits.
For ultrasound scatterer size imaging, a broader frequency range provides more information on frequency-dependent backscatter, more accurate comparisons with scattering models providing the model is adequate over the frequency range, and therefore, better effective scatterer size estimates. Furthermore, elevational compounding (Li and O’Donnell 1994, Liu 2007), which can greatly reduce the large statistical fluctuations associated with parametric imaging, becomes readily available with a 2D array.
In this paper, we report on initial scatterer size images using a prototype 9MHz 2D CMUT transducer attached to a Siemens SONOLINE Antares clinical scanner. We will discuss elevational compounding using the CMUT system and provide initial results using a CMUT to produce scatterer size images of the breast in a patient with fibroadenoma.
2. Materials and methods
2.1. 2D CMUT array
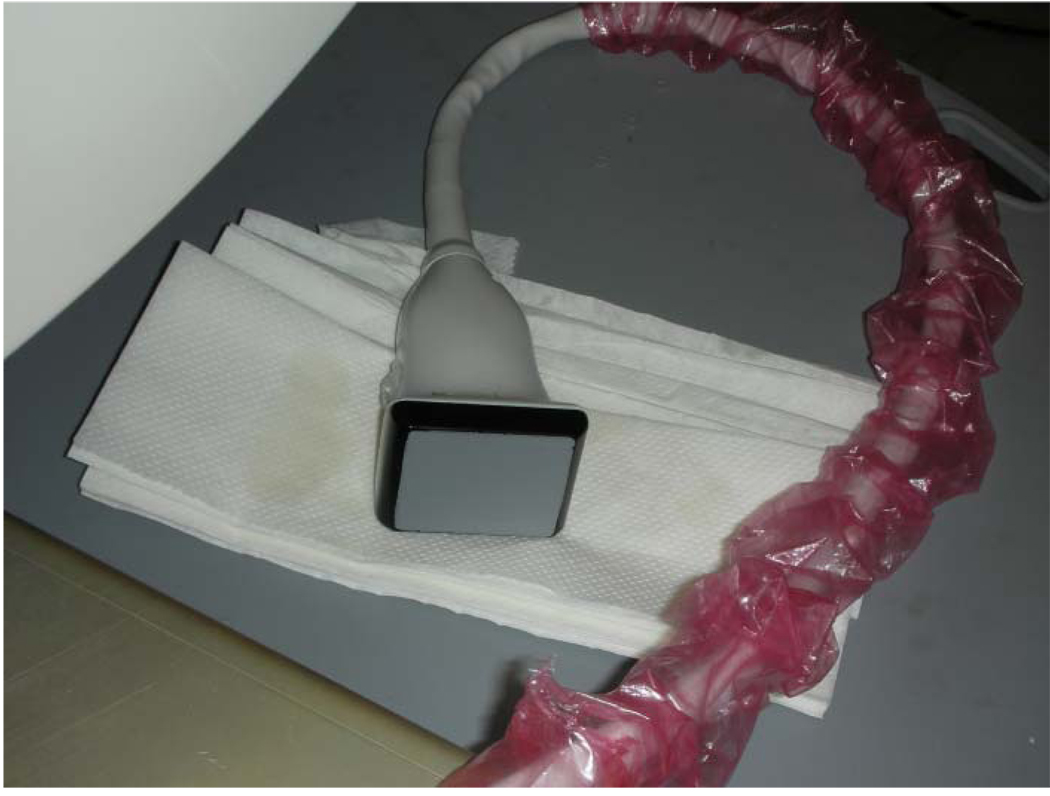
Figure 1 is a photograph of the CMUT array, which is a laboratory-based prototype. Driven by a Siemens SONOLINE Antares machine, the device operates like a 1D array that is electronically stepped in the elevational direction (Daft et al 2003). The elevational step size is 0.214 mm, and there are 140 steps available, resulting in a total elevational sweep of approximately 30 mm. The nominal center frequency is 9 MHz, similar to an existing VFX13–5 (1.25D PZT) array on the Antares scanner. The present design incorporates an electronic Fresnel lens to focus in the elevational direction (Daft et al 2005).
Figure 1.
Prototype 2D CMUT array (courtesy of Siemens Medical Solutions, Inc., Mountain View, CA).
2.2. Phantoms
An oil-in-gel phantom made of materials designed for elasticity imaging (Madsen et al 2006) was made in our lab. Two 1 cm diameter spherical inclusions are surrounded by background material. The outer dimensions of the phantom are 100 × 100 × 70 mm3, and its contents are listed in table 1.
Table 1.
Contents of the oil-in-gel phantom under study.
| Component: | Clear gel (volume fraction) |
Safflower oil (volume fraction) |
Glass beads (mass/vol; diameter) |
|---|---|---|---|
| Background | 0.2 | 0.8 | 20 g l−1, 45–53 µm |
| Inclusions | 0.5 | 0.5 | 20 g l−1, ~17.5 µm |
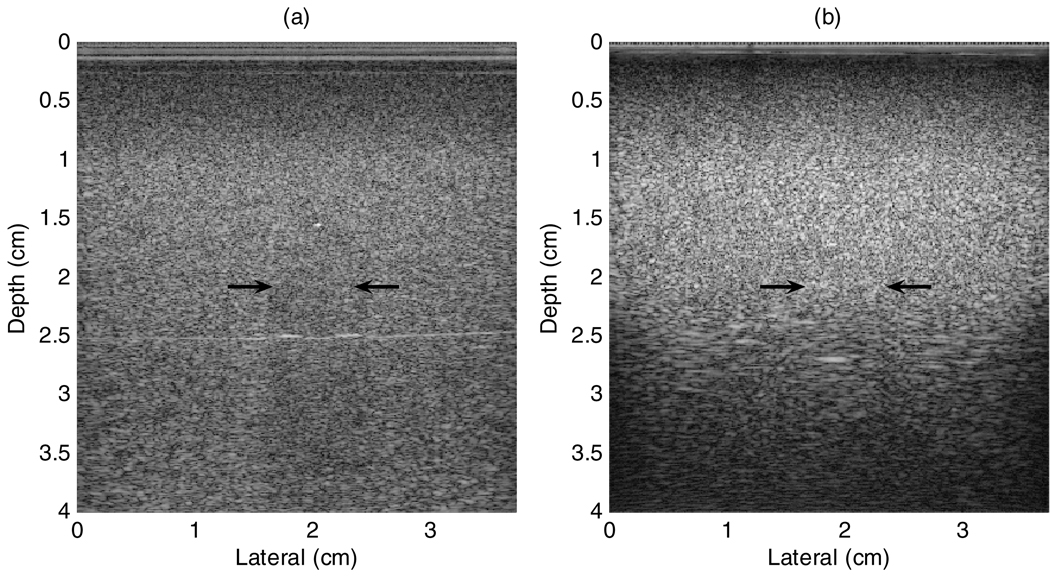
The background tissue mimicking (TM) material has a sound speed of about 1480 m s−1 and a nominal attenuation coefficient versus frequency slope of 0.5 dB cm−1 MHz−1. Ultrasound scattering is produced by glass beads and by oil droplets (Madsen et al 2006). The spherical inclusions have smaller glass beads and a lower oil droplet concentration compared to the background. One inclusion is at the center, while the other is near a corner of the phantom; both are centered at a 2 cm depth. B-mode images (see figure 3 in Results) reveal that the backscatter signal intensity from the spheres is somewhat lower than that of the background, while the attenuation is slightly higher than that of the background. The phantom is immersed in a safflower oil bath, enabling direct contact between the scanning transducer and the TM gel during imaging experiments.
Figure 3.
(a) B-mode image using the VFX13-5 transducer operating at a nominal frequency of 9 MHz. The inclusion at the center of the image (1 cm diameter) has a slightly lower backscatter level than the surroundings (background), and its shadow indicates a higher attenuation. A specular reflection from the proximal surface is also seen. (b) B-mode image using the prototype 2D CMUT.
Attenuation coefficients within the phantom were also estimated over the 3–10 MHz frequency range using a reference phantom method (Yao et al 1990). RF data were acquired from the test and reference phantoms using a VFX13-5 linear array transducer attached to the Siemens Antares scanner using the Axius Direct Ultrasound Research Interface (URI). A nominal center frequency setting of 8.9 MHz was used, and the transmit focus was at a 4 cm depth. RF data were downloaded to a personal computer for analysis using the Yao technique (Yao et al 1990). Because of the limited penetration with the high-frequency transducer, data were selected from a depth range of 1.1 cm to 2.9 cm, or proximal to the transmit focal zone.
The reference phantom used is a uniform portion of the “effective frequency phantom” described by Wilson et al (2002). This phantom has a Saran layer window (thickness of 25 µm) for which the frequency-dependent transmission needed to be accounted for. One can find the total intensity transmission coefficient through the Saran layer (Kinsler et al 1999):
| (1) |
where Z1 is the characteristic acoustic impedance (product of density and speed of sound) of the transducer, Z2 is the acoustic impedance of the Saran layer and Z3 is the acoustic impedance of the phantom. λ2 is the wavelength and c2 is the speed of sound in the thin Saran layer, and f is the frequency. In this study, Z1 = 1.54e6 kg m−3 (impedance of the transducer), Z2 = 4.25e6 kg m−3 (impedance of Saran) and Z3 = 1.60e6 kg m−3 (impedance of the reference phantom). Because the acoustic signal is transmitted to the phantom and its echo is received by the transducer, the signal passes through the Saran film twice; therefore, the intensity transmission correction factor should be T4.
Figure 2 shows the results for the estimated attenuation of the oil-in-gelatin phantom. Estimated values are in very good agreement with the nominal value of 0.5 dB cm−1 MHz−1. Note that the reference phantom has a sound speed of 1540 m s−1, while the sample, oil-in-gelatin phantom, has a sound speed of 1480 m s−1. Therefore, small errors in the attenuation estimation are possible using the reference phantom method (Yao et al 1990), particularly near the transmit focal depth of the transducer; hence, this region was avoided for these measurements.
Figure 2.
Attenuation estimates of the uniform background part of the oil-in-gel phantom using the ‘effective frequency phantom’ as a reference. Data were analyzed from a depth range of 1.1–2.9 cm.
2.3. Data acquisition with the CMUT
CMUT imaging of the oil-in-gelatin phantom was done in Mountain View, CA, at Siemens Corporation by one of the authors (TJH). The phantom was immersed in oil with the transducer in direct contact with the TM material. RF data were again acquired using the Axius Direct URI, but for this transducer in parallel image planes. Scan plane steps of 0.214 mm elevationally were applied, recording echo data from 140 planes to produce a volumetric RF echo data set. RF data for all beam lines in each plane were digitized at 40 MHz and were saved for offline analysis using the Siemens Axius Direct URI. In addition to producing B-mode images, RF echo data were also used to estimate attenuation and to form scatterer size images.
2.4. Volunteer study
A volunteer known to have a breast fibroadenoma was scanned at Siemens, Mountain View, CA. RF data were acquired in 140 parallel planes using the 2D CMUT transducer; the transducer was aligned such that the central plane was approximately in the middle of the palpable mass. Data were also taken of a reference phantom (‘effective frequency phantom’) using the same equipment settings. The acoustic impedance of the 2D CMUT transducer is not known, so we assumed it has the acoustic impedance of water (similar to that for VFX13-5) when computing the transmission coefficient through the Saran layer covering the reference phantom.
2.5. Data analysis: effective scatterer size estimations
Effective scatterer sizes are computed using the frequency-dependent backscatter coefficient estimated from the echo data. After computing the echo signal power spectrum from a region of interest, data from a reference phantom are used (Yao et al 1990) to compensate for system-dependent factors affecting the RF data. Thus, the general equations for backscatter coefficient estimation are given by (Chen et al 1998, Gerig et al 2003, Insana and Brown 1993, Liu 2007, Yao et al 1990)
| (2) |
where S stands for the echo signal power spectrum, σ is the backscatter coefficient, z is the depth, α is the attenuation coefficient and ω = 2πf is the angular frequency. The subscripts s and r refer to the sample and reference, respectively, and the speed of sound is assumed to be the same for the sample and the reference. The backscatter coefficient as a function of frequency for the reference phantom can be carefully measured, or in some cases, calculated theoretically, e.g., using expressions derived by Faran (Faran 1951) for acoustic scattering from spheres, or using a Gaussian model (Gerig 2004). The last part of equation (2) is an attenuation correction term, accounting for differences between the attenuation coefficient of the sample and that of the reference medium.
After the sample backscatter coefficient, σs(ω), is calculated from equation (2), effective scatterer size estimation is accomplished by performing a modified least-squares fit (Insana and Hall 1990) between themeasured backscatter coefficient for a tissue segment and a backscatter model, σt(ω), which is dependent upon tissue/scatterer properties, including scatterer size. The effective scatterer size estimate is given by (Gerig et al 2003) (note that the summation is restricted to the usable bandwidth (6 dB above the noise floor and within the 0.5 < ka < 1.6 range) of the backscatter coefficient measurement):
| (3) |
where
If a Gaussian spatial autocorrelation function is used, equation (3) can be solved analytically using a standard calculus min–max approach by setting the derivative of equation (3) to be zero (Gerig et al 2003, Oelze and O’Brien 2002). This yields:
| (4) |
Where, and c is the speed of sound. Note that statistical fluctuations in the echo data from the reference phantom may introduce large variations into scatterer size estimations. Therefore, averaging of reference phantom spectral data over independent RF A-lines acquired from a large number, say at least 20 independent images of a large, uniform phantom, is needed to reduce that source of variation (Gerig et al 2003, Liu 2007).
3. Results
3.1. B-mode images of the phantom
Figures 3(a) and (b) show B-mode images from one plane in the oil-in-gelatin phantom, with the inclusion at the center of the image. Images are shown for acquisitions using both the VFX13-5 probe and the 2D CMUT. The VFX13-5 was focused at 4 cm, while the focus of the 2D CMUT was set to 2 cm for these images. Note that the image quality for the CMUT data gets poorer beyond the transmit focus region. The horizontal line echo in figure 3(a) is a reflection from the boundary of the two layers forming the phantom background. (The phantom background was manufactured in two stages, and although nominally identical material was used in both parts, slight variations in density and/or sound speed evidently occurred, resulting in a small impedance mismatch at the horizontal planar interface between the two parts.)
The inclusions are difficult to visualize on the B-mode images, though specular reflection at the top can be visualized, particularly in figure 3(a). Also notable is the partial shadow caused by a slightly greater attenuation in the inclusion. The shallow transmit focus setting when the CMUT images were obtained may be partially responsible for the lower visibility of the inclusion in figure 3(b).
3.2. Transducer bandwidth
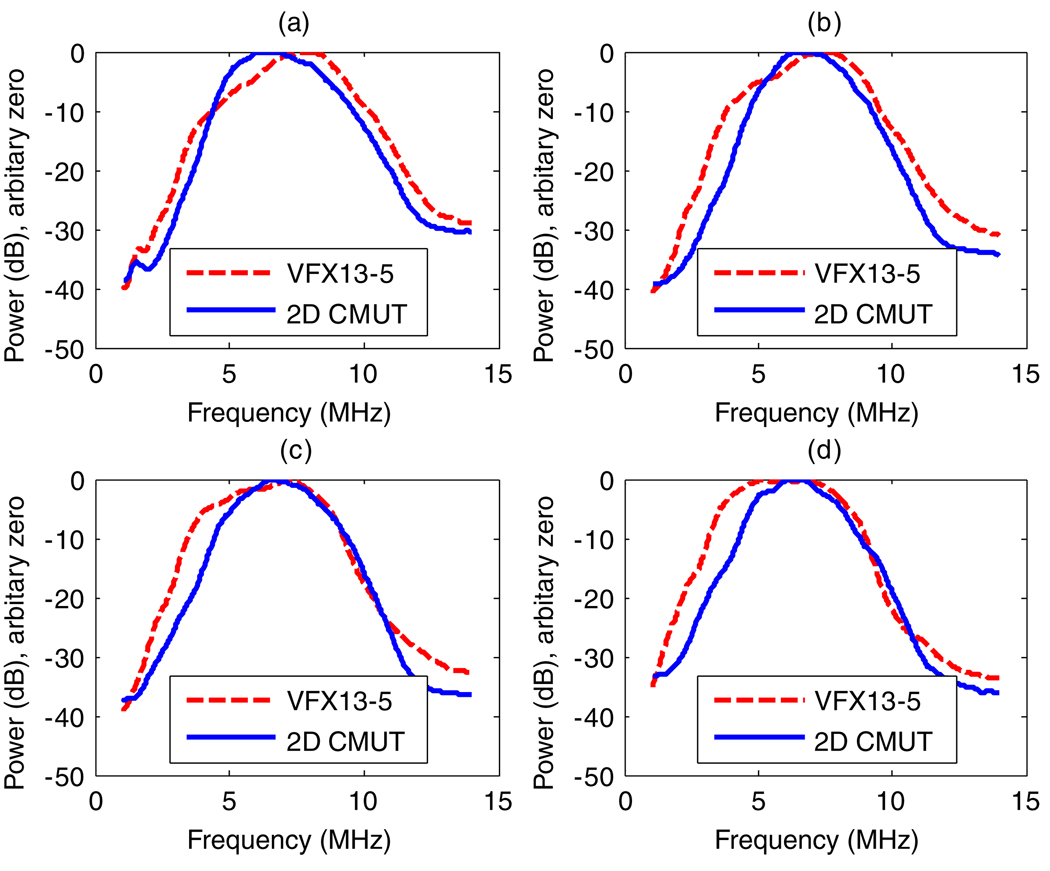
Typical echo signal power spectra acquired from the background material in the phantom using both the VFX13-5 and the 2D CMUT are displayed in figure 4. Spectra from depths of 1, 1.5, 2 and 2.5 cm were computed from the RF echo data of 40 A-lines using a 5 mm rectangular window. Because the prototype 2D CMUT was not tuned to provide the best possible bandwidth, its bandwidth was similar to that of the VFX13-5 and less than that expected with CMUT technology.
Figure 4.
The power spectra acquired using the VFX13-5 and the prototype 2D CMUT, for echo data recorded at 1, 1.5, 2 and 2.5 cm depths ((a), (b), (c) and (d), respectively). In each case, the spectrum was calculated for data within a 5 mm rectangular window.
3.3. Lateral beam width and elevational resolution
An indication of the width of the beam in the lateral and elevational directions was obtained by measuring correlation coefficients between data from neighbouring beam lines from a uniform echo field, for both the VFX13-5 data and the 2D CMUT data. These were computed using:
| (5) |
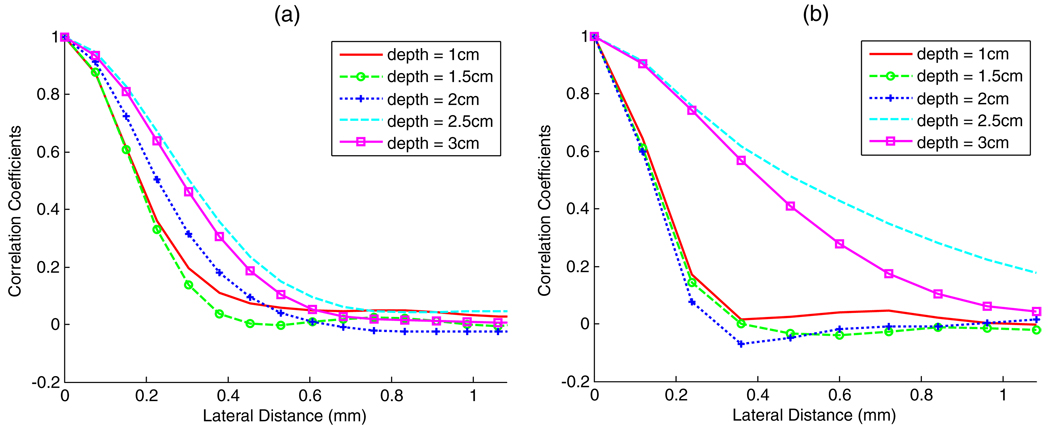
where xi and yi are RF echo signal values for A-lines x and y, respectively, at data value position i in the subregion of the echo data, and x¯ and y¯ are the sample mean values within this subregion. The summation is over i. Correlation results from over 100 A-lines were averaged to produce the plots shown in figure 5, where data of (a) the VFX13-5 and (b) the 2D CMUT are compared. The measurements are performed at 1, 1.5, 2, 2.5 and 3 cm depths, using a 5 mm range gate length.
Figure 5.
(a) Lateral RF beam line correlation at different depths for the VFX13-5. (b) RF beam line correlation at different depths for the prototype 2D CMUT.
The beam separation to obtain RF echo signal correlation of 1/e or less is reduced from ~0.3 mm for the VFX13-5 to ~0.2 mm for the 2D CMUT at a 2 cm depth (near the transmit focus for both transducers. Note, for the VFX13-5 beam width analysis, the data were acquired previously using the “effective frequency phantom”. Unlike the oil-in-gel phantom data, the transmit focus was set to 2 cm here.). Because the 2D CMUT focus was set to 2 cm, the correlation length viewed in figure 5(b) increased substantially for the regions beyond the proximal surface of the inclusion. However, the depth dependence for the VFX13-5 is less substantial. (Note, the transmit F-number is 1.33 for the VFX13-5 and 1.5 for the 2D CMUT; the receiving F-number is 0.5 for both the VFX13-5 and the 2D CMUT, whenever possible.) Reduced beam widths provide more independent A-lines for a given ROI size, which yield better effective scatterer size estimation accuracy and precision (Liu 2007).
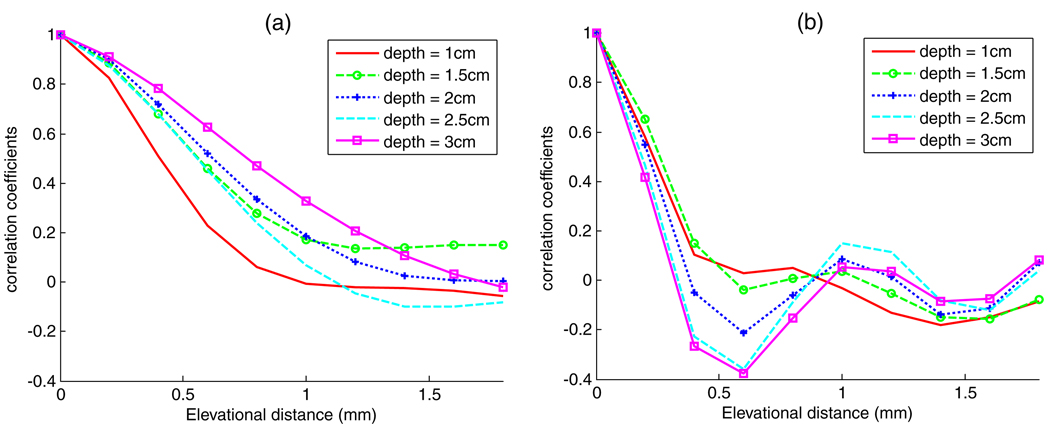
The same correlation measurements were done for the elevational dimension. For the VFX13-5, the experiments were done by mounting the transducer on a translation stage allowing RF data acquisition over 50 parallel planes with a 0.2 mm elevational separation between planes. The correlation measurements were averaged over 25 planes to produce figure 6, which compares elevational beam correlation of (a) the VFX13-5 and (b) the 2D CMUT. Again, the measurements are done at 1, 1.5, 2, 2.5, and 3 cm depths using a 5 mm gated signal segment at each depth. Results from 100 segments are averaged. The results shown in figure 6 indicate that at a 2 cm depth (around the transmit focus for both transducers) the correlation coefficient reduced to less than 1/e for ~0.25 mm elevational separation for the 2D CMUT, which is better than the ~0.75 mm elevational separation for the same correlation using the VFX13-5 transducer. The more rapid elevational decorrelation potentially yields considerable improvement of parametric imaging by applying an elevational compounding technique because the estimation variance is reduced for a given spatial resolution (Liu 2007). The Fresnel lens used to focus the 2D CMUT in elevation suffers from elevational side lobes, however, which may have a negative impact on effective scatterer size estimations.
Figure 6.
(a) Elevational RF beam line correlation at different depths for the VFX13-5 transducer. (b) Elevational RF beam line correlation at different depths for the prototype 2D CMUT.
3.4. Scatterer size imaging of the phantom
The 2D CMUT phantom data were taken at Siemens Ultrasound Division in Mountain View, CA. No reference phantom data were obtained during the initial scanning session, so an alternative reference phantom method was applied to analyze this data. The VFX13-5 transducer was used at the University of Wisconsin—Madison to acquire data from both the reference phantom (“effective frequency phantom”) and the oil-in-gelatin phantom. We then used the reference phantom method to estimate the backscatter in the background part of the oil-in-gelatin phantom. RF echo data from 20 reference planes and 20 background planes containing no inclusions were obtained. The backscatter coefficient (BSC) versus frequency curve of the background material was estimated by analyzing data from all 20 planes and from over 100 A-lines per plane. For the present measurements of backscatter, echo signals from a depth range of 1.3 to 2.8 cm were selected and a 4 ms (3 mm) window was used for computing the echo signal power spectra.
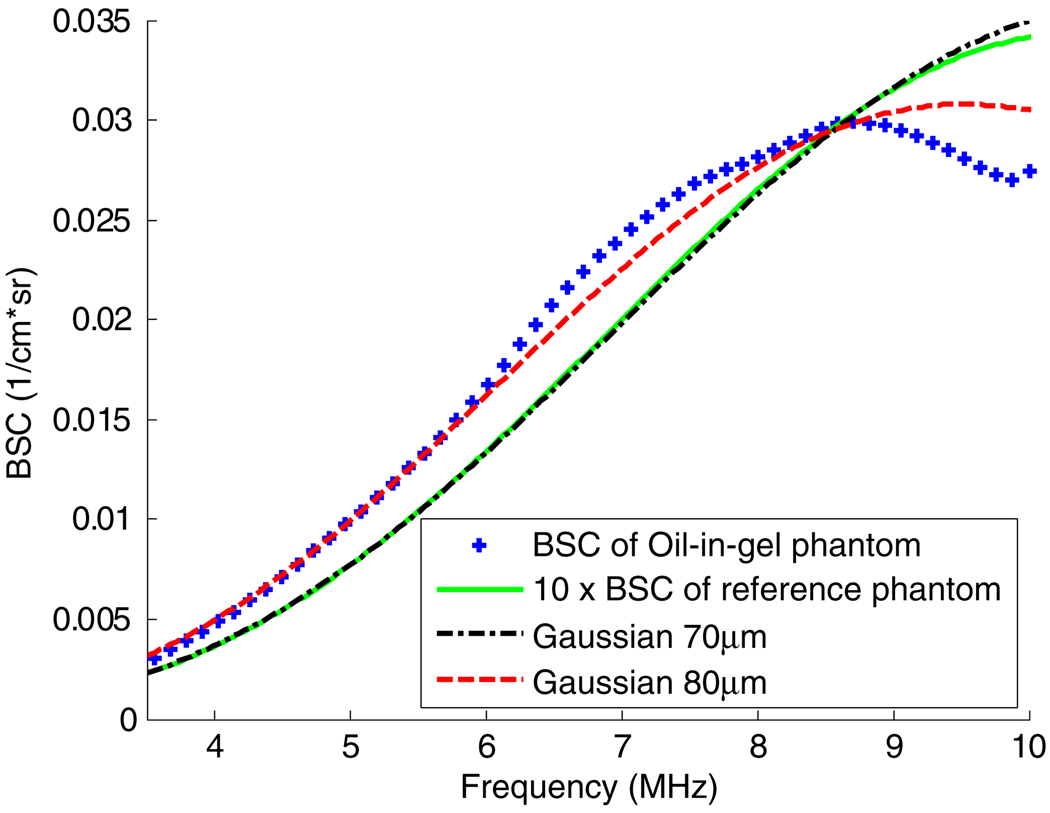
Backscatter versus frequency results for the oil-in-gelatin phantom are shown in figure 7, where data are plotted as +’s. The axial window size is 13 wavelengths (~3 mm) of the effective center frequency. Also shown are backscatter versus frequency results for the reference (solid green line) and backscatter calculations applying a Gaussian spatial autocorrelation model for both 80 µm and 70 µm scatterer diameters. The result for the oil-in-gelatin phantom background shows a good fit to the Gaussian model except for the region above 9 MHz. The Gaussian spatial autocorrelation function effective scatterer diameter estimated using this curve is ~80 µm.
Figure 7.
Estimated backscatter coefficient versus frequency of the background in the oil-in-gel phantom. The effective Gaussian SAF scatterer size of the background part of the phantom is 80 µm. It is 70 µm for the reference phantom.
In order to calculate the effective scatterer size of the spherical inclusion for the 2DCMUT data, the background planes (planes 21–35) were used as a reference, while 11 planes (planes 65–75) containing the inclusion were used as the sample. Data plane 70 passes through the center of the sphere. The combined 11-plane volumetric sample spans only 2.3 mm elevationally, so the size of the circular intersection of the sphere does not vary substantially over the planes analyzed. The estimated background BSC versus frequency (figure 7) was used as the known reference medium BSC for estimating the BSC of the spherical inclusion (equation (2)).
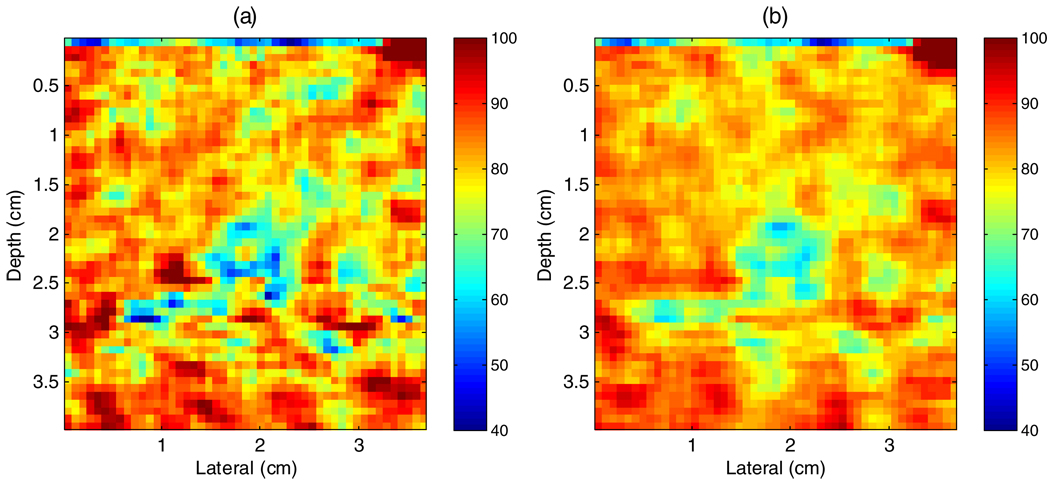
Effective scatterer size images generated with the 2D CMUT probe are shown in figure 8. The analysis block size (pixels over which the individual scatterer size estimates are done) is 3 mm × 3 mm with 75% overlap in both directions. Figure 8(a) is a result using data only from plane 70, and figure 8(b) is the spatial compounding result using data from planes 65 to 75. Substantial improvement is noticed in the compounded data. Even if only one plane is used, the scatterer size image clearly identified the inclusion, which is barely seen on the B-mode images (figure 3).
Figure 8.
(a) Prototype 2D CMUT scatterer size image of the inclusion phantom using data plane 70. (b) Elevation-compounded scatterer size image using planes 65–75 from the prototype 2D CMUT.
Figure 9(a) shows the averaged scatterer size estimates in the inclusion and its surrounding background versus the number of planes used for spatial compounding. The associated error bars depict ± one standard deviation. With 11-plane compounding, the inclusion scatterer size is ~68 ± 5 µm, while the scatterer size within the background is about 79 ± 5 µm. The form factor for 48 µm diameter glass beads coincides closely to the Gaussian form factor for an effective scatterer size of approximately 70 µm (Gerig 2004, Liu 2007) (figure 7). The parameter compounding (estimate the scatterer size for each plane and compound the size estimates) results shown here are almost identical to spectral compounding results, also done, where we first compounded the power spectra estimates from corresponding locations of closely spaced acquisition planes, and then estimated the scatterer size using the compounded power spectra. Figure 9(b) shows that if no elevational compounding is used, the fractional standard deviation of the size estimates is about 12% for both the spherical inclusion and the background. Elevational compounding of 11 adjacent planes reduces it to 7% for both media.
Figure 9.
(a) Average scatterer size measured for the inclusion and surrounding background versus the number of elevational planes compounded. Error bars illustrate standard deviations of the estimated scatterer size. (b) Average standard deviation versus number of planes compounded for the inclusion and the surrounding background.
3.5. Volunteer images
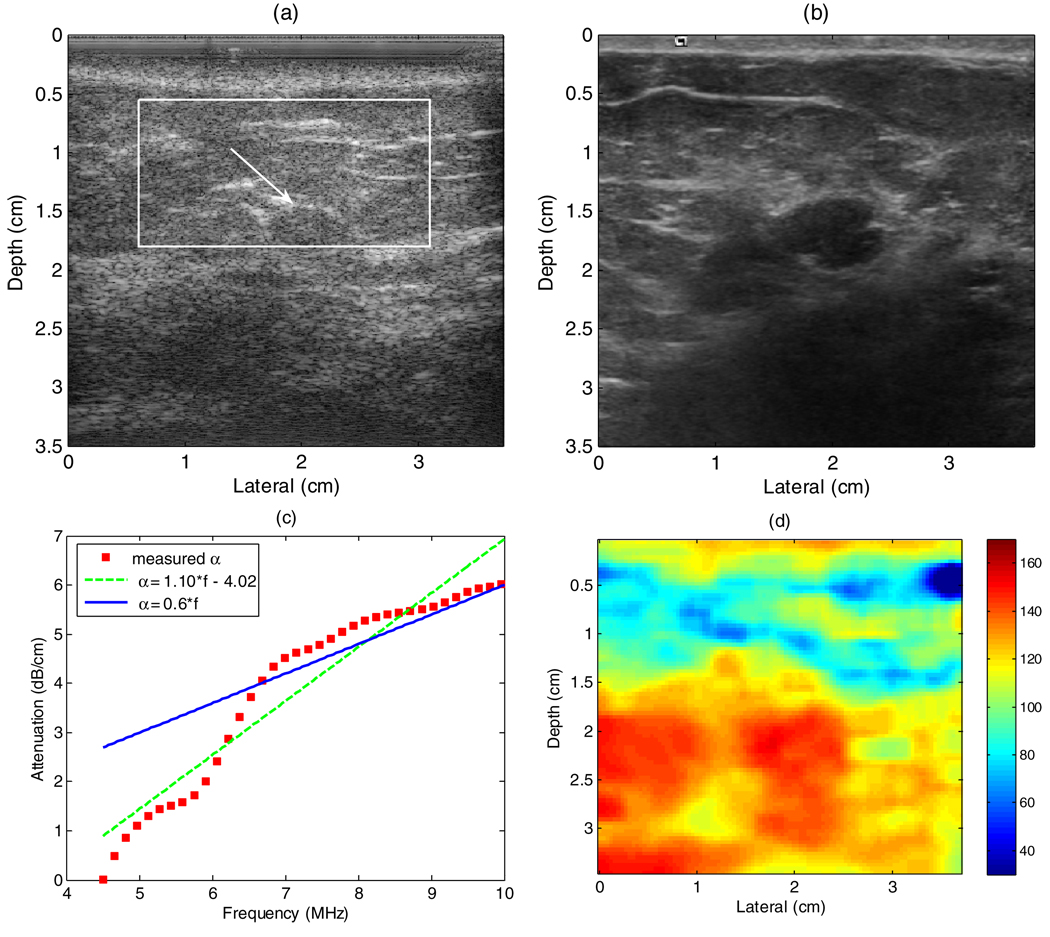
Figure 10(a) is a B-mode image using the 2D CMUT at plane 70 of the breast of a volunteer with a fibroadenoma. Figure 10(b) is a B-mode image using the VFX13-5 at the similar position. Note, the 2D CMUT is a prototype and has not been optimized for image quality as has been done with the commercially available VFX13-5. To obtain a scatterer size image, it is necessary to estimate the overlying attenuation for the transducer to tumor path. For these preliminary results, this was done using a reference phantom method, computing a result for the entire ROI, indicated by the box in figure 10(a). First, power spectra were estimated using 3 mm analysis windows across the entire width of the large ROI. This was repeated over the entire depth of the ROI using 75% overlap with the preceding depth. The entire process was then repeated with a reference phantom. The reference phantom method was then applied to estimate the attenuation within the breast (Liu 2007). The result for the breast sample is shown by the squares in figure 10(c). The overall attenuation within this region is approximately 0.6 dB cm−1 MHz−1, which is somewhat lower than that found in larger studies reported in the literature (D’Astous and Foster 1986, Landini and Sarnelli 1986).
Figure 10.
(a) B-mode image of a fibroadenoma using the prototype 2D CMUT and (b) the VFX13-5. The data in the box were used to calculate an average attenuation. The arrow points to the fibroadenoma. (c) The attenuation estimation within the box of panel (a). (d) An effective scatterer size image of the fibroadenoma obtained with the prototype 2D CMUT.
This estimated average attenuation was then used to estimate the effective scatterer size using the reference phantom method even though the resultant attenuation compensation procedure is coarse. More accurate attenuation compensation procedures for tissue scatterer size imaging are under investigation.
Figure 10(d) shows the scatterer size image with 11-plane compounding. The resultant images with more planes used in compounding were smoother than these with less planes used in compounding. The effective scatterer diameter of the fibroadenoma obtained by assuming a Gaussian SAF is around 110–125 µm. Interestingly, this value is comparable to the 105 µm reported for rat fibroadenoma by Oelze et al (2004). The results deeper than 2 cm are not reliable because the attenuation is estimated only for the region with depths of 0.55–1.8 cm.
4. Discussion and conclusions
CMUT transducers may offer advantages in quantitative ultrasound imaging because of their wide bandwidth, higher resolution and their potential for being fabricated into 2-D arrays. Wide bandwidths are advantageous because of the frequency range they may provide for determining scattered intensity versus frequency from tissues, an important feature used in parametric imaging, such as of the scatterer size. 2D arrangements can be used advantageously for many forms of spatial compounding, including elevational compounding, as explored in this study.
This paper reports initial use of a 2D CMUT for quantitative imaging of scatterer size, a mode being explored by many investigators for diagnosing masses in the breast (Oelze et al 2004), prostate (Feleppa et al 1999), liver (Liu 2007) and thyroid (Wilson et al 2006). Results estimating scatterer size in a phantom demonstrate the feasibility of the approach, although offline analysis is still required to generate the images.
The prototype 2D CMUT driven by a Siemens Antares machine offered better image resolution than a conventional piezoelectric transducer having similar frequency characteristics from the same manufacturer. The improved resolution is demonstrated by the spatial autocorrelation function measurements in figure 5 and figure 6. An important drawback, however, of the present CMUT system is the presence of elevational side lobes, as shown in figure 6(b). These are believed to be created by the Fresnel lens arrangement of the implementation used in the prototype transducer (Daft et al 2005, 2003), and might be reduced, for example, by adding a second firing with a 90° phase shift (Daft et al 2003).
The CMUT probe provided accurate scatterer size estimates for scatterers within a gel phantom. The 2D linear array raster scanning of the 2D CMUT facilitates the use of elevational compounding to reduce statistical fluctuations in these quantitative images. The addition of angular compounding could further reduce statistical uncertainties in quantitative ultrasound images (Gerig et al 2004, Liu et al 2006). Scatterer size images of the phantom demonstrate the potential of this level of tissue characterization and quantitative imaging with a CMUT. An initial image of a fibroadenoma yielded scatterer size estimates consistent with published results in an animal model of fibroadenoma.
The prototype 2D CMUT has not been optimized in many respects, including image quality, and so its sensitivity and bandwidth are well below that expected in an optimized array. Optimization would improve the focal properties, electrical characteristics for electromechanical coupling to the ultrasound system, etc., to achieve B-mode image performance comparable to the existing 1D PZT arrays. The bandwidth of this prototype is similar to that of the VFX 13-5 transducer. If this limitation is overcome, large bandwidths will further improve parametric imaging.
If the 2D CMUT can be tuned to broader bandwidths, and if side lobe levels can be suppressed, the performance of the 2D CMUT for ultrasound parametric imaging would be extensively improved. Commercially available 2D CMUT’s may be useful for quantitative imaging, and continued development of these transducers is certainly encouraged!
Acknowledgments
The authors wish to thank Dr Tony Gerig, Dr Tim Stiles, Mr Gary Frank, and Mr Ted Fisher for their help on the experiments and discussion. This research was supported in part by NIH grants R01EB000459 and R01CA100373 and by a Richard Mazess Advanced Fellowship (WL).
References
- Chen JF, Zagzebski JA, Dong F, Madsen EL. Estimating the spatial autocorrelation function for ultrasound scatterers in isotropic media. Med. Phys. 1998;25:648–655. doi: 10.1118/1.598247. [DOI] [PubMed] [Google Scholar]
- D’Astous FT, Foster FS. Frequency dependence of ultrasound attenuation and backscatter in breast tissue. Ultrasound Med. Biol. 1986;12:795–808. doi: 10.1016/0301-5629(86)90077-3. [DOI] [PubMed] [Google Scholar]
- Daft C, Wagner P, Bymaster B, Panda S, Patel K, Ladabaum I. cMUTs and electronics for 2D and 3D imaging: monolithic integration, in-handle chip sets and system implications; Proc. IEEE Ultrason. Symp; Rotterdam, The Netherlands. 2005. pp. 463–474. [Google Scholar]
- Daft C, Wagner P, Panda S, Ladabaum I. Elevation beam profile control with bias polarity patterns applied to microfabricated ultrasound transducers; Proc. IEEE Int. Ultrason. Symp; Honolulu, HI. 2003. pp. 1578–1581. [Google Scholar]
- Faran JJ. Sound scattering by cylinders and spheres. J. Acoust. Soc. Am. 1951;23:405–418. [Google Scholar]
- Feleppa EJ, et al. Progress in two-dimensional and three-dimensional ultrasonic tissue-type imaging of the prostate based on spectrum analysis and nonlinear classifiers. Mol. Urol. 1999;3:303–310. [PubMed] [Google Scholar]
- Gerig A. PhD Dissertation. Madison: University of Wisconsin; 2004. Ultrasonic scatterer size estimation and imaging with a clinical scanner. [Google Scholar]
- Gerig A, Zagzebski J, Varghese T. Statistics of ultrasonic scatterer size estimation with a reference phantom. J. Acoust. Soc. Am. 2003;113:3430–3437. doi: 10.1121/1.1568945. [DOI] [PubMed] [Google Scholar]
- Gerig AL, Varghese T, Zagzebski JA. Improved parametric imaging of scatterer size estimates using angular compounding. IEEE Trans. Ultrason. Ferroelectr. Freq. Control. 2004;51:708–715. [PubMed] [Google Scholar]
- Hall TJ, Insana MF, Harrison LA, Cox GG. Ultrasonic measurement of glomerular diameters in normal adult humans. Ultrasound Med. Biol. 1996;22:987–997. doi: 10.1016/s0301-5629(96)00142-1. [DOI] [PubMed] [Google Scholar]
- Haller MI, KhuriYakub BT. A surface micromachined electrostatic ultrasonic air transducer. IEEE Trans.Ultrason. Ferroelectr. Freq. Control. 1996;43:1–6. [Google Scholar]
- Insana MF, Brown DG. In: Ultrasonic Scattering in Biological Tissues. Shung KK, editor. Boca Raton, FL: CRC Press; 1993. pp. 75–124. [Google Scholar]
- Insana MF, Hall TJ. Parametric ultrasound imaging from backscatter coefficient measurements: image formation and interpretation. Ultrason. Imaging. 1990;12:245–267. doi: 10.1177/016173469001200402. [DOI] [PubMed] [Google Scholar]
- Insana MF, Hall TJ, Wood JG, Yan ZY. Renal ultrasound using parametric imaging techniques to detect changes in microstructure and function. Invest. Radiol. 1993;28:720–725. doi: 10.1097/00004424-199308000-00013. [DOI] [PubMed] [Google Scholar]
- Kinsler LE, Frey AR, Coppens AB, Sanders JV. Fundamentals of Acoustics. New York: Wiley; 1999. [Google Scholar]
- Ladabaum I, Jin XC, Soh HT, Atalar A, Khuri-Yakub BT. Surface micromachined capacitive ultrasonic transducers. IEEE Trans. Ultrason. Ferroelectr. Freq. Control. 1998;45:678–690. doi: 10.1109/58.677612. [DOI] [PubMed] [Google Scholar]
- Landini L, Sarnelli R. Evaluation of the attenuation coefficients in normal and pathological breast tissue. Med.Biol. Eng. Comput. 1986;24:243–247. doi: 10.1007/BF02441619. [DOI] [PubMed] [Google Scholar]
- Li PC, O’Donnell M. Elevational spatial compounding. Ultrason. Imaging. 1994;16:176–189. doi: 10.1177/016173469401600303. [DOI] [PubMed] [Google Scholar]
- Liu W. PhD Dissertation. Madison: University of Wisconsin; 2007. In vivo ultrasound scatterer size imaging on liver tumors with a clinical scanner. [Google Scholar]
- Liu W, Zagzebski JA, Varghese T, Gerig AL, Hall TJ. Spectral and scatterer-size correlation during angular compounding: simulations and experimental studies. Ultrason. Imaging. 2006;28:230–244. doi: 10.1177/016173460602800403. [DOI] [PubMed] [Google Scholar]
- Lizzi FL, Alam SK, Mikaelian S, Lee P, Feleppa EJ. On the statistics of ultrasonic spectral parameters. Ultrasound Med. Biol. 2006;32:1671–1685. doi: 10.1016/j.ultrasmedbio.2006.09.002. [DOI] [PubMed] [Google Scholar]
- Lizzi FL, Astor M, Liu T, Deng C, Coleman DJ, Silverman RH. Ultrasonic spectrum analysis for tissue assays and therapy evaluation. Int. J. Imaging Syst. Technol. 1997;8:3–10. [Google Scholar]
- Lizzi FL, Greenebaum M, Feleppa EJ, Elbaum M, Coleman DJ. Theoretical framework for spectrum analysis in ultrasonic tissue characterization. J. Acoust. Soc. Am. 1983;73:1366–1373. doi: 10.1121/1.389241. [DOI] [PubMed] [Google Scholar]
- Madsen EL, Hobson MA, Shi H, Varghese T, Frank GR. Stability of heterogeneous elastography phantoms made from oil dispersions in aqueous gels. Ultrasound Med. Biol. 2006;32:261–270. doi: 10.1016/j.ultrasmedbio.2005.10.009. [DOI] [PMC free article] [PubMed] [Google Scholar]
- Oelze ML, O’Brien WD., Jr Method of improved scatterer size estimation and application to parametric imaging using ultrasound. J. Acoust. Soc. Am. 2002;112:3053–3063. doi: 10.1121/1.1517064. [DOI] [PubMed] [Google Scholar]
- Oelze ML, O’Brien WD, Jr, Blue JP, Zachary JF. Differentiation and characterization of rat mammary fibroadenomas and 4T1 mouse carcinomas using quantitative ultrasound imaging. IEEE Trans. Med.Imaging. 2004;23:764–771. doi: 10.1109/tmi.2004.826953. [DOI] [PubMed] [Google Scholar]
- Oelze ML, Zachary JF, O’Brien WD., Jr Characterization of tissue microstructure using ultrasonic backscatter: theory and technique for optimization using a Gaussian form factor. J. Acoust. Soc.Am. 2002;112:1202–1211. doi: 10.1121/1.1501278. [DOI] [PubMed] [Google Scholar]
- Oralkan O, Ergun AS, Cheng CH, Johnson JA, Karaman M, Lee TH, Khuri-Yakub BT. Volumetric ultrasound Imaging using 2-D CMUT arrays. IEEE Trans. Ultrason. Ferroelectr. Freq. Control. 2003;50:1581–1594. doi: 10.1109/tuffc.2003.1251142. [DOI] [PubMed] [Google Scholar]
- Wilson T, Chen Q, Zagzebski JA, Varghese T, Van Middlesworth L. Initial clinical experience imaging scatterer size and strain in thyroid nodules. J. Ultrasound Med. 2006;25:1021–1029. doi: 10.7863/jum.2006.25.8.1021. [DOI] [PubMed] [Google Scholar]
- Wilson T, Zagzebski J, Li YD. A test phantom for estimating changes in the effective frequency of an ultrasonic scanner. J. Ultrasound Med. 2002;21:937–945. doi: 10.7863/jum.2002.21.9.937. [DOI] [PubMed] [Google Scholar]
- Yao LX, Zagzebski JA, Madsen EL. Backscatter coefficient measurements using a reference phantom to extract depth-dependent instrumentation factors. Ultrason. Imaging. 1990;12:58–70. doi: 10.1177/016173469001200105. [DOI] [PubMed] [Google Scholar]


