Abstract
(−)-Epigallocatechin-3- gallate (EGCG), the most abundant and biologically active compound in tea, has been proposed to have beneficial health effects, including prevention of cancer and heart disease. Different mechanisms of action of EGCG have been proposed, based mainly on studies in cell line systems, in which EGCG is not stable. It has been proposed that oxidation of EGCG and its production of reactive oxygen species are responsible for the biological activities such as receptor inactivation and telomerase inhibition. It is unclear, however, if this phenomenon occurs in vivo. In the present study, the stability of EGCG and product formation in Tris-HCl buffer was investigated using real- time mass spectrometry combined with tandem mass ion mapping. With real-time mass data acquisition, we demonstrate for the first time the formation of EGCG quinone, EGCG dimer quinone, and other related compounds. The structural information of the major appearing ions was provided by tandem mass analysis of each ion. A mechanism for the autoxidation of EGCG was proposed based on the structural information of these ions. None of these oxidation products were observed in the plasma samples of mice after treatment with 50 mg/kg EGCG, i.p. daily for 3 days. Instead, the methylated and conjugated metabolites of EGCG were observed. Therefore the roles of EGCG autoxidation in the biological activities of this compound in vivo remain to be investigated further.
Keywords: EGCG quinone, EGCG dimers, real-time mass spectrometry, tandem mass ion mapping, autoxidation, tea, mice
INTRODUCTION
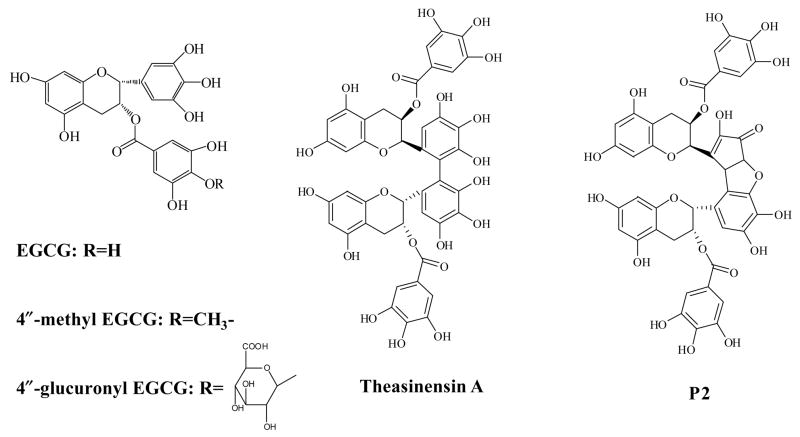
Tea, made from the leaves of Camellia sinensis, has been proposed to have many health benefits including the prevention of cancer and heart disease [1–4]. These effects have been attributed mostly to the polyphenol compounds in tea. (−)-Epigallocatechin-3-gallate (EGCG) is the most abundant and biologically active polyphenol in tea (Figure 1). Green and oolong teas typically contain 30 to 130 mg of EGCG per cup (237 mL); whereas black teas have lower levels of EGCG, but may still contain up to 70 mg per cup [5]. The cancer preventive activity of tea polyphenols has been demonstrated in many animal models. The organ sites include the lung, skin, oral cavity, esophagus, stomach, liver, pancreas, bladder, small intestine, colon, and prostate [1, 3, 6, 7]. The mechanisms of the chemopreventive activity have been studied extensively; however, they are not clearly understood. Different mechanisms of action of these compounds have been proposed, based mainly on studies in various cell line systems. These include inhibition of telomerase activity, mitogen-activated protein kinases, active protein-1 mediated transcription, growth factor- mediated signaling, aberrant arachidonic acid metabolism, and other activities [8]. These events may lead to the inhibition of tumor cell growth or induction of apoptosis as well as the inhibition of angiogenesis.
Figure 1.
Structures of EGCG, EGCG dimers: theasinensin A and P2, and the major metabolites of EGCG: 4″-methyl EGCG and 4″-glucuronyl EGCG
Studies on the mechanisms of the action of EGCG in cell culture systems, however, are complicated by the fact that EGCG is not stable under most cell culture conditions. We and other investigators have shown that under cell culture conditions, EGCG is subject to oxidation, resulting in the formation of reactive oxygen species [9–12]. Our recent results further indicated that under cell culture conditions, EGCG (20 μM) underwent autoxidation and EGCG dimers were formed [9]. Several factors, including pH, temperature, oxygen levels, antioxidant levels, metal ion, concentration of EGCG, and other ingredients in tea, could affect the stability of EGCG [9]. Naasani et al., reported that EGCG underwent degradation at neutral and alkaline condition in Tris-HCl buffer or phosphate buffered saline (pH 7.2), or in human or mouse plasma via an oxidative mechanism, and suggested that degraded EGCG was responsible for telomerase inhibition [12]. It has not been demonstrated, however, if this phenomenon occurs in vivo where the partial pressure of oxygen is much lower than that in cell culture systems (40 vs. 152mm Hg) [13].
In the present study, the stability of EGCG and kinetics of product formation in Tris-HCl buffer were monitored using real-time mass spectrometry combined with tandem mass ion mapping. The possible formation of the oxidized EGCG products and EGCG metabolites in the plasma sample s of mice administered 50 mg/kg EGCG, i.p. was also investigated.
MATERIALS AND METHODS
Materials
EGCG (100% pure) was provided by Mitsui Norin Co. Ltd. (Shizuoka, Japan). Theasinensin A, 4"-methyl EGCG, and 4"-glucuronyl EGCG were synthesized previously in our laboratory [14–16]. Their structures were confirmed by 1H, 13C, and 2D NMR. HPLC-grade solvents and other reagents were obtained from VWR Scientific (South Plainfield, NJ). HPLC-grade water was prepared using a Millipore Milli-Q purification system (Bedford, MA).
Mass analyses
Real-time mass data acquisition experiments were performed on a Finnigan LCQ DECA XP ion trap mass spectrometer (San Jose, CA) equipped with a Finnigan electron spray ionization (ESI) interface and an attached micro syringe pump. Samples or standards were directly infused into ESI in negative ionization mode. Data acquisition of the ESI/ITMS was done with a Finnigan Xcalibur 1.4 version and post-acquisition data processing including background subtraction was done with Xcalibur 2.0 version. ESI and ion guides were optimized for EGCG related mass peaks and to decrease ion suppression effects from tris-HCL buffer and plasma background component ionizations. Optimized parameters include ESI capillary temperature, capillary voltage, ion spray voltage, sheath gas flow rate, tube lens offset voltage, and ion optics settings. These parameters were tuned and changed to accommodate different mass spectrometry experiments including full scan MS and tandem MS/MS.
Analysis of 4″-glucuronyl EGCG and 4″-methyl EGCG was carried out with a Finnigan Spectra System which consisted of a Finnigan model P4000 pump, a model AS3000 refrigerated autosampler, and a Finnigan LCQ Deca mass detector (San Jose, CA) incorporated with electrospray ionization (ESI) interface. The negative ion polarity mode was set for ESI ion source. A 75 × 2.1 mm i.d., 3 μm Discovery HS C18 column (Supelco) was used for separation with a flow rate of 0.2 mL/min. The column elution started with 3-min isocratic phase of 100% solvent A (5% aqueous methanol with 0.2% acetic acid), followed by progressive, linear increases in B (95% aqueous methanol with 0.2% acetic acid) to 40% at 43 min and 100% at 50 min. The mobile phase was then re-equilibrated to 100% A at 51 min for 10 mins. The LC eluent was introduced into the ESI interface. Nitrogen gas was used as the sheath gas at a flow rate of 1.41 L/min and the auxiliary gas at 0 L/min, respectively. The heated capillary temperature and voltage were maintained at 285 °C and −8 V, respectively. The structural information of the standard 4″-glucuronyl EGCG and 4″ methyl EGCG was obtained by tandem mass spectrometry (MS/MS) through collision- induced dissociation (CID) with a relative collision energy setting of 25%.
Stability of EGCG in Tris-HCl buffer
Freshly prepared EGCG solutions (50 or 200 μM) in buffer (20 mM Tris-HCl, pH 7.2) were directly infused into the MS through a 10 mL syringe at flow rate of 5 μL/min for 24 h. The mass spectra were recorded using parent mass ion mapping and tandem mass ion mapping measurement over a mass range from m/z 100 to m/z 1000.
Treatment of mice and plasma collection
Experiments with mice were carried out according to a protocol approved by the Institutional Review Board for the Animal Care and Facilities Committee (IRB-ACFC no. 91-024) at Rutgers University. Male CF-1 mice (30–35 g) were purchased from Charles River Laboratories and allowed to acclimate for at least 1 week prior to the start of the experiment. The mice were housed 10 per cage and maintained in air-conditioned quarters with a room temperature of 20 ± 2°C, relative humidity of 50 ± 10%, and an alternating 12- h light/dark cycle. Mice were fed Purina Rodent Chow #5001 (Research Diets) and water, and were allowed to eat and drink ad libitum.
EGCG was administered to mice (6 per group), i.p. 50 mg/kg daily for three days. Blood was collected from anesthetized animals by cardiac puncture at 1.5 h after administration of vehicle or EGCG at day three, and plasma was isolated by centrifugation at 9000g for 15 min. Plasma was combined with a 1/10th volume of ascorbate preservative (20% ascorbic acid−0.1% EDTA) and stored at −80°C for later analysis.
Plasma sample preparation and mass analysis
Plasma sample (200 μL) was extracted with methylene chloride and ethyl acetate twice, successive ly. The ethyl acetate fractions were pooled and dried under vacuum. Samples were reconstituted in methanol for mass analysis. The mass spectra were recorded using full scan MS and tandem mass ion mapping over a mass range from m/z 100 to 1000 and from m/z 860 to 960, respectively.
RESULTS
EGCG stability and kinetics of product formation in buffer using real-time mass spectrometry
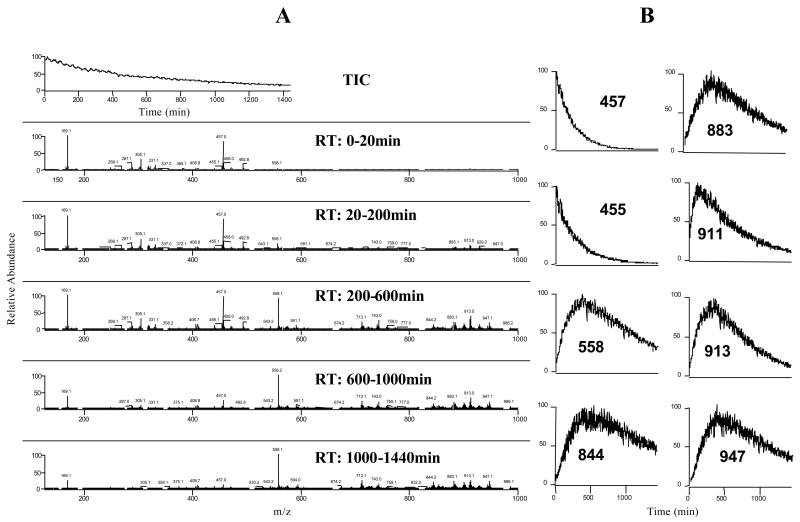
In order to study the stability of EGCG and a kinetic profile of product formation, we conducted real- time mass data acquisition of EGCG solutions over a period of 24 h. The starting EGCG concentrations were 50 and 200 μM. The time-dependent change of EGCG concentration and product formation in Tris-HCl buffer (pH 7.2) was recorded (Figure 2). We observed that the intensity of EGCG ion (m/z 457 [M-H]−) decreased with an approximate half- life (t1/2) of 2 h and was almost not detectable at 24 h. In the mean time, several new compounds were formed and reached maximum levels at different time points. For example, EGCG quinone (m/z 455 [M-H]−) was observed at the beginning of the measurement with an approximate t1/2 of 120 min. EGCG dimer quinone (m/z 911 [M-H]−) and EGCG dimers (theasinensin A: m/z 913 [M-H]− and P2: m/z 883 [M-H]−) reached peak value at 110, 340, and 400 min (tmax), respectively, and then decreased with an approximate t1/2 of 550, 800, and 883 min, respectively. The tmax and t1/2 of some other compounds, which have not been identified, were as follow: m/z 558 [M-H]−, tmax=380 min, t 1/2=1140 min; m/z 844 [M-H]−, t max=380 min, t 1/2=1280 min; m/z 947 [M-H]−, tmax=380 min, t1/2=1030 min.
Figure 2.
EGCG stability and kinetics of product formation in tris-HCl buffer (pH 7.2). The stability of EGCG (200 μM) in tris-HCl buffer (pH 7.2) was studied by real-time mass data acquisition over 24 h. A. Mass spectra of EGCG solution during different time periods; B. Kinetic curves of the major ions observed during 24 h incubation.
Tandem mass ion mapping of the major ions
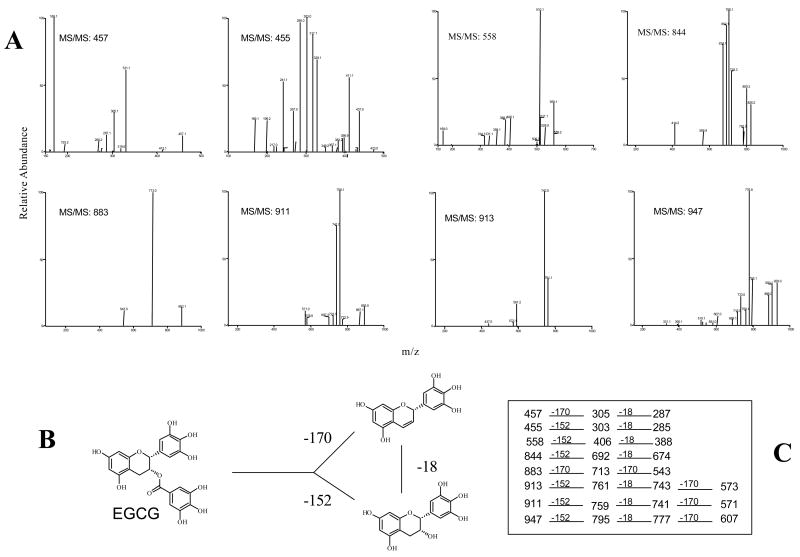
The MS/MS spectra of all the major ions in the EGCG buffer solution were obtained using tandem mass ion mapping measurement. These spectra showed that all of the major ions appearing and disappearing in this solution (m/z 455, 457, 558, 844, 883, 911, 913, 947 [M-H]−) exhibited the typical loss of at least one gallic acid group (M-170) or one galloyl group (M-152) indicating these compounds were structurally related with EGCG (Figure 3). Among them, compounds with molecular ions of 883, 911, 913, and 947 ([M-H]−) were EGCG dimmers, because their MS/MS spectra contain fragments due to loss of two gallic acid groups. We have previously identified theasinensin A (m/z 914) and P2 (m/z 884) as the two major EGCG dimers formed in cell culture media or buffer solutions [9]. Compounds with molecular ion 455 and 911 ([M-H]−) were the EGCG quinone and theasinensin A quinone, respectively.
Figure 3.
Negative ESI MS/MS spectra of the major ions observed during the incubation of EGCG (200 μM) in tris-HCl buffer (pH 7.2). A. MS/MS spectra of the major ions; B. Possible pathway for the mass loss of ga llic acid or galloyl group of EGCG (or related compounds); C. Primary CID pathways from the MS/MS spectra of the major ions.
Metabolite profiles of EGCG in the plasma samples from EGCG-treated mice
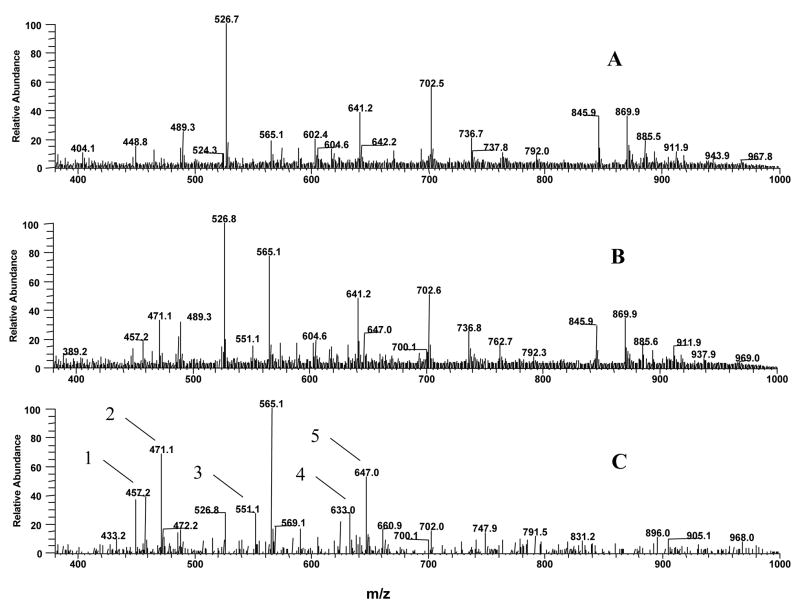
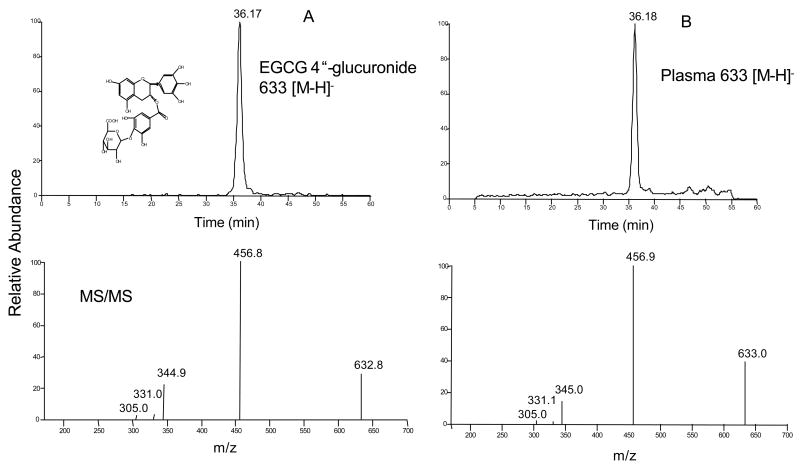
The ethyl acetate extracts of plasma samples from control and EGCG-treated mice were directly infused into the mass spectrometer. The mass spectra contained all the major ions in these two samples (Figure 4A and B). After subtracting the mass spectrum of the plasma sample s from control mice, Figure 4C showed all the ions appearing in the plasma samples from EGCG-treated mice. EGCG and its major metabolites, mono- methylated EGCG (m/z 471 [M-1]−), mono-sulfated methyl EGCG (m/z 551 [M-1]−), mono- glucuronide EGCG (m/z 633 [M-1]−), mono- glucuronide methyl EGCG (m/z 647 [M-1]−), were the major ions appearing in the plasma samples from EGCG-treated mice. However, no EGCG autoxidation products were detected in the plasma samples from EGCG-treated mice. We have previously identified 4″-methyl EGCG as the major mono- methylated metabolite of EGCG in mice and 4″-glucuronyl EGCG as the major mono-glucuronide metabolite of EGCG in human, mouse, and rat microsomes [15, 16]. In order to further confirm that 4″-glucuronyl EGCG was the major mono- glucuronide metabolite of EGCG in mouse plasma, we compared the LC/MS/MS spectrum of the standard 4″-glucuronyl EGCG with that of the corresponding peak in the plasma samples from EGCG-treated mice. 4″-Glucuronyl EGCG standard and the major mono- glucuronide metabolite of EGCG found in the plasma samples from EGCG-treated mice exhibit ed the same chromatographic retention time and molecular masses, and also had the same fragment ion mass spectra (Figure 5), confirming that 4″-glucuronyl EGCG was the major mono-glucuronide metabolite of EGCG in mouse plasma after the mouse received EGCG through i.p. injection.
Figure 4.
Negative ESI mass spectra of control and EGCG treated mouse plasma. A. Mass spectrum of mouse plasma treated with vehicle. B. Mass spectrum of mouse plasma treated with 50 mg/kg EGCG, i.p.. C. Appearing mass ions of plasma samples from EGCG-treated mice after subtracted by the spectrum of plasma samples from vehicle-treated mice (B – A); 1: m/z 457, EGCG (M.W. 458); 2: m/z 471, 4″-methyl EGCG (M.W. 472); 3: m/z 551, mono-sulfated methyl EGCG (M.W. 552); 4: m/z 663, 4″-glucuronyl EGCG (M.W. 634); 5: m/z 647, mono- glucuronide methyl EGCG (M.W. 648).
Figure 5.
Identification of 4″-glucuronyl EGCG by LC/MS/MS. ESI negative LC/MS/MS spectra of standard 4″-glucuronyl EGCG and related peak in mouse plasma after treated with EGCG (50 mg/kg, i.p.). A: LC and MS/MS spectra of standard 4″-glucuronyl EGCG (M.W. 634). B: LC and MS/MS spectra of the peak found in mouse plasma 1.5 h after EGCG treatment.
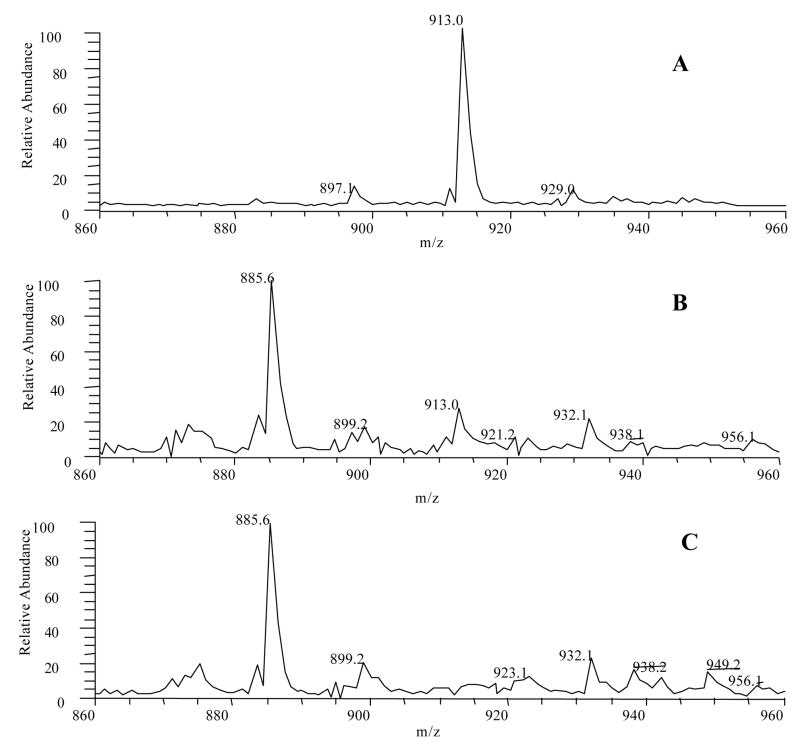
To further investigate the possible existence of EGCG dimers in the plasma samples from EGCG-treated mice, we used theasinensin A, the major oxidation product of EGCG in cell culture medium and buffer solution, to tune the instrument to optimize the conditions for analyzing this compound and structurally related EGCG dimers. The detection limit of theasinensin A was 0.1 ng/mL using tandem mass ion mapping measurement focusing on the mass range of m/z 860–960 (Figure 6), but no EGCG dimers could be detected in the plasma sample s from EGCG-treated mice.
Figure 6.
Negative ESI mass spectra of standard theasinensin A and EGCG treated mouse plasma after and before spiking theasinensin A using tandem mass ion mapping focusing on the mass range of 860–960. A. Mass spectrum of standard theasinensin A (10 ng/mL). B. Mass spectrum of EGCG treated mouse plasma after spiking theasinensin A (2.0 ng/mL). The recovery is 55%. C. Mass spectrum of EGCG treated mouse plasma.
DISCUSSION
The purpose of this study was to further understand the fate of EGCG in vitro and in vivo using real-time mass spectrometry combined with tandem mass ion mapping measurement. Real- time mass spectrometry is a very powerful method for short-term (within 2 days) stability study, which can provide the kinetic information of all the compounds in the solution during the time period studied. An ion mapping experiment is best used for full structural characterization of unknown molecules in complex mixtures. A tandem mass ion mapping experiment can collect data on every scan interval in a specified mass range, as well as MS/MS spectra on every mass above an intensity threshold. The combination of these two methods can follow the kinetics of the parent compound disappearance and product formation as well as provide the structural information of all the products. To our knowledge, this is the first study on the stability of dietary phenolic compounds using these two methods.
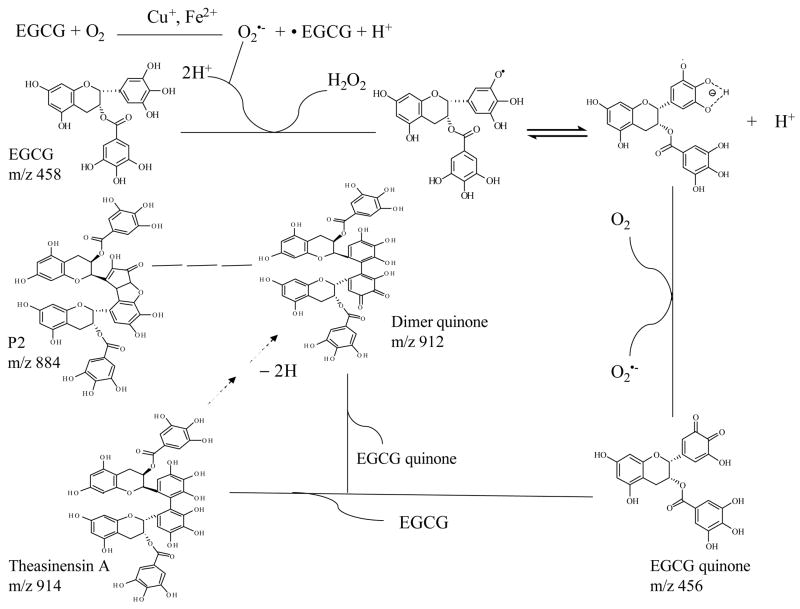
Our results indicated that EGCG was unstable in a pH 7.2 buffer solution and several oxidation products were formed, including EGCG quinone, several dimers and dimer quinone, which were also unstable. EGCG quinone has been proposed as the key intermediate for the formation of many EGCG oxidation products by us and others [17–19], but direct evidence for its existence has been lacking. In the present stud y, we provided for the first time the direct evidence of the formation of EGCG quinone and dimer quinone. Our previous results have indicated that several factors, including pH, temperature, oxygen levels, antioxidant levels, and metal ion, could affect the stability of EGCG [9]. Based on these observations, a mechanism of EGCG autoxidation is proposed (Figure 7). Under neutral or slightly alkaline pH, EGCG is oxidized by molecular oxygen to form EGCG radical (EGCG•) and superoxide radical (O2•− ) in a reaction probably catalyzed by trace metal ions such as Cu2+ or Fe3+. The O2•− can then react with another EGCG molecule to form EGCG• and hydrogen peroxide (H2O2). It has been reported that the pKa of the semiquinone radical of EGCG was 4.8 [20]. Therefore, under neutral or slightly alkaline pH, EGCG• could be an anion radical (EGCG•− ) which reacts with molecular oxygen to form EGCG quinone and generate O2•− . The O2•− can then react with another molecule of EGCG for the propagation of the chain reaction of EGCG autoxidation. The involvement of O2•− in these reactions is supported by the observation that these reactions are inhibited by the presence of superoxide dismutase (SOD) [11]. EGCG quinone can react with EGCG to form EGCG dimer, such as theasinensin A. It also can react with another EGCG quinone to form the quinone of EGCG dimer. This dimer quinone can also be generated from the autoxidation of theasinensin A through the same mechanism as EGCG oxidation. The theasinensin A quinone can be further oxidized to form other dimers, such as P2. This can explain why it takes longer for P2 to reach a peak level than for theasinensin A and its quinone (Figure 2B). This is the alternative mechanism that we proposed previously [11]. It is preferred over the mechanism in which EGCG• react with EGCG to form EGCG dimer radical and the EGCG dimer [11], in that case the formation of EGCG quinone would not far precede the formation of EGCG dimer.
Figure 7.
Possible mechanism for the autoxidation of EGCG in tris-HCl buffer (pH 7.2). Under slightly alkaline pH, EGCG is oxidized by molecular oxygen to form EGCG radical (EGCG•) and superoxide radical (O2•− ) in a reaction probably catalyzed by trace metal ions such as Cu2+ and Fe3+. The O2•− can then react with another EGCG molecule to form EGCG•. Under neutral or slightly alkaline pH, EGCG• could be an anion radical (EGCG•− ) which reacts with molecular oxygen to form EGCG quinone and regenerate O2•− . The O2•− can then react with another EGCG. Thus the chain reaction of EGCG auto-oxidation is propagated. EGCG quinone can react with EGCG to form EGCG dimer, such as theasinensin A. It also can react with another EGCG quinone to form EGCG dimer quinone. This dimer quinone can also be generated from the autoxidation of theasinensin A through the same mechanism as EGCG oxidation. The theasinensin A quinone can be further oxidized to form other dimers, such as P2.
EGCG quinone, the quinone of EGCG dimer, and reactive oxygen species (ROS) generated during EGCG autoxidation may trigger a variety of biochemical reactions. For example, we have demonstrated that, depending on the cell lines and culture conditions, EGCG-induced apoptosis can be completely or partially blocked by the addition of catalase in the culture medium, suggesting that the apoptosis is mediated by H2O2 [21, 22]. We also found that catalase partially blocked EGCG- induced apoptosis and also abolished the effects on TGFβ signaling in transformed human bronchial epithelial cells (21BES) [23]. Recently, we observed that the inhibition of EGFR phosphorylation caused by pre- incubation of the cell with EGCG could be prevented by the presence of SOD, suggesting that the inhibition of the EGFR signaling pathway is caused by the autoxidation of EGCG [11]. However, it is unclear whether the observed autoxidation of EGCG occurs in vivo. Naasani et al. also reported that EGCG was unstable in human and mouse plasma with theasinensin A and P2 as the two major oxidation products [12]. To determine if this phenomenon can be observed in vivo, we attempted to detect those compounds in mouse plasma after EGCG administration. In this study, we used i.p. as administration route because it gives a higher plasma level of EGCG than oral administration. We chose 1.5 h after the last treatment of EGCG because the Tmax of EGCG for i.p. administration is approximately 30 mins (unpublished data). Therefore, 1.5 h plasma sample is equivalent to the sample obtained from incubating EGCG in plasma for 1 h. However, none of the oxidative products could be detected from these plasma samples using the current sensitive tandem mass ion mapping method. Instead, EGCG and its metabolites were detected as the major compounds in these samples. This is the first time that 4″-glucuronyl EGCG is identified as the major glucuronide EGCG in mice.
In this study, using real-time mass spectrometry in combination with tandem mass ion mapping measurement, we demonstrated for the first time the formation of quinone and dimer quinone during the autoxidation of EGCG in vitro. Formation of these oxidative products and EGCG dimers, however, was not observed in vivo. The expected methylated and conjugated metabolites were observed in plasma samples from EGCG-treated mice. We have previously observed the formation of EGCG-ascorbyl adducts in vitro only in the presence of H2O2 (unpublished data). EGCG-thiol adducts have been found in mouse urine samples after administrated of toxic doses of EGCG [24]. However, EGCG-ascorbyl, EGCG-thiol adducts, and EGCG dimers were not detected in this study with nontoxic doses of EGCG. If oxidation of EGCG does occur in vivo, the oxidized EGCG could be reduced by reducing agents (e.g. ascorbic acid) to regenerate EGCG. This would be contrary to the anti-oxidative effects of tea catechins observed in vivo, but this topic need to be further studied in the future. The difference between in vitro and in vivo systems should be considered in studies attempting to elucidate the mechanisms of action of EGCG. This consideration may also apply to the studies of other phenolic compounds.
Acknowledgments
This work was supported by NIH Grant CA88961 and by the facility cores funded by NIEHS center grant ES 05022.
Footnotes
Publisher's Disclaimer: This is a PDF file of an unedited manuscript that has been accepted for publication. As a service to our customers we are providing this early version of the manuscript. The manuscript will undergo copyediting, typesetting, and review of the resulting proof before it is published in its final citable form. Please note that during the production process errors may be discovered which could affect the content, and all legal disclaimers that apply to the journal pertain.
LITERATURE CITED
- 1.Yang CS, Maliakal P, Meng X. Inhibition of carcinogenesis by tea. Annu Rev Pharmacol Toxicol. 2002;42:25–54. doi: 10.1146/annurev.pharmtox.42.082101.154309. [DOI] [PubMed] [Google Scholar]
- 2.Williamson G, Manach C. Bioavailability and bioefficacy of polyphenols in humans. II. Review of 93 intervention studies. Am J Clin Nutr. 2005;81:243S–255S. doi: 10.1093/ajcn/81.1.243S. [DOI] [PubMed] [Google Scholar]
- 3.Landau J, Lambert JD, Lee MJ, Yang CS. Cancer prevention by tea and tea constituents. CRC Taylor & Francis; New York: 2005. pp. 219–237. [Google Scholar]
- 4.Higdon JV, Frei B. Tea catechins and polyphenols: health effects, metabolism, and antioxidant functions. Crit Rev Food Sci Nutr. 2003;43:89–143. doi: 10.1080/10408690390826464. [DOI] [PubMed] [Google Scholar]
- 5.Balentine DAPRI. Tea as a source of dietary antioxidants with a potential role on prevention of chronic diseases. In: Mazza GOB, editor. Herbs, Botanicals, & Teas. Lancaster Technomic Publishing Co., Inc; 2000. pp. 265–287. [Google Scholar]
- 6.Katiyar SK, Elmets CA. Green tea polyphenolic antioxidants and skin photoprotection (Review) Int J Oncol. 2001;18:1307–1313. doi: 10.3892/ijo.18.6.1307. [DOI] [PubMed] [Google Scholar]
- 7.Weisburger JH. Tea and health: the underlying mechanisms. Proc Soc Exp Biol Med. 1999;220:271–275. doi: 10.1046/j.1525-1373.1999.d01-46.x. [DOI] [PubMed] [Google Scholar]
- 8.Hou Z, Lambert JD, Chin KV, Yang CS. Effects of tea polyphenols on signal transduction pathways related to cancer chemoprevention. Mutat Res. 2004;555:3–19. doi: 10.1016/j.mrfmmm.2004.06.040. [DOI] [PubMed] [Google Scholar]
- 9.Sang S, Lee MJ, Hou Z, Ho CT, Yang CS. Stability of Tea Polyphenol (−)-Epigallocatechin-3-gallate and Formation of Dimers and Epimers under Common Experimental Conditions. J Agric Food Chem. 2005;53:9478–9484. doi: 10.1021/jf0519055. [DOI] [PubMed] [Google Scholar]
- 10.Hong J, Lu H, Meng X, Ryu JH, Hara Y, Yang CS. Stability, cellular uptake, biotransformation, and efflux of tea polyphenol (−)-epigallocatechin-3-gallate in HT-29 human colon adenocarcinoma cells. Cancer Res. 2002;62:7241–7246. [PubMed] [Google Scholar]
- 11.Hou Z, Sang S, You H, Lee MJ, Hong J, Chin KV, Yang CS. Mechanism of action of (−)-epigallocatechin-3-gallate: auto-oxidation-dependent inactivation of epidermal growth factor receptor and direct effects on growth inhibition in human esophageal cancer KYSE 150 cells. Cancer Res. 2005;65:8049–8056. doi: 10.1158/0008-5472.CAN-05-0480. [DOI] [PubMed] [Google Scholar]
- 12.Naasani I, Oh-Hashi F, Oh-Hara T, Feng WY, Johnston J, Chan K, Tsuruo T. Blocking telomerase by dietary polyphenols is a major mechanism for limiting the growth of human cancer cells in vitro and in vivo. Cancer Res. 2003;63:824–830. [PubMed] [Google Scholar]
- 13.Sherwood L. Human Physiology: From Cells to Systems. Wadsworth Publishing Co; Belmont, CA: 2004. [Google Scholar]
- 14.Zhu N, Wang MF, Wei GJ, Lin JK, Yang CS, Ho CT. Identification of reaction products of (−)-epigallocatechin, (−)-epigallocatechin gallate pyrogallol with 2,2-diphenyl-1-picrylhydrazyl radical. Food Chem. 2001;73:345–349. [Google Scholar]
- 15.Lu H, Meng X, Li C, Sang S, Patten C, Sheng S, Hong J, Bai N, Winnik B, Ho CT, Yang CS. Glucuronides of tea catechins: enzymology of biosynthesis and biological activities. Drug Metab Dispos. 2003;31:452–461. doi: 10.1124/dmd.31.4.452. [DOI] [PubMed] [Google Scholar]
- 16.Meng X, Sang S, Zhu N, Lu H, Sheng S, Lee MJ, Ho CT, Yang CS. Identification and characterization of methylated and ring- fission metabolites of tea catechins formed in humans, mice, and rats. Chem Res Toxicol. 2002;15:1042–1050. doi: 10.1021/tx010184a. [DOI] [PubMed] [Google Scholar]
- 17.Sang S, Lambert JD, Hong J, Tian S, Lee MJ, Stark RE, Ho CT, Yang CS. Synthesis and structure identification of thiol conjugates of (−)-epigallocatechin gallate and their urinary levels in mice. Chem Res Toxicol. 2005;18:1762–1769. doi: 10.1021/tx050151l. [DOI] [PubMed] [Google Scholar]
- 18.Hernandez I, Alegre L, Munne-Bosch S. Enhanced oxidation of flavan-3-ols and proanthocyanidin accumulation in water-stressed tea plants. Phytochemistry. 2006;67:1120–1126. doi: 10.1016/j.phytochem.2006.04.002. [DOI] [PubMed] [Google Scholar]
- 19.Tanaka T, Matsuo Y, Kouno I. A novel black tea pigment and two new oxidation products of epigallocatechin-3-O-gallate. J Agric Food Chem. 2005;53:7571–7578. doi: 10.1021/jf0512656. [DOI] [PubMed] [Google Scholar]
- 20.Hagerman AE, Dean RT, Davies MJ. Radical chemistry of epigallocatechin gallate and its relevance to protein damage. Arch Biochem Biophys. 2003;414:115–120. doi: 10.1016/s0003-9861(03)00158-9. [DOI] [PubMed] [Google Scholar]
- 21.Yang GY, Liao J, Kim K, Yurkow EJ, Yang CS. Inhibition of growth and induction of apoptosis in human cancer cell lines by tea polyphenols. Carcinogenesis. 1998;19:611–616. doi: 10.1093/carcin/19.4.611. [DOI] [PubMed] [Google Scholar]
- 22.Yang GY, Liao J, Li C, Chung J, Yurkow EJ, Ho CT, Yang CS. Effect of black and green tea polyphenols on c-jun phosphorylation and H(2)O(2) production in transformed and non-transformed human bronchial cell lines: possible mechanisms of cell growth inhibition and apoptosis induction. Carcinogenesis. 2000;21:2035–2039. doi: 10.1093/carcin/21.11.2035. [DOI] [PubMed] [Google Scholar]
- 23.Vittal R, Selvanayagam ZE, Sun Y, Hong J, Liu F, Chin KV, Yang CS. Gene expression changes induced by green tea polyphenol (−)-epigallocatechin-3-gallate in human bronchial epithelial 21BES cells analyzed by DNA microarray. Mol Cancer Ther. 2004;3:1091–1099. [PubMed] [Google Scholar]
- 24.Sang S, Lambert JD, Hong J, Tian S, Lee MJ, Stark RE, Ho CT, Yang CS. Synthesis and Structure Identification of Thiol Conjugates of (−)-Epigallocatechin Gallate and Their Urinary Levels in Mice. Chem Res Toxicol. 2005;18:1762–1769. doi: 10.1021/tx050151l. [DOI] [PubMed] [Google Scholar]


