Abstract
The abuse of synthetic esters of natural steroids such as testosterone and estradiol in cattle fattening and sports is hard to detect via routine urine testing. The esters are rapidly hydrolysed in vivo into substances which are also endogenously present in urine. An interesting alternative can be provided by the analysis of the administered synthetic steroids themselves, i.e., the analysis of intact steroid esters in hair by liquid chromatography tandem mass spectrometry (LC/MS/MS). However, retrospective estimation of the application date following a non-compliant finding is hindered by the complexity of the kinetics of the incorporation of steroid esters in hair. In this study, the incorporation of intact steroid esters in hair following pour-on treatment has been studied and critically compared with results from intramuscular treatment. To this end animals were pour-on treated with a hormone cocktail containing testosterone cypionate, testosterone decanoate and estradiol benzoate in different carriers. The animals were either treated using injection and pour-on application once or three times having 1 week between treatments using injection and pour-on application. Animals were slaughtered from 10–12 weeks after the last treatment. Both hair and blood plasma samples were collected and analysed by LC/MS/MS. From the results, it is concluded that after single treatment the levels of steroid esters in hair drop to CCβ levels (5–20 µg/kg) after 5–7 weeks. When treatment is repeated two times, the CCβ levels are reached after 9–11 weeks. Furthermore, in plasma, no steroid esters were detected; not even at the low microgramme per litre level but—in contrast with the pour-on application—after i.m. injection, significant increase of 17β-testosterone and 17β-estradiol were observed. These observations suggest that transport of steroid esters after pour-on application is not only performed by blood but also by alternative fluids in the animal so probably the steroid esters are already hydrolysed and epimerized before entering the blood.
Keywords: Liquid chromatography, Mass spectrometry, Hair, Testosterone ester, Estradiol benzoate, Pour-on treatment
Introduction
Anabolic steroids are banned substances in the European Union but might still be illegally applied as growth promoters in cattle fattening [1, 2]. In the search for suitable sample matrices, bovine hair has shown to be an attractive sample matrix for prolonged detectability of residues of anabolic steroids and beta-agonists. Such substances can be incorporated into hair from blood via the hair follicle, incorporated from sweat via the hair shaft, absorbed from sweat on the outside of the hair shaft, and/or absorbed from exogenic sources such as (environmental) contamination or intentional illegal pour-on treatment [3–6]. The potential of hair analysis for the determination of steroids and beta-agonists has been demonstrated in several papers [5, 7–18]. Natural steroids are usually administered as synthetic steroid esters but these are rapidly hydrolysed in vivo into natural steroids: following oral intake of testosterone undecanoate, the unchanged ester could be found in plasma from athletes for 6 h only [19]. In urine, it is hard to differentiate between the (metabolites of) endogenous natural steroids always present and the identical (metabolites of) natural steroids from the hydrolysed esters. In doping control, this problem is usually addressed by establishing the 17β-testosterone/17α-testosterone urinary ratio (so-called T/E ratio) [20] and/or the application of 13C/12C isotope ratio mass spectrometry [21]. In food surveillance, relatively high or low findings of 17β-testosterone and 17α-testosterone in urine are often ignored because of the lack of statistically valid reference data of naturally occurring background levels. An interesting alternative for inconclusive urine analyses in veterinary control can be provided by the analysis of the administered synthetic steroids themselves, i.e. the analysis of intact esters of natural steroids in hair. Gleixner and Meyer digested hair samples using dithiothreitol to break up the longitudinal chains of the keratin protein of the hair by reducing the disulfide bonds and applied that method to the determination of the natural steroids estradiol and testosterone [10]. Hooijerink et al. developed an LC/MS/MS method for the determination of intact estradiol benzoate in hair using the reducing agent tris(2-carboxyethyl)phosphine hydrochloride (TCEP) [22]. Meanwhile, that method has been further developed towards a true multiresidue screening method for all kinds of intact esters of testosterone, boldenone and estradiol [23] and adopted by other countries as well [24]. Thanks to this method, several cases of illegal use of synthetic esters of natural steroids were discovered in recent years.
Following a non-compliant finding of a synthetic ester of a natural steroid in hair, questions arise regarding a retrospective estimation of the date of illegal application might arise. In general, there will be no simple answers to that. When no preparations have been found, the route of administration remains unknown and might comprise injection, oral, sublingual, pour-on or other means. Moreover, several papers studying hair segments reported the lack of correlation between incorporation time and growth rate of hair [25–27]. This discrepancy is believed to be due to the fact that steroid esters are mainly incorporated via sweat and sebum excretion at the surface of the skin followed by diffusion into the hair fibre [25]. Apart from that, interindividual differences in metabolisation rates do occur of course.
Data about detectability in hair following pour-on application are rare. Anielski et al. [28] investigated a NorAndrosteDerm application containing prohormones of nortestosterone but intact esters were not studied. Hooijerink et al. [22] reported estradiol benzoate concentrations up to 8500 ng g−1 in bovine hair following pour-on application. Thieme et al. [6] compared transdermal and oral application of anabolic steroids and concluded that effective and durable concentrations of active steroids in blood could be obtained following the former treatment.
This study was designed to test the hypothesis whether the incorporation of intact steroid esters into bovine hair following pour-on treatment is detectable. The findings were critically compared with results from intramuscular treatment. To this end, animals were pour-on treated with a typical hormone cocktail containing testosterone cypionate, testosterone decanoate and estradiol benzoate in different carriers, or by intramuscular injection. Hair and blood samples were collected during several weeks and analysed for intact steroid esters by state of the art LC/MS/MS. Hair samples were taken by using a razor. The possibility of carry-over by using one razor to shave different animals was investigated as well.
Experimental
Chemicals, reagents and solutions
LC-C/MS-grade acetonitrile, water and methanol were obtained from Biosolve (Valkenswaard, the Netherlands). Formic acid, acetone, acetonitrile, ethanol, n-pentane, iso-octane, dithiothreitol and Tris(hydroxymethyl)-amino-methane were obtained from Merck (Darmstadt, Germany). The reduction agent tris(2-carboxyethyl) phosphine hydrochloride (TCEP) was obtained from Sigma (St. Louis, MO, USA). Estradiol benzoate (EB), testosterone cypionate (TC) and testosterone decanoate (TD) were obtained from Sigma-Aldrich Chemie b.v (Zwijndrecht, the Netherlands). N-methyl-N-trimethylsilyl-trifluoro(o)acetamide (MSTFA) was obtained from Alltech (Anaconda, Montana, USA), ammonium iodide was obtained from Fluka (Zwijndrecht, the Netherlands). The steroids 17α-testosterone and 17β-testosterone were obtained from Steraloids (Newport, Rhode Island, US). 17α-Estradiol was obtained from Diosynth (Morrisville, North Carolina, US), 17β-estradiol was obtained from Organon (Oss, the Netherlands) and the internal standards 17β-testosterone-d2 and 17β-estradiol-d3 were obtained from RIVM (Bilthoven, the Netherlands). The deuterium-labelled internal standards d3-estradiol benzoate, d3-testosterone cypionate and d3-testosterone decanoate were in-house-synthesised as described in [23]. The carrier solvents for pour-on application Ivomec® (mixture of isopropanol and Ivermectin B1a, B1b), DMSO (dimethyl sulfoxide Ph Eur), Mygliol® 840 (Triglycerida saturate media Ph Eur), DEGMBE (diethyleneglycol monobutyl ether) and the carrier for injection Arachide oil were obtained from Spruyt Hillen b.v. (IJsselstein, the Netherlands). All other chemicals used were of analytical-reagent grade.
The derivatization reagent MSTFA++ for the free steroid analysis consisted of N-methyl-N-trimethylsilyl-trifluoro(o)acetamide/ammonium jodide/dithiothreitol (1,000/2/4; v/w/w). Individual stock solutions of the steroid esters were prepared by dissolving 10 mg of each compound in 10 ml of methanol. Individual stock solutions of the steroids were prepared by dissolving 10 mg of each compound in 10 ml of ethanol. Solid-phase extraction columns type Bond Elute LRC-C18 Phase 100 mg and 500 mg columns were obtained from Varian (Harbor City, CA, USA).
Equipment
The separation of the steroid esters was carried out using an ultra performance liquid chromatographic (UPLC) system, consisting of vacuum degasser, autosampler and a binary pump (Acquity UPLC system; Waters, Milford, MA) equipped with a reversed phase Waters acquity UPLC BEH C18 analytical column of 100 × 2.1 mm and 1.7 µm particle size. The gradient (solvent A, water–acetonitrile–methanol–formic acid (300:350:350:20, v/v/v/v); solvent B, acetonitrile–methanol–formic acid (500:500:20, v/v/v)) was: 0 min, 0% B; 0.5–6 min, linear increase to 100% B; 6–7.5 min 100% B. Injection volume was 40 µl. The UPLC system was connected to a triple-quadrupole mass spectrometer model Quattro Premier (Waters, Manchester, UK) equipped with an electrospray interface operating in the positive ion mode. The MRM transitions acquired for the different steroid esters of interest are summarised in Table 1.
Table 1.
Steroid esters; specific ions monitored for LC-ESI(+)-MS/MS
| Compound | MRM transition 1 (m/z) | Collision energy MRM transition 1 (eV) | MRM transition 2 (m/z) | Collision energy MRM transition 2 | Rt in min |
|---|---|---|---|---|---|
| Estradiol benzoate | 377 > 105 | 40 | 377 > 77 | 45 | 3.64 |
| Estradiol benzoate-d3 | 380 > 105 | 20 | 3.63 | ||
| Testosterone cypionate | 413 > 97 | 25 | 413 > 107 | 25 | 5.46 |
| Testosterone cypionate-d3 | 416 > 97 | 25 | 5.45 | ||
| Testosterone decanoate | 443 > 97 | 25 | 443 > 109 | 30 | 6.53 |
| Testosterone decanoate-d3 | 446 > 97 | 25 | 6.53 |
The free steroids 17α-, 17β-estradiol and 17α-, 17β-testosterone were analysed by using GC-MS/MS. A Varian (Palo Alto, California, US) 1,200 L triple-quadrupole MS/MS spectrometer equipped with a CP8400 autosampler and CP-3800 GC was used. The GC column was a VF-17MS (L = 30 m, id = 0.25 mm, df = 0.25 µm) obtained from Varian. The temperature programme used started at 110 °C (hold 1 min); increased at 20 °C/min to 240 °C (hold 1.5 min); increased with 1 °C /min to 243 °C followed by an increase of 25 °C/min to a final temperature of 340 °C (hold 2 min). The GC-MS/MS was operated in the EI ionisation mode. The MRM transitions acquired for the different steroids of interest are summarised in Table 2.
Table 2.
Free steroids; specific ions monitored for GC-EI-MS/MS
| Compound | MRM transition 1 (m/z) | Collision energy MRM transition 1 (eV) | MRM transition 2 (m/z) | Collision energy MRM transition 2 |
|---|---|---|---|---|
| 17α-estradiol | 416 > 326 | −7.5 | 416 > 285 | −10.0 |
| 17β-estradiol | 416 > 326 | −7.5 | 416 > 285 | −10.0 |
| 17β-estradiol-d3 | 419 > 285 | −10.0 | ||
| 17α-testosterone | 432 > 327 | −15.0 | 432 > 209 | −12.5 |
| 17β-testosterone | 432 > 301 | −15.0 | 432 > 209 | −12.5 |
| 17β-testosterone-d2 | 434 > 211 | −12.5 |
Samples
An animal trial has been conducted at the Physiology Weihenstephan, Technical University of Münich (Germany). The protocol has been approved by the ethical committee of the ‘Regierung von Oberbayern’. Twenty veal calves (Holstein–Friesian) were obtained from identified sources at an age of 2 weeks. The animals were housed on straw and the different treatment groups were housed in separate pens. The animals were fed according to veal calf practise, using milk replacer and roughage, drinking water was ad lib.
Pour-on experiments were carried out using hormone cocktails containing three steroid esters. Prior to application the animals were shaven on the back from neck to tail. There, they were treated with 10 ml pour-on cocktail. In total, a set of four pour-on hormone cocktails were prepared and for each cocktail, a different carrier solvent was used. The hormone cocktails contained 25 mg of EB, 60 mg of TD and 60 mg of TC per 10 ml of carrier solvent. The carrier solvents used were Ivomec, DMSO, Mygliol 840 and DEGMBE.
Table 3 presents the application scheme. Five animals were not treated at all and were used as reference group. Four animals were treated at day 1, 7 and 14 (repeated treatment) with 10 ml of carrier solvent. Four animals were treated at day 1 with 10 ml of hormone cocktail; each animal was treated with a different carrier solvent. Four animals were treated on day 1, 7 and 14 (repeated treatment) with 10 ml of hormone cocktail. One animal was injected intramuscular in the neck on day 1 with a cocktail of 35 mg EB, 60 mg TD and 60 mg TC and one animal was injected on day 1, 7 and 14 with the hormone cocktail. For the injection, arachide oil was used as the carrier. One animal was injected three times (day 1, 7 and 14) with arachide oil.
Table 3.
Application scheme
| Animal group | Day of treatment | Animal id no. | Type of treatment |
|---|---|---|---|
| Reference group (n = 5 animals) | – | 175, 182, 185, 191, 193 | No treatment |
| Reference group treated (3 times) with carrier solvents only | Day 1, 7 and 14 | 172 | Injection with Arachide oil |
| 173 | Pour-on with carrier solvent DEGMBE | ||
| 177 | Pour-on with carrier solvent DMSO | ||
| 181 | Pour-on with carrier solvent IVOMEC | ||
| 184 | Pour-on with carrier solvent Miglyol | ||
| Treated once | Day 1 | 174 | i.m. injection with hormone cocktaila |
| 178 | Pour-on hormone cocktail in DEGMBE | ||
| 180 | Pour-on hormone cocktail in DMSO | ||
| 183 | Pour-on hormone cocktail in IVOMEC | ||
| 188 | Pour-on hormone cocktail in Miglyol | ||
| Treated three times | Day 1, 7 and 14 | 171 | i.m. injection with hormone cocktail |
| 179 | Pour-on hormone cocktail in DEGMBE | ||
| 187 | Pour-on hormone cocktail in DMSO | ||
| 190 | Pour-on hormone cocktail in IVOMEC | ||
| 192 | Pour-on hormone cocktail in Miglyol |
aHormone cocktail contents 25 mg of estradiol benzoate, 60 mg of testosterone decanoate and 60 mg of testosterone cypionate for each injection or for each 10 ml of carrier solvent
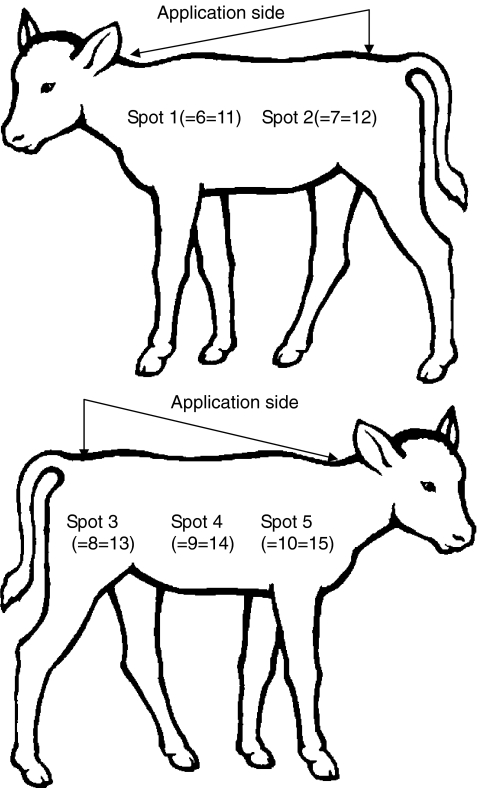
For pour-on application, the liquid-containing steroid esters (hormone cocktail) were spread out over the small (shaved) strip at the back of the animal from neck to tail. Hair samples were taken at least 20 cm off from the application zone. The first hair samples were taken before treatment. After 1 week (7 days) the second hair sample was taken at the next spot (see Fig. 1). The samples taken 35 days after treatment are taken at the same spot as the sample which was taken at day 1. Table 4 and Fig. 1 describe the ‘hair sampling scheme’ including the spots where the samples are taken, the number of days after first treatment and the weeks the hair had been growing at the specific spot. Each sample contained approximately 2–5 g of hair.
Fig. 1.
Spots were the hair samples are taken (see also Table 4)
Table 4.
Sampling scheme for hair samples (see also Fig. 1)
| Spot | Days after first treatment | Weeks of grown hair |
|---|---|---|
| 1 | 0 (before treatment) | 8 |
| 2 | 7 | 9 |
| 3 | 14 | 10 |
| 4 | 21 | 11 |
| 5 | 28 | 12 |
| 6 (=1) | 35 | 5 |
| 7 (=2) | 42 | 5 |
| 8 (=3) | 49 | 5 |
| 9 (=4) | 56 | 5 |
| 10 (=5) | 63 | 5 |
| 11 (=1 = 6) | 70 | 5 |
| 12 (=2 = 7) | 77 | 5 |
| 13 (=3 = 8) | 84 | 5 |
| 14 (=4 = 9) | 91 | 5 |
| 15 (=5 = 10) | 98 | 5 |
Hair samples were taken by using one razor but with one shaver head for each treatment group. To check for carry-over from one hair sample to the other due to the use of only one razor system, a contamination experiment was performed. The (worst case) contamination experiment was as follows: a piece of skin was treated (pour-on) using the steroid cocktail. The hair directly on the pour-on spot was collected by using a razor. The razor was cleaned dry by carefully removing the hair and blowing some air through the razor. No visible pieces of hair were left. The same razor was used to shave an untreated piece of skin. This hair sample was tested for containing residues of steroids esters.
Samples of blood were taken at days 1, 2, 3, 4, 5, 6, 7, 14, 21, 28, 42, 56, 70, 84 and 98. The samples were taken before each animal treatment. Blood samples were collected in EDTA Vacutainer, centrifuged and the plasma was used for the analysis. Hair and blood samples were stored at −20 °C.
Methods
Analysis of steroid esters in hair
Hair steroid esters
The samples were treated as described in details by Nielen et al. [23] with some minor changes. The hair samples were analysed without using a washing step. Normally, the washing step with water is to wash away mud, etc. The samples were very clean so the washing step was omitted. In short, the procedure is as follows: the hair samples were cut into 0.5 cm pieces using a pair of scissors. Then, 500 mg was pulverised using a Mikro-dismembrator S ball mill. Two hundred milligrammes of the pulverised hair was weighed into a plastic tube and deuterium-labelled internal standards were added (10 ng/g hair). Digestion of the hair was performed by addition of 2 ml of 25 mM TCEP and incubation at room temperature for 1 h. The tube was shaken by using a ‘head-over-head’ shaker. After addition of 4 ml of methanol, the tube was centrifuged for 5 min at 1,700×g. Next, 4 ml of water was added and the mixture was applied to an activated C18 solid-phase extraction (SPE) column. The SPE column was conditioned by the addition of, respectively, acetonitrile, methanol and water. The column was washed with 2 ml of methanol/water (60/40, v/v) and eluted with 2 ml acetonitrile followed by 2 ml of ethyl acetate.
The SPE eluate was evaporated to dryness under a gentle steam of nitrogen gas at 40 °C and redissolved in 200 µl of LC solvent A, water–acetonitrile–methanol–formic acid (300:350:350:20, v/v/v/v). Finally, 40 µl was analysed by UPLC-MS/MS. For each steroid ester, two transitions (see Table 1) were monitored and for each deuterium-labelled analogue one transition was measured. The response factor was defined as the ratio between the sum of peak areas of the steroid ester transitions and the peak area of the transitions of the deuterium-labelled analogue.
For quantification, response factors versus concentration plots were constructed. To this end, seven blank hair samples were fortified with different concentrations of the steroid esters. The concentration of TC, TD ranged from 10 to 1,000 µg/kg and the concentration of EB from 2.5 to 250 µg/kg. The concentrations of the deuterium-labelled analogues were 50, 100 and 100 µg/kg for each sample of EB, TC and TD, respectively. The hair samples were analysed together with the calibration samples (Matrix Match Standards; MMS); concentrations were calculated using the linear regression method.
Analysis of steroid esters in plasma
The analysis of steroid esters in plasma was set up for this study and was based on the procedure described by Shackleton et al. [29]. To 1 ml of plasma, 5 ng of each internal standards and 4 ml of acetone/ethanol (1/1; v/v) were added. After intensive shaking and after centrifugation, the supernatant was transferred to a clean tube and the solvent was evaporated at 40 °C under a gentle stream of nitrogen. The residue was redissolved in 4 ml of methanol and 6 ml of water. The complete extract of 10 ml was applied to a preconditioned SPE column. The SPE procedure and the LC-MS/MS procedure were as described for the analysis of steroid esters in hair section. Because of the expected low concentrations of steroid esters in plasma the concentration range used for the calibration curve was 0–10 µg/l.
Analysis of the free steroids 17α-, 17β-estradiol and 17α-, 17β-testosterone in plasma
The samples were treated as described by van Tricht et al. [30]. In short, the procedure is as follows: to 1 ml of plasma, 0.5 ng of each internal standard and 1 ml methanol were added. The proteins were denaturated and after addition of 1 ml of water, the mixture was applied to a C18 SPE column. The SPE was preconditioned with 3 ml of methanol and 3 ml of water. After a washing step with water and acetonitrile/water (35/65; v/v) the analytes of interest were eluted with 3 ml of acetone. The eluate was collected and evaporated at 50 °C under a gentle stream of nitrogen and redissolved in 100 µl of methanol and 2 ml of Tris-buffer pH 9.5. Liquid–liquid extraction (LLE) was performed with 7 ml of n-pentane. This extraction step was repeated and the organic layers were collected and evaporated (see above). The residue was redissolved in 0.5 ml of ethanol and transferred into a derivatisation vial and the ethanol was evaporated. The dry residue was derivatised by adding 25 µl of MSFTFA++ followed by incubation of 1 hour at 60 °C. The derivatised mixture was evaporated and the residue was reconstituted in 25 µl of iso-octane; 4 µl was injected into the GC-MS/MS (pulse pressure 30 psi). The ion ratio was defined as the ratio between the area of the MS-MS transition 1 (see Table 2) of the steroid and the deuterium-labelled analogue. For 17α-estradiol and 17α-testosterone, the 17β- deuterium-labelled analogues were used. For quantification, ion ratios versus concentration plots were constructed. For quality control, five blank plasma samples were fortified with different concentrations of the steroid. The concentration of steroids ranged from 0 to 0.4 µg/l. The concentrations of the deuterium-labelled analogues were 0.2 µg/l for each sample. The plasma samples and quality control samples were analysed together with the calibration standards; concentrations were calculated using the linear regression method.
Results and discussion
There is not much information available regarding the pharmacokinetics of steroid esters administered to an animal by ‘pour-on’ application [26]. Therefore, it is of interest to know if the steroid esters finally reach the bloodstream. To collect information about the distribution of the steroid esters it was decided to analyse a selection of the plasma samples for containing steroid esters (EB, TC and TC). From literature, it is known [29] that after injection of steroid esters, the esters are hydrolysed and the free steroids are detected in the blood. To find out if the free steroid (17α-, 17β-estradiol and 17α-, 17β-testosterone) concentration in plasma also increases after ‘pour-on’ application, the free steroid concentration was measured in a sub selection of the plasma samples. The results of the analysis of hair samples and plasma samples are described below.
Determination of steroid esters in hair samples by LC-MS/MS
LC-MS/MS method performance
The analytical method for the determination of steroid esters in hair is described by Nielen [23]. The method was in-house-validated according to EU legislation 2002/657/EC [31] for 13 steroid esters—including EB, TC and TD. The validation was performed according to the guidelines for a confirmatory method. The CCα and CCβ were determined by the analysis of 20 different samples of hair with and without addition of steroid esters. The CCα of EB, TC and TD were respectively 2, 6 and 6 µg/kg. The CCβ of EB, TC and TD were respectively 5, 20 and 20 µg/kg. Recent publications [24, 32] demonstrate that the method is suitable for the analysis of steroid esters in bovine hair. To use the method as a quantitative method, some additional validation was performed. The linearity of the calibration curve was checked within the range of 2.5–250 µg/kg for EB and of 10–1,000 µg/kg for TC and TD. The coefficient of correlation (R 2) was better than 0.98 for all tested esters. The within-lab reproducibility was determined at the CCβ concentration level. In different sample series (analysed on different days), a (blank) sample fortified at CCβ level was analysed. The %RSD was 20, 5 and 20% (n = 9) for EB, TC and TD, respectively.
For this study—determination of the kinetics of the elimination—the obtained results from method validation are adequate. The CCβ-s are at or below 20 µg/kg, linearity is better than 0.98. Furthermore, deuterated internal standards are available for each steroid-ester to correct for recovery losses and the influence of the matrix resulting in within-lab reproducibility results of %RSD <25%.
Steroid esters in hair
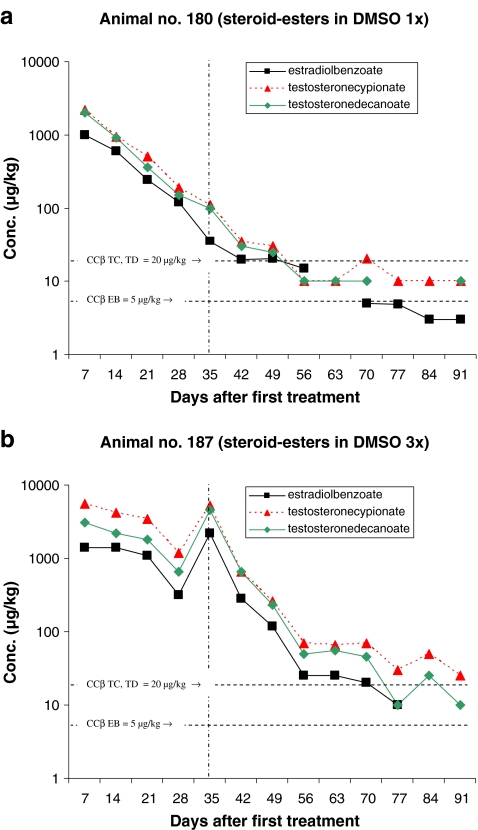
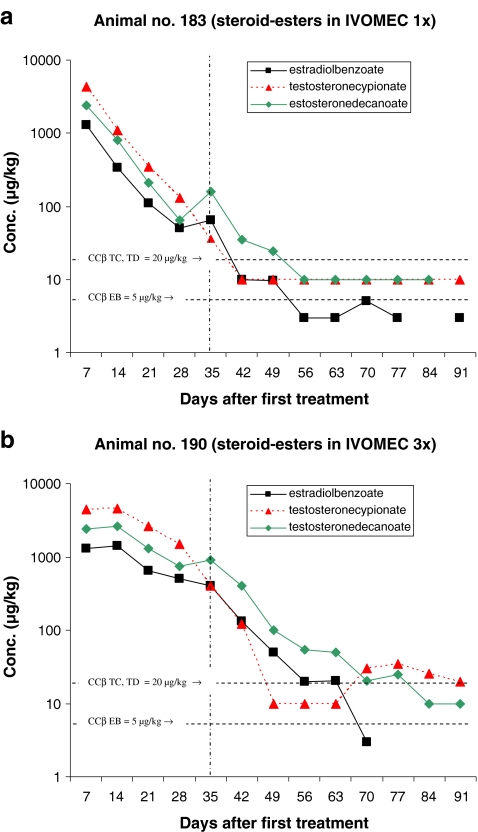
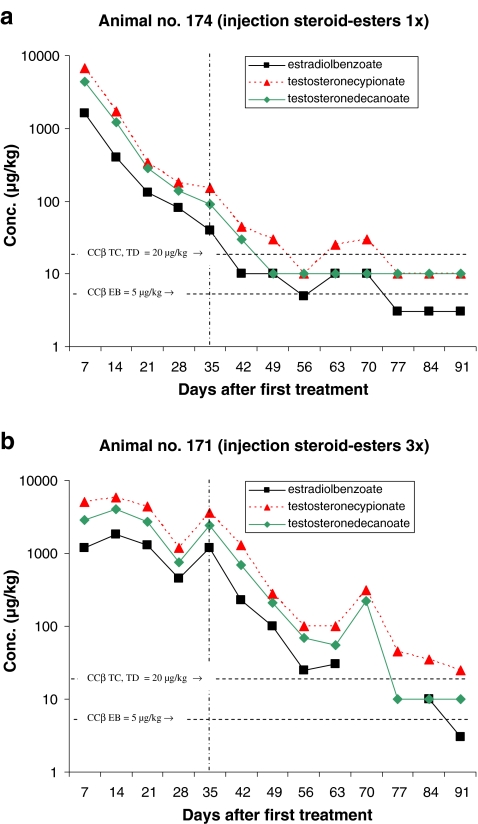
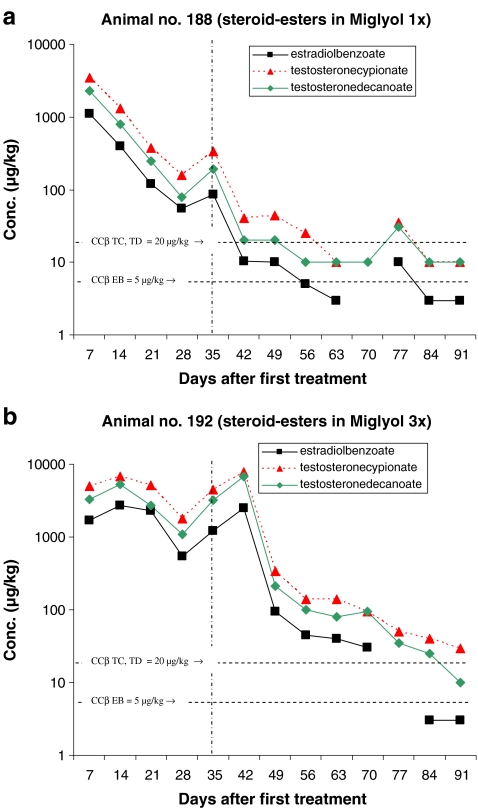
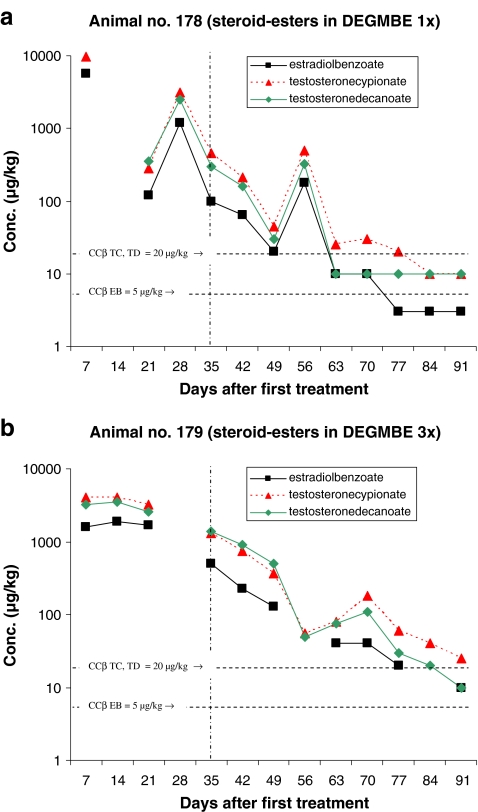
Figures 2–6 present the concentration of the steroid esters measured in the samples of hair. The vertical lines at day 35 (after 5 weeks) divided the plot into samples of hair grown for 8–12 weeks and samples grown for only 5 weeks (see also Fig. 1 and Table 4). The horizontal lines in the figures represent the CCβ-s of the steroid esters measured. Figure 2a represents the results of the animal injected once with the hormone cocktail and Fig. 2b represents the results of the repeated i.m. injection treatment. The treatment took place on days 1, 7 and 14. Note that the concentration scale is a logarithmic scale.
Fig. 4.
Concentration of the steroid esters found in hair samples after pour-on treatment
Fig. 5.
Concentration of the steroid esters found in hair samples after pour-on treatment
Fig. 2.
Concentration of the steroid esters found in hair samples after intramuscular injection
Fig. 6.
Concentration of the steroid esters found in hair samples after pour-on treatment
The results obtained after pour-on treatment are presented in the Figs. 3–6. The treatments presented in Figs. 3–6 differ only in the carrier solvent used DEGMBE, DMSO, IVOMEC or Miglyol. Figures 3a–6a present the single-treatment results and the Figs. 3b,–6b the repeated pour-on treatment results.
Fig. 3.
Concentration of the steroid esters found in hair samples after pour-on treatment
For monitoring the illegal use of steroid esters the CCβ concentration is most relevant because at and above that concentration, identification according to the EU criteria is possible in at least 95% of all non-compliant cases. For this study, it is important to establish how long after treatment the CCβ concentration level is reached; in other words, how long after treatment the hair sample is ‘non-compliant’. All results are based on single-hair analysis. When no recovery of the internal standard was measured and/or when too many interfering peaks were measured, the quantification was not possible for the specific analyte/sample combination. These data are the missing points in the figures. The missing points at the higher concentration levels are mostly due to low recovery of the internal standards. The used method fits the purpose; however, due to the different sample pre-treatment steps necessary (pulverising, digestion, SPE), the absolute recovery is sometimes low. When the internal standard is not detected, the quantification is not possible. The missing points at or below the CCβ levels are, for most samples, due to observed interfering peaks most probably due to residues of some fatty compounds like sebum.
From the results presented in Figs. 2–6 some general conclusions can be drawn.
The maximum concentrations measured for all applications (pour-on and injection) are for TC with a maximum of 9,600 µg/kg by pour-on application in DMSO. In general, the TC concentrations are slightly higher than the TD concentration. Due to the concentrations applied EB shows the lowest concentrations in hair.
Table 5 presents how many days after treatment the CCβ concentration (lowest concentration resulting in ‘non-compliant’ results) levels are reached. In general, for single treatment, the CCβ levels are reached after 35–49 days with the only exception of the pour-on application in DEGMBE for which the CCβ levels are reached after >56 days (8 weeks) after treatment. For the pour-on application in Miglyol, some relevant data points are missing but by extrapolating the elimination plot for TC it is expected that the CCβ is reached between 56 and 63 days after treatment.
Table 5.
Number of days after treatment the CCβ concentration levels are reached
| Injection | Pour-on application | ||||
|---|---|---|---|---|---|
| DEGMBE | DMSO | IVOMEC | Miglyol | ||
| Single treatment | |||||
| Estradiol benzoate | 35–42 | 56–63 | 42–49 | 35–42 | 35–42 |
| Testosterone cypionate | 49–56 | 70–77 | 49–56 | 35–42 | >56 |
| Testosterone decanoate | 42–49 | 56–63 | 49–56 | 49–53 | >49 |
| Repeated treatment | |||||
| Estradiol benzoate | 63–70 | 77–84 | 70–77 | 63–70 | 77–84 |
| Testosterone cypionate | >91 | >91 | >91 | 42–49a | >91 |
| Testosterone decanoate | 70–77 | 84–91 | 70–77 | 77–84 | 84–91 |
aUnreliable results; concentration increases significantly after 63 days
For repeated treatment, the following conclusions can be drawn: it is obvious that the highest concentration levels of steroid esters are reached after the first treatment and that there is hardly any concentration differences between injection and pour-on application. The maximum elimination rate of steroid esters into the hair is probably reached already after the first treatment and so, additional treatments do not result in higher concentrations levels in the hair samples. The number of treatments do not have effect on the maximum concentration level in hair but on the number of days the concentrations are at a high level (>1,000 µg/kg). Consequently, after repeated treatment, it takes more time before the CCβ levels are reached. By repeated treatment, the high level is (in comparison with the single treatment) continued for 21–28 days then the concentrations started to decrease. For TC, the CCβ level is reached for all application after >91 days. The only exception is the pour-on application in IVOMEC for which TC reached the CCβ level after 43 days but these results are not very reliable because—rather unexpected—the TC concentration started to increase after 63 days. For the steroid esters EB and TD, the CCβ levels are reached at 63–77 days (9–11 weeks) after injection or pour-on treatment with the carrier solvent DMSO or IVOMEC. For the pour-on application in DEGMBE and Miglyol, slightly longer elimination times for EB and TD viz. 77–84 days (11–12 weeks) are observed.
It is difficult to draw conclusions about the comparison of injection and pour-on application. Only two animals were injected with the hormone cocktail. This experiment—in which one animal was injected once and one animal was injected three times—shows that the steroid ester concentrations in the hair samples collected after injection were roughly at the same level as after pour-on treatment. It seems that the application procedure does not affect the steroid ester elimination rate into the hair.
Note that the samples of hair collected before treatment (t = 0 samples) did not contain any of the steroid esters at detectable concentrations. Based on the results obtained, it was decided not to analyse all the hair samples collected from the animals treated with only carrier solvent or untreated (reference group) animals. From these treatments, only the samples taken at week 0, 5, 10, and 14 were analysed. The samples did not contain any of the steroid esters at a detectable concentration.
Importantly, the sample of hair collected during the contamination (carry-over) experiment did not contain any of the steroid esters at a detectable concentration.
Determination of steroid esters in plasma by LC-MS/MS
A method was set up to monitor steroid esters in plasma. From literature, it is known that after application of 135 mg testosterone esters to a human body, the blood concentrations after 96 h is about 1 µg/l [29]. For that reason, the method was set up in the concentration range of 0–10 µg/l. The method was validated for qualitative analyses only but to each sample, the internal standards were added and the recovery of the internal standards (criteria S/N of internal standard has to be >3) was used as a sensitivity and recovery check. The lowest calibration point was at 1 µg/l and therefore the LOD was set for all steroid esters at this specific concentration level. All samples of plasma collected from the animals treated once and three times (injection and pour-on) with the hormone cocktail were analysed for containing steroid esters. In none of the samples detectable concentrations (> LOD) of steroid esters were monitored
As mentioned above, the method was partially validated and for that reason a selection of the plasma samples was send to the EU Community Reference Laboratory for hormones the RIVM (Bilthoven, the Netherlands) and were analysed under ISO/NEN 17025 accredited conditions for containing steroid esters. The sub selection consists of the following samples: plasma collected from Days 0 to 42 of the animal injected (3×), Days 0 to 14 of the animal injected 1× and the first five samples collected after pour-on application (1× and 3×) by using DEGMBE as the carrier solvent. Again, no steroid esters were detected. The LOD levels for EB, TC and TD for the LC-MS/MS method used were 0.2, 0.3 and 1 µg/l, respectively. That no steroid esters were detected in the plasma samples was not completely unexpected. Shackleton [29] already described that after application of 135 mg of testosterone esters to a human body the blood concentrations after 96 h is about 1 µg/l. In other words, rapid hydrolysis of steroid esters takes place as soon as the steroid esters reach the bloodstream.
Determination of free steroids in plasma by GC-MS/MS
GC-MS/MS method performance
The analytical method for the determination of free steroids in plasma and the validation of the method are described by van Tricht et al. [30]. The method was validated according to EU legislation 2002/657/EC [31] for 20 natural hormones—including 17α-, 17β-estradiol and 17α-, 17β-testosterone. For this study, the linearity of the calibration curve was checked for the 0–400 ng/l range. The coefficient of correlation (R 2) was better than 0.98. A summary of the method validation results is presented in Table 6. The measurement uncertainties based on within-laboratory-reproducibility (n = 21) are for 17α- and 17β-estradiol 25 and 20%, respectively, and for 17α- and 17β-testosterone 40 and 46%, respectively.
Table 6.
Validation paramaters for the GC-MS/MS analysis of steroids in plasma; adapted from [30]
| Compound | CCα (in ng/l) | CCβ (in ng/l) |
|---|---|---|
| 17α-estradiol | 9 | 16 |
| 17β-estradiol | 7 | 12 |
| 17α-testosterone | 20 | 40 |
| 17β-testosterone | 30 | 50 |
For this study—determination of the kinetics of the elimination—the obtained results for method validation are adequate. The CCβ levels are at or below 16 ng/l for estradiol and 50 ng/l for testosterone, linearity is better than 0.98. The detection limits of this method are low enough to measure the concentration of natural hormones (endogenous hormones) in plasma. Furthermore, deuterated internal standards are available for each steroid to correct for recovery losses and the influence of the matrix. Although the observed uncertainties in the measurements of the free testosterone are relatively high, the method was useful for the determination of the elimination kinetic. The testosterone measurement showed high variability during this study, probably due to natural variation of testosterone concentrations.
Free steroids in plasma GC-MS/MS results
A selection of the plasma samples were analysed for 17α-, 17β-estradiol and 17α-, 17β-testosterone. The samples analysed were the samples collected from the animal injected with the hormone cocktail (1× and 3×). Injection is a traditional way of treating the animal with steroid esters. It is of interest to analyse the plasma samples collected after injection of the hormone cocktail and to compare the results with the results of the pour-on application. Since, only minor differences were observed in the steroid ester concentration of hair samples by using different carrier solvents for pour-on application, it was decided to analyse only one set of the plasma samples after pour-on application. For the analysis, the samples collected after pour-on application of the hormone cocktail with the carrier solvent DEGMBE (1× and 3×) were selected. These samples were selected because the corresponding hair samples contained the relatively high levels of steroid esters. Possibly, these high levels would correspond with high plasma levels resulting in detectable concentrations (above CCβ).
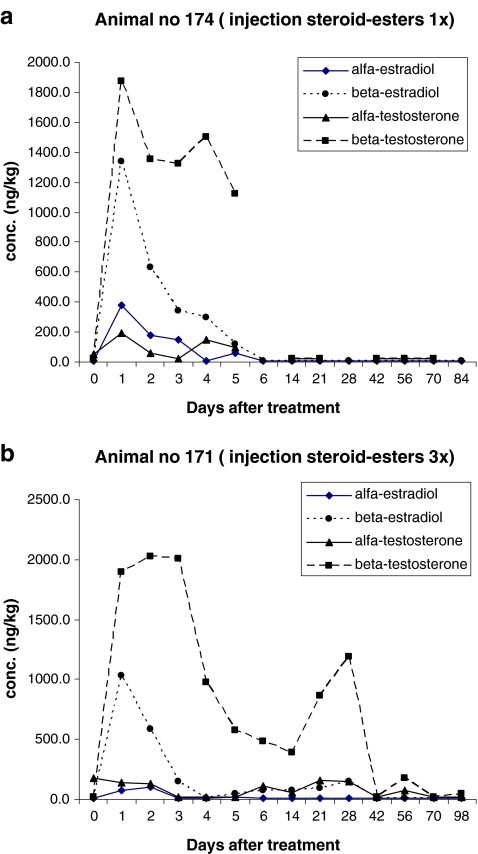
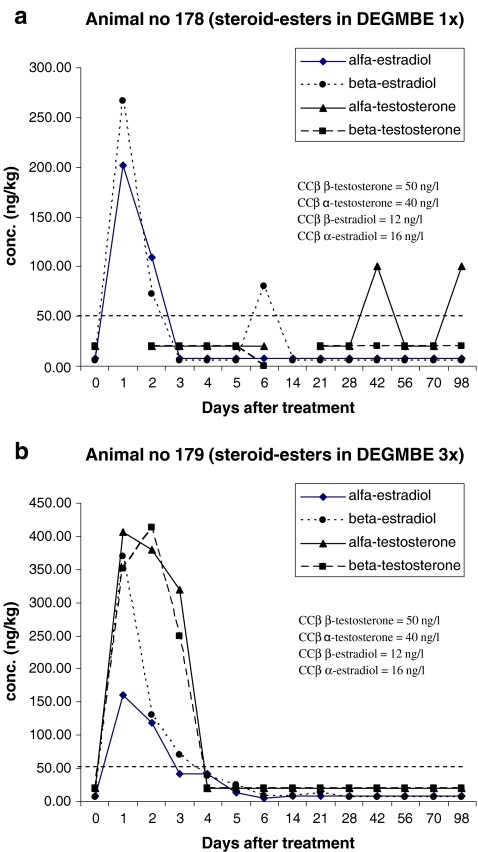
Figures 7 and 8 present the results obtained for the analysis of 17α-, 17β-estradiol and 17α-, 17β-testosterone in plasma samples. In Fig. 7, the results for ‘injection’ and in Fig. 8 the results for ‘pour-on’ are presented. Figures 7a and 8a are results obtained after single treatment; Figs. 7b and 8b are results obtained after repeated treatment. Note the non-linear time axis. The first plasma samples were collected just before the first treatment (Day 0) followed by 1, 2, 3, 4, 5 and 6 days after treatment. The next samples were collected at day 14, 21, 28 (2, 3 and 4 weeks after the first treatment) and at day 42, 56, 70, and 98 days (6, 8, 10 and 14 weeks after treatment). Samples taken at day 14 and day 21 were collected before the second and third treatments took place. When no recovery of the internal standard was measured and/or when too many interfering peaks were measured, the quantification was not possible for the specific analyte/sample combination. These data are the missing points in the figures. Especially around the CCβ levels, data points are missing due to some interfering peaks in these specific samples. Additional research is necessary to improve the robustness of the method.
Fig. 7.
Concentration of free steroids found in plasma after intramuscular injection
Fig. 8.
Concentration of free steroids found in plasma samples after pour-on treatment
Although it is difficult to draw conclusions based on one data set for injection and one data set for pour-on, some observations are worthwhile to mention. It is obvious that the concentration of the free steroids in plasma after injection is significantly higher than the concentrations of free steroids after pour-on application. It is of interest to see that after injection (Fig. 7b), the highest levels of free steroids are measured between 1 and 3 days after the first treatment and that the maximum concentrations reached for the 17β-forms are between 1,000 and 2,000 ng/l and for the 17α-forms are much lower, viz. 100 ng/kg. For the pour-on application (Fig. 8b), the highest levels of free steroids are also measured between 1 and 3 days after the first treatment, however, for this application, the maximum concentrations reached are much lower (maximum of 410 ng/l for 17β-testosterone). A second remarkable difference between injection and pour-on results is that for the pour-on application, there is no significant difference in maximum concentrations for the four steroids determined. In other words, the maxima reached for 17α-, 17β-estradiol and 17α-, 17β-testosterone are within the small range of 200–400 ng/l—in contrast, for injection, 17β-concentrations are approximately ten times higher than 17α-concentrations.
Regarding the steroid elimination time, it is clear that 5 days after repeated injection (Fig. 7b), the steroid concentrations are still above CCβ levels. Due to the second injection at Day 7 and the third injection at Day 14, the concentrations of the free steroids are higher than the ‘t = 0 concentration’ even after Day 6. It has to be mentioned that the elimination time is defined as the time it takes to reach the concentration of less than or equal to CCβ or to reach the ‘t = 0 concentration’ in case of a natural occurring background for example for 17α-estradiol and/or 17α-testosterone.
Regarding the steroid elimination time after the pour-on application, it is concluded that the CCβ or ‘t = 0 concentrations’ are reached within 5 days after the first application. No increase of steroid concentration is monitored after the second and third applications. The 17α-testosterone concentrations measured at day 42 and day 98 in Fig. 8a are probably outliers due to some interfering compounds. The results are not confirmed in Fig. 8b. It is possible that there is an increase of free steroid concentrations after the second and third applications (Fig. 8b) but due to the sample collection scheme, the possible increases were not monitored. The increase of free steroid concentration is expected in the samples collected 1–3 days after application; in this study, in the samples of Day 8, 9 and 10 and Day 15, 16 and 17, but, unfortunately, no samples were collected at these specific times.
From pharmokinetic experiments, it is known that the steroid esters when entering the bloodstream are hydrolysed to the free steroids viz. 17β-testosterone and 17β-estradiol. Furthermore, before elimination, free steroids are epimerized to α-testosterone and α-estradiol. C17 epimerization is a major pathway for steroids. This is also confirmed by the elimination kinetic described by Pinel [33]. In [33], it is demonstrated that the main metabolites detected in urine after i.m. injection of 17β-estradiol benzoate and 17β-nortestosterone laureate are 17α-estradiol and 17α-nortestosterone.
From the results obtained for the concentration of the free steroids in the present study, it is concluded that after i.m. injection, high concentrations of β-steroid esters enter the blood and are quickly hydrolysed to their free form—17β-testosterone and17β-estradiol—and after epimerization to the free 17α-steroids. However, after pour-on application, the concentrations of free β-steroids are much lower probably due to the fact that not all steroid esters enter the blood. It is possible that after pour-on application, the transport of the steroid esters to the hair is by another route than by blood transport, e.g. other extravascular or interstitial fluids [26]. So after pour-on application, the steroid esters are already hydrolysed, epimerized and eliminated before entering the blood resulting in much lower concentrations of the free β-steroids. After i.m. injection, the steroid esters enters the blood very quickly are hydrolyzed to the free β-steroids which are detected in the first 5 days after injection.
Conclusions
From the animal trial performed by i.m injection and pour-on application of steroid esters using different carrier solvents, it is concluded that: no significant differences are observed between the elimination rate of steroid esters in hair after i.m. injection and pour-on application of steroid esters. For both ways of application, the concentrations of steroid esters reach the CCβ levels (5–20 µg/kg) 5–7 weeks after single treatment and 9–11 weeks after repeated (three times) treatment. The identity of the carrier solvent during pour-on application does not have significant influence on the final steroid ester concentration in hair.
Even though high concentrations of steroid esters are measured in hair, no detectable concentration of steroid esters (<1 µg/l) were measured in the plasma of the treated animal. This is probably due to the quick hydrolysis of steroid esters to free steroids.
The only difference in i.m. injection and pour-on application measured in this study is the concentration of free β-form steroids in plasma. The concentration of free β-form steroids measured in plasma are much higher (ten times reaching 2,000 ng/l) after injection than after pour-on treatment. The concentrations of the α-form steroids are not significantly different. From these results, it is supposed that after the pour-on treatment, the transport of steroid esters to the hair is not only by blood but also by other fluids. In this way, steroid esters are already hydrolysed, epimerized and eliminated before reaching the blood resulting in low concentration of the free steroids in plasma after pour-on application.
Acknowledgements
This project was financially supported by the Dutch Ministry of Agriculture, Nature and Food Quality (project 72392.01). We thank the pharmacy of the Faculty of Veterinary Medicine from Utrecht University for preparing the hormone cocktails for pour-on and injection.
Open Access
This article is distributed under the terms of the Creative Commons Attribution Noncommercial License which permits any noncommercial use, distribution, and reproduction in any medium, provided the original author(s) and source are credited.
References
- 1.Council Directive 96/22/EC, Offic J Eur Comm. 1996;L125:3–9. [Google Scholar]
- 2.Council Directive 96/23/EC, Offic J Eur Comm. 1996;L125:10–32. [Google Scholar]
- 3.Gaillard Y, Vayssette F, Balland A, Pepin G. J Chromatogr B: Biomed Appl. 1999;735(2):189–205. doi: 10.1016/S0378-4347(99)00416-8. [DOI] [PubMed] [Google Scholar]
- 4.Gaillard Y, Vayssette F, Pepin G. Forensic Sci Int. 2000;107:361–379. doi: 10.1016/S0379-0738(99)00179-6. [DOI] [PubMed] [Google Scholar]
- 5.Pragst F, Balikova MA. Clin Chim Acta. 2006;370:17–49. doi: 10.1016/j.cca.2006.02.019. [DOI] [PubMed] [Google Scholar]
- 6.Thieme D, Anielski P, Grosse J, Sachs H, Mueller RK. Anal Chim Acta. 2003;483:299–306. doi: 10.1016/S0003-2670(02)01604-5. [DOI] [Google Scholar]
- 7.Antignac JP, Le Bizec B, Monteau F, Poulain F, André F. J Chromatogr B: Biomed Appl. 2001;757:11–19. doi: 10.1016/S0378-4347(00)00626-5. [DOI] [PubMed] [Google Scholar]
- 8.Deng X-S, Kurosu A, Pounder DJ. J Forensic Sci. 1999;44:343–346. [PubMed] [Google Scholar]
- 9.Durant AA, Fente CA, Franco CM, Vazquez BI, Mayo S, Cepeda A. J Chromatogr B: Anal Technol Biomed Life Sci. 2002;766:251–256. doi: 10.1016/S0378-4347(01)00504-7. [DOI] [PubMed] [Google Scholar]
- 10.Gleixner A, Meyer HHD. Fresenius' J Anal Chem. 1997;357:1198–1201. doi: 10.1007/s002160050330. [DOI] [Google Scholar]
- 11.Hernández-Carrasquilla M. Anal Chim Acta. 2001;434:59–66. doi: 10.1016/S0003-2670(01)00805-4. [DOI] [Google Scholar]
- 12.Höld KM, Wilkins DG, Crouch DJ, Rollins DE, Maes RA. J Anal Toxicol. 1996;20:345–349. doi: 10.1093/jat/20.6.345. [DOI] [PubMed] [Google Scholar]
- 13.Kintz P, Cirimele V, Dumestre-Toulet V, Ludes B. J Pharm Biomed Anal. 2001;24:1125–1130. doi: 10.1016/S0731-7085(00)00570-7. [DOI] [PubMed] [Google Scholar]
- 14.Kintz P, Cirimele V, Dumestre-Toulet V, Villain M, Ludes B. J Chromatogr B: Anal Technol Biomed Life Sci. 2002;766:161–167. doi: 10.1016/S0378-4347(01)00425-X. [DOI] [PubMed] [Google Scholar]
- 15.Marcos V, Perogordo E, Espinosa P, de MM Pozuelo, Hooghuis H. Anal Chim Acta. 2004;507:219–227. doi: 10.1016/j.aca.2003.11.026. [DOI] [Google Scholar]
- 16.Nielen MWF, Hooijerink H, Essers ML, Lasaroms JJP, van EO Bennekom, Brouwer L. Anal Chim Acta. 2003;483:11–17. doi: 10.1016/S0003-2670(02)01376-4. [DOI] [Google Scholar]
- 17.Rambaud L, Bichon E, Cesbron N, André F, Le Bizec B. Anal Chim Acta. 2005;523:165–176. doi: 10.1016/j.aca.2004.10.083. [DOI] [Google Scholar]
- 18.Rambaud L, Monteau F, Deceuninck Y, Bichon E, André F, Le Bizec B. Anal Chim Acta. 2007;586:93–104. doi: 10.1016/j.aca.2006.11.048. [DOI] [PubMed] [Google Scholar]
- 19.Peng S-H, Segura J, Farré M, González JC, de la Torre X. Steroids. 2002;67:39–50. doi: 10.1016/S0039-128X(01)00128-3. [DOI] [PubMed] [Google Scholar]
- 20.van de Kerkhof DH, de Boer D, Thijssen JH, Maes RA. J Anal Toxicol. 2000;24:102–115. doi: 10.1093/jat/24.2.102. [DOI] [PubMed] [Google Scholar]
- 21.de la Torre X, González JC, Pichini S, Pascual JA, Segura J. J Pharm Biomed Anal. 2001;24:645–650. doi: 10.1016/S0731-7085(00)00452-0. [DOI] [PubMed] [Google Scholar]
- 22.Hooijerink H, Lommen A, Mulder PPJ, van Rhijn JA, Nielen MWF. Anal Chim Acta. 2006;529:167–172. doi: 10.1016/j.aca.2004.07.049. [DOI] [Google Scholar]
- 23.Nielen MWF, Lasaroms JJP, Mulder PPJ, Van Hende J, van Rhijn JH, Groot MJ. J Chromatogr B: Anal Technol Biomed Life Sci. 2006;830:126–134. doi: 10.1016/j.jchromb.2005.10.028. [DOI] [PubMed] [Google Scholar]
- 24.Duffy E, Rambaud L, Le Bizec B, O'Keeffe M. Anal Chim Acta. 2009;637:165–172. doi: 10.1016/j.aca.2008.09.070. [DOI] [PubMed] [Google Scholar]
- 25.Anielski P. J Mass Spectrom. 2008;43:1001–1008. doi: 10.1002/jms.1446. [DOI] [PubMed] [Google Scholar]
- 26.Gratacos-Cubarsi M, Castellari M, Valero A, Garcia-Regueiro JA. J Chromatogr B: Anal Technol Biomed Life Sci. 2006;834:14–25. doi: 10.1016/j.jchromb.2006.03.007. [DOI] [PubMed] [Google Scholar]
- 27.Musshoff F, Madea B. Anal Bioanal Chem. 2007;388:1475–1494. doi: 10.1007/s00216-007-1288-x. [DOI] [PubMed] [Google Scholar]
- 28.Anielski P, Thieme D, Schlupp A, Grosse J, Ellendorff F, Mueller RK. Anal Bioanal Chem. 2005;383:903–908. doi: 10.1007/s00216-005-0104-8. [DOI] [PubMed] [Google Scholar]
- 29.Shackleton CH, Chuang H, Kim J, de la Torre X, Segura J. Steroids. 1997;62:523–529. doi: 10.1016/S0039-128X(97)00004-4. [DOI] [PubMed] [Google Scholar]
- 30.Tricht van EF, Blokland MH, Sterk SS, Ginkel van LA, Euroresidue VI (2008) Conference on Residues of Veterinary Drugs in Food, Egmond aan Zee, Proceedings Ginkel van LA, Bergwerff AA (Eds.) pp. 611-616
- 31.Official Journal of the European Communities L221, 8-36. Commission Decision (2002/657/EC) of 12 August 2002, Brussels, Belgium, 2002
- 32.Aqai P, Stolker AAM, Lasaroms JJP (2009) J Chromatogr A In press doi:10.1016/J.Chroma.2009.04.029 [DOI] [PubMed]
- 33.Pinel G, Rambaud L, Cacciatore G, Bergwerff A, Elliott C, Nielen M, Le Bizec B. J Steroid Biochem Mol Biol. 2008;110(1-2):30–38. doi: 10.1016/j.jsbmb.2007.09.024. [DOI] [PubMed] [Google Scholar]


