

Abstract
Although no animal model exactly duplicates clinically defined alcoholism, models for specific factors, such as the withdrawal syndrome, are useful for identifying potential neural determinants of liability in humans. The well-documented difference in withdrawal severity following chronic ethanol exposure, between the DBA/2J and C57BL/6J mouse strains, provides an excellent starting point for dissecting the neural circuitry affecting predisposition to physical dependence on ethanol. To induce physical dependence, we used a paradigm in which mice were continuously exposed to ethanol vapor for 72 hr. Ethanol-exposed and air-exposed (control) mice received daily injections of pyrazole hydrochloride, an alcohol dehydrogenase inhibitor, to stabilize blood ethanol levels. Ethanol-dependent and air-exposed mice were killed seven hours after removal from the inhalation chambers. This time point corresponds to the time of peak ethanol withdrawal severity. The brains were processed to assess neural activation associated with ethanol withdrawal indexed by c-Fos immunostaining. Ethanol-withdrawn DBA/2J mice showed significantly (p<0.05) greater neural activation than ethanol-withdrawn C57BL/6J mice in the dentate gyrus, hippocampus CA3, lateral septum, basolateral and central nuclei of the amygdala, and prelimbic cortex. Taken together with results using an acute model, our data suggest that progression from acute ethanol withdrawal to the more severe withdrawal associated with physical dependence following chronic ethanol exposure involves recruitment of neurons in the hippocampal formation, amygdala and prelimbic cortex. To our knowledge, these are the first studies to use c-Fos to identify the brain regions and neurocircuitry that distinguish between chronic and acute ethanol withdrawal severity using informative animal models.
Keywords: Ethanol, c-Fos, Hippocampus, Amygdala, Limbic, Withdrawal
Introduction
Withdrawal hyperexcitability of the central nervous system (CNS) is a well-known consequence of physical dependence on ethanol, and is one of the most alarming manifestations of the withdrawal syndrome in alcoholics. During extended ethanol exposure, compensatory (homeostatic) changes occur in the CNS leading to the development of functional tolerance in the presence of ethanol, as well as to cross-tolerance to other depressant drugs. When the ethanol is withdrawn (i.e., its use is discontinued), these previously compensatory neuroadaptive processes exhibit overcompensation (or rebound), leading to the CNS hyperexcitability signs that are characteristic of the withdrawal syndrome (Littleton, 1998). Symptoms of ethanol withdrawal in animals are similar to those seen in humans, and include tremor, other motoric dysfunctions, autonomic overactivity and, in the most severe cases, seizures (De Witte et al., 2003).
The brain region(s) and circuit(s) involved in naturally-occurring, genetically-determined differences in neural activation associated with ethanol withdrawal are not known. Immediate early gene product expression has proven useful to assess the pattern of neural activation in ethanol withdrawn rodents following chronic ethanol exposure (Le et al., 1992; Morgan et al., 1992; Moy et al., 2000; Olive et al., 2001; Wilce et al., 1994). However, only one of these studies assessed genetically determined differences in neural activation and compared protein kinase C-ε (PKCε) knockout and wild-type PKCε+/+ mice (Olive et al., 2001). This comparison identified seven brain regions potentially involved in genetically determined differences in chronic ethanol withdrawal severity (i.e., the lateral septum, substantia nigra, dentate gyrus, paraventricular nuclei of the hypothalamus and thalamus, and mediodorsal nucleus of the thalamus), but it is not known to what degree these results are specific to the comparison of PKCε−/− and wild-type mice and to what extent the results may generalize to more widely used animal models. The DBA/2J (D2) and C57BL/6J (B6) mouse strains are the most widely studied animal models of severe and mild ethanol withdrawal, respectively, but have not previously been compared for neural activation following withdrawal from chronic ethanol. Importantly, mapping populations derived from the D2 and B6 progenitor strains have been used successfully to begin to dissect the genetic determinants of physical dependence and associated withdrawal episodes following chronic ethanol exposure (Buck et al., 2002; Crabbe, 1998). Identification of the neural determinants that differentiate withdrawal between these two informative strains therefore offers the distinct advantage of identifying specific brain region(s) and circuitry by which these genes exert their effects on ethanol dependence and associated withdrawal.
Another important goal of our research is to identify the brain region(s) and circuitry involved in the progression from mild withdrawal associated with acute ethanol exposure to more severe withdrawal exhibited by physically dependent animals following chronic ethanol exposure. The most commonly used animal models of ethanol withdrawal include chronic models where withdrawal is apparent following exposure to ethanol vapor for 72 hr (Buck et al., 2002; Terdal and Crabbe, 1994) or a liquid diet containing ethanol for several days (Levental and Tabakoff, 1980); and an acute model where withdrawal can be demonstrated after a single hypnotic dose of ethanol (Buck et al., 1997). The studies reported here use the chronic ethanol vapor model and are compared to our results using an acute model (Kozell et al., 2005). We hypothesized that distinct brain regions within the basal ganglia and/or associated cortical and limbic circuitry would exhibit genotype-dependent neuronal activation associated with chronic ethanol withdrawal severity between the D2 and B6 mouse strains.
METHODS
Animals
Male B6 and D2 mice were purchased from the Jackson Laboratories (Bar Harbor, ME). Upon arrival at the AALAC accredited Portland VA Medical Center, mice were housed in groups of four per cage with corn cob bedding and allowed to acclimate for at least one week before being transferred to ethanol vapor inhalation chambers or identical control (air) chambers. The mice were 70–100 days old at the time of testing. Food (Purina LabDiet, Purina Mills International, St. Louis MO) and water were freely available at all times. Colony and procedure rooms were maintained at an ambient temperature of 21±1°C. All procedures were approved by the institutional IACUC committee and followed guidelines for the care and use of laboratory animals from the National Institutes of Health and the Department of Veterans Affairs.
Induction of Ethanol Physical Dependence
All groups were treated in parallel and sacrificed on the same day. To induce physical dependence on ethanol, mice were continuously exposed to ethanol vapor for 72 hr. Ethanol-exposed mice received a loading dose of 1.5 g/kg ethanol at the beginning of the ethanol vapor exposure to raise blood ethanol concentrations (BECs) to the level to be maintained during exposure. Ethanol-exposed and air-exposed (control) mice received daily injections of pyrazole hydrochloride (68 mg/kg, ip), an alcohol dehydrogenase inhibitor, to stabilize blood ethanol levels and reduce variability among individuals and between strains, in BEC values. Blood samples were also taken at 24 and 48 hr to monitor BECs for adjusting vapor concentration, if necessary. After 72 hr, all the mice were removed from the vapor chambers (between 8:00–9:00 AM) and a 20 μl tail blood sample was collected from the ethanol dependent mice for determination of individual BEC values using gas chromatography (Terdal and Crabbe, 1994). Control mice also had their tails nicked, but no blood sample was collected. The mice remained undisturbed in their home cages for 7 hr, when they were killed by cervical dislocation. The brains were removed and placed in ice-cold 4% paraformaldehyde in 0.1M phosphate buffer (PB) overnight. The following day this was replaced with ice-cold 30% sucrose-PB. When the brains no longer floated, they were processed for immunohistochemical analysis. The 7 hr time point was used to assess immediate early gene expression during chronic ethanol withdrawal because withdrawal associated handling-induced convulsions (HICs) begin about 4–5 hr post-ethanol exposure and peak in severity approximately 6–7 hr after ethanol exposure is terminated in the animal models used in the present study (Buck et al., 2002), and because c-Fos protein induction typically occurs within 1 hr of such stimuli (Chang et al., 1995; Morgan et al., 1987; Young et al., 1991).
Immunohistochemical analysis of neural activation
The immunohistochemical procedure has been previously described (Kozell et al., 2005; Chen et al., 2008). Notably, the mice were not tested for ethanol withdrawal convulsions in order to avoid potential confounds of evoked convulsions on c-Fos immunoreactivity. The mice were killed by cervical dislocation and the brain was removed and placed in ice-cold 4% paraformaldehyde in 0.1 M phosphate buffer (PB) overnight. The following day the 4% paraformaldehyde solution was replaced with 0.1 M PB containing 30% sucrose until the brain no longer floated and was processed for immunohistochemical analysis. Brains were coronally sectioned (30 μm) on a freezing microtome and the tissue was stored in 10 mM PB containing 0.02% sodium azide until processing. All of the experimental groups were processed at the same time. The sections were first rinsed three times in 10 mM PB before being incubated in 1.5% hydrogen peroxide in 10 mM PB in 0.9% saline solution (PBS) for 15 min to block endogenous peroxidase activity, and then washed six times in 10 mM PBS. Sections were blocked for 2 hr in immunoreaction buffer (10 mM PBS containing 0.25% Triton-X 100 and 5% dry milk) without antibody; and rabbit anti-c-Fos antibody (1:10,000; Oncogene Science Inc., Cambridge, MA) was then added and the incubation was continued for 72 hr at 4°C. The specificity of this antibody for c-Fos has been confirmed (Chan and Sawchenko, 1995). The sections were rinsed three times in 10 mM PBS and incubated with biotinylated goat anti-rabbit IgG (1:200; Vector Laboratories, Burlingame, CA) in 10 mM PBS. The sections were subsequently incubated with horseradish peroxidase avidin-biotin complex in 10 mM PBS for 1.5 hr at room temperature (ABC Elite peroxidase kit, Vector Laboratories, Burlingame, CA). The sections were rinsed three times in 10 mM PBS and placed in 0.05 M Tris (pH 7.4) for 5 min. The chromatic reaction was completed with diaminobenzidine (50 mg/100 ml of 0.05 M Tris, Sigma, St. Louis, MO) in the presence of 0.01% nickel ammonium sulfate solution and 0.035% hydrogen peroxide. Omission of the primary antibody to the sections was used as a staining control. The sections were mounted onto slides, dehydrated, and cover-slipped in Permount (Fisher Scientific, Pittsburgh, PA).
Methods for analysis of quantitative morphometric analysis of c-Fos positive cells in the distinct brain regions have previously been described (Chen et al., 2008; Demarest et al., 1998; Hitzemann and Hitzemann, 1997). Briefly, an Olympus BX60 light microscope and LEICA DFC 480 imaging system were used to obtain a permanent record of cell distribution for c-Fos quantification. In our experience, results using mean densities across a brain region and representative sections are comparable (Chen et al., 2008), so representative sections were analyzed for each brain region as follows (from Paxinos and Franklin, 2001): the central, basolateral and medial nuclei of the amygdala (plate 43), substantia nigra (plate 57), entorhinal cortex and hippocampal regions (plate 49), cingulate and prelimbic cortices (plate 18), nucleus accumbens core, shell and the dorsal lateral caudate putamen (plate 21), lateral and medial septum (plate 26), bed nucleus of the stria terminalis (plate 30), primary auditory and sensory cortices (plate 52), granular and dysgranular insular cortex (plate 22), motor and piriform cortices (plate 21), lateral and medial parietal association (posterior parietal) cortex (plate 45), paraventricular nucleus of the hypothalamus (PVN; plate 42), anterior paraventricular thalamus (PVA, plate 35), and mediodorsal thalamus (plate 37). All images were taken at 10X and signals were quantified using Image Pro Plus (Media Cybernetics), except for the caudate nucleus and nucleus accumbens, which were quantified at 4X. Brain sections at 4X are used to illustrate differences between groups in hippocampal formation in Figure 2. Standardized brain region templates based on established anatomical markers were employed. Standardized threshold parameters (160, light intensity range from 0 to 255) were employed to identify and quantify individual c-Fos positive neurons. Sample size estimates were based on previous studies (Chen et al., 2008; Demarest et al., 1998; Hitzemann and Hitzemann, 1997; Kozell et al., 2005) and are sufficient to overcome potential artifacts associated with assessing representative sections (Hitzemann and Hitzemann, 1997). The experimenter was blind to the experimental condition for each subject.
Fig 2.
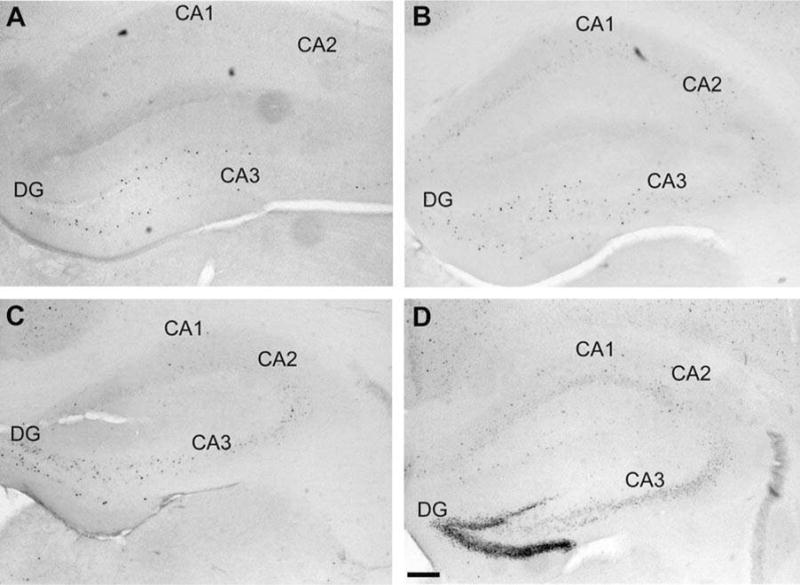
Photomicrographs of cFos-positive neurons in the hippocampal formation of (A) B6 control, (B) B6 ethanol withdrawn, (C) D2 control, and (D) D2 ethanol withdrawn mice. The dentate gyrus (DG) and CA3 field of the hippocampal formation showed increased neuronal activity associated with ethanol withdrawal in both strains, but to a lesser degree in B6 vs. D2 mice. Scale bar = 200 μm.
Data analysis
For comparisons of ethanol withdrawal associated c-Fos induction, the data were not normally distributed based upon a significant Kolmogorov-Smirnov test. Therefore, analysis of the data with a standard analysis of variance (ANOVA) is not appropriate. Instead, we fit our data using a gamma distribution, which best describes data where the standard deviation of a random variable increases linearly with the mean (McCabe et al., 1989), which was evident in our data. A regression model for gamma distributed data is a generalized linear model and the model is fitted by maximum likelihood. The Wald (W) statistic is used with this model to test whether a parameter is zero by comparison to the 95%-quantile of the t-distribution (Kang et al., 2004). These statistics were carried out using Statistica version 6 (StatSoft Inc, Tulsa, OK). The significance level was set at α = 0.05 (two-tailed).
RESULTS
Blood ethanol concentration (BEC) values were carefully matched among the ethanol treated D2 and B6 strain mice used in these studies (mean BEC ± SEM values were 1.64 ± 0.09 and 1.64 ± 0.12 mg of ethanol/ml of blood, respectively). The mice were not tested for ethanol withdrawal to avoid the potential confound of evoked convulsions on c-Fos immunostaining. Table 1 summarizes the number of c-Fos positive neurons in ethanol-withdrawn and control (saline) mice from the D2 and B6 inbred mouse strains across 34 brain regions emphasizing cortical, limbic, and basal ganglia circuitry. In all cases showing a strain × treatment interaction, except for lateral globus pallidus, post-hoc analysis confirmed that c-Fos induction was greater in ethanol withdrawn D2 vs. B6 mice (Table 1). All of these regions are part of the extended limbic system. Notably, neuronal activation associated with ethanol withdrawal was more intense in the hippocampal formation (dentate gyrus and CA3), amygdala and septum. Figure 1 illustrates the extended limbic circuit, highlighting the connectivity of the extended limbic structures, based upon anatomical and electrophysiological studies. Representative immunohistochemical results for selected brain regions are shown as follows: the hippocampal formation (Fig 2), central and basolateral amygdala (Fig 3), and septum (Fig 4).
Table 1.
Number of c-Fos positive neurons in chronic ethanol withdrawn and control D2 and B6 mice
Numbers of c-Fos-positive neurons in D2 and B6 strain mice. Mice were chronically exposed to ethanol vapor for 72 hr (n=7 and 10, respectively) or were air-pyrazole controls (n=3–8 per strain). Seven hours later, the brains were removed and processed for immunohistochemical analysis. Values represent the number of c-Fos immunoreactive neurons (mean ± SEM) in representative sections. Significant main effects of treatment (T) and strain (S), and strain × treatment interaction (SxT) are indicated. Abbreviations: BLA, basolateral amygdala; BMA, basomedial amygdala; BNST, bed nucleus of the stria terminalis; CEA, central nucleus of the amygdala; Cg1, cingulate cortex area 1; CPu, caudate putamen; DG, dentate gyrus; EW, Edinger-Westphal nucleus; LGP, lateral globus pallidus; LS, lateral septum; MD: dorsomedial thalamus; MGP, medial globus pallidus; MS, medial septum; NAcc, nucleus accumbens core; NAcs; nucleus accumbens shell; PrL, prelimbic cortex; PVN, paraventricular nucleus of the hypothalamus; PVA, anterior paraventricular thalamus; SNr, substantia nigra pars reticulata; STN, subthalamic nucleus; VP, ventral pallidum; VTA, ventral tegmental area.
| Region | Contro | D2 Ethanol | Control | B6 Ethanol | ANOVA |
|---|---|---|---|---|---|
| Hippocampus | |||||
| CA1 | 9 ± 5 | 26 ± 10 | 7 ± 3 | 11 ± 3 | |
| CA2 | 3 ± 2 | 10 ± 3 | 3 ± 1 | 3 ± 1 | S |
| CA3 | 7 ± 5 | 31 ± 11 | 5 ± 1 | 9 ± 1 | T, SxT |
| DG | 8 ± 3 | 75 ± 26 | 14 ± 2 | 14 ± 3 | S, T, SxT |
| Extended amygdala | |||||
| CEA, lateral | 8 ± 4 | 40 ± 16 | 13 ± 4 | 22 ± 4 | T |
| CEA, capsular | 9 ± 40 | 28 ± 10 | 8 ± 2 | 15 ± 4 | T |
| CEA, medial | 7 ± 3 | 29 ± 10 | 15 ± 5 | 13 ± 2 | SxT |
| BLA | 5 ± 2 | 35 ± 17 | 5 ± 2 | 6 ± 1 | S, T, SxT |
| BMA | 9 ± 3 | 26 ± 9 | 10 ± 4 | 21 ± 4 | T |
| BNST | 16 ± 5 | 35 ± 5 | 18 ± 8 | 23 ± 4 | T |
| Nacc | 2 ± 5 | 12 ± 3 | 7 ± 3 | 21 ± 7 | S, T |
| Nacs | 29 ±11 | 24 ± 5 | 27 ± 9 | 46 ± 10 | |
| Septum | |||||
| LS | 10 ± 3 | 39 ± 12 | 18 ± 13 | 14 ± 5 | T, SxT |
| MS | 7 ± 3 | 18 ± 5 | 5± 5 | 6 ± 2 | |
| Cortex | |||||
| Cg1 | 23 ± 19 | 44 ± 14 | 16 ± 12 | 21 ± 7 | |
| PrL | 9 ± 3 | 35 ± 18 | 8 ± 2 | 11 ± 3 | SxT |
| Entorhinal | 10 ± 3 | 39 ± 13 | 17 ± 5 | 27 ± 6 | T |
| Auditory | 47 ± 2 | 69 ± 23 | 28 ± 14 | 70 ± 17 | T |
| Insular | 30 ± 12 | 82 ± 33 | 45 ± 30 | 40 ± 11 | |
| Motor | 61 ± 41 | 83 ± 42 | 11 ± 6 | 80 ± 27 | |
| Piriform | 38 ± 15 | 79 ± 19 | 43 ± 28 | 62 ± 13 | |
| Parietal, posterior | 24 ± 10 | 100 ± 34 | 25 ± 14 | 97 ± 28 | T |
| Sensory | 78 ± 29 | 108 ± 39 | 30 ± 17 | 60 ± 18 | |
| Basal ganglia | |||||
| Cpu | 3 ± 1 | 24 ± 10 | 7 ± 4 | 51 ± 15 | T |
| SNr | 12 ± 5 | 37 ± 12 | 31 ± 8 | 18 ± 4 | |
| VP | 3 ± 1 | 6 ± 1 | 4 ± 1 | 6 ± 1 | T |
| MGP | 4 ± 1 | 3 ± 1 | 3 ± 1 | 8 ± 2 | T |
| LGP | 2 ± 1 | 3 ± 1 | 1 ± 1 | 5 ± 1 | |
| STN | 4 ± 1 | 8 ± 2 | 0 ± 0 | 6 ± 1 | T |
| Thalamus and hypothalamus | |||||
| PVA | 19 ± 7 | 22 ± 5 | 27 ± 5 | 24 ± 3 | |
| MD | 4 ± 2 | 11 ± 4 | 9± 7 | 8 ± 3 | |
| PVN | 3 ± 1 | 10 ± 6 | 1± 1 | 2 ± 1 | S, T |
| Mid-hind brain | |||||
| VTA | 5 ± 1 | 10 ± 3 | 7± 2 | 17 ± 2 | S, T |
| EW | 6 ± 1 | 8 ± 2 | 12 ± 2 | 16 ± 2 | T |
Fig 1.
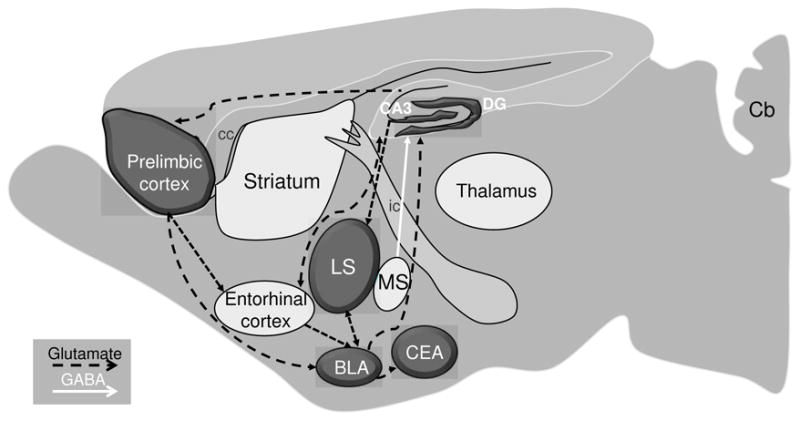
Schematic representation of genotype-dependent neural activation associated with withdrawal from chronic ethanol exposure. The shadowed regions show significant differences in c-Fos activation between the ethanol withdrawn D2 and B6 strain mice. The dashed black and solid white lines represent the glutamatergic and GABAergic projections within the extended limbic circuit. Abbreviations: BLA, basolateral amygdala; Cb, cerebellum; cc, corpus callosum; CeA, central nucleus of amygdala; DG, dentate gyrus; ic, internal capsule; LS, lateral septum; MS, medial septum.
Fig 3.

Photomicrographs of cFos-positive neurons in the extended amygdala of (A) B6 control, (B) B6 ethanol withdrawn, (C) D2 control, and (D) D2 ethanol withdrawn mice. The basolateral amygdala (BLA) showed increased neuronal activity associated with ethanol withdrawal in both strains, but to a lesser degree in B6 vs. D2 strain mice. The medial central nucleus of the amygdala (CEA) also showed less ethanol withdrawal associated activation in B6 vs. D2 strain mice. Additional abbreviations: opt, optic chiasm. Scale bar = 100 μm.
Fig 4.

Photomicrographs of cFos-positive neurons in the septum of (A) B6 control, (B) B6 ethanol withdrawn, (C) D2 control, and (D) D2 ethanol withdrawn mice. The lateral septum (LS) showed increased neuronal activity associated with ethanol withdrawal in both strains, but to a lesser degree in B6 vs. D2 mice. Additional abbreviations: MS, medial septum; LV, lateral ventricle. Scale bar = 100 μm.
Hippocampal formation
Significant main effects of strain, treatment (ethanol withdrawal) and/or strain × treatment interactions were identified in three of the four regions of the hippocampal formation assessed (Table 1). Among the 34 brain regions evaluated, the most dramatic genotype-dependent neural activation in ethanol withdrawn mice was observed in the dentate gyrus where significant effects of strain (W3,27=9.3, p<0.005), treatment (W3,27=13.0, p<0.0005), and strain × treatment interaction (W3,27=12.9, p<0.0005) were apparent. A significant effect of treatment (W3,27=9.4, p<0.005) and strain × treatment interaction (W3,27=5.3, p<0.05) were apparent in the CA3 field, and a significant effect of strain in the CA2 field (W3,27=4.2, p<0.05). There were no significant effects detected in CA1.
Extended amygdala
A main effect of treatment was apparent in six of eight regions of the extended amygdala evaluated in the present analyses (Table 1). Significant effects of strain (W3,27=8.9, p<0.005), treatment (W3,27=9.4, p<0.005), and a strain × treatment interaction (W3,27=8.7 p<0.005) were apparent in the basolateral amygdala. The medial central nucleus of the amygdala showed a significant effect of treatment (W3,27=5.1, p<0.05) and a significant strain × treatment interaction (W3,27=7.2, p<0.005). In the lateral and capsular divisions of the central nucleus of the amygdala there were significant main effects of treatment (W3,27=8.3, p<0.005;W3,27=6.85, p<0.01), respectively. The basomedial amygdala showed a significant effect of treatment (W3,27=7.6, p<0.01). In addition, there were also significant effects of treatment in the bed nucleus of the stria terminalis and the nucleus accumbens core (W3,27=5.0 and W3,27=4.2, p<0.05), but not the nucleus accumbens shell.
Septum
A significant effect of treatment (W3,27=4.1, p<0.05) and strain × treatment interaction (W3,27=6.0, p<0.05) were apparent in the lateral septum. Post-hoc analysis confirmed a significant induction of c-Fos in ethanol withdrawn D2 but not B6 mice (Table 1). No strain or treatment effects were detected in the medial septum.
Cerebral cortex
A strain × treatment effect was found in only one of the nine cortical regions evaluated, the prelimbic cortex (W3,27=4.2, p<0.05; Table 1). Significant treatment effects were apparent in the entorhinal, posterier parietal and auditory cortices (W3,27=8.1, p<0.001; W3,27=10.5, p<0.005, W3,27=4.6, p<0.05), respectively (Table 1).
Basal ganglia
Significant strain × treatment interactions were identified in the substantia nigra (W3,27=5.3, p<0.05) and the lateral globus pallidus (W3,27=8.1, p<0.01). Significant treatment effects were apparent in the caudate putamen (W3,27=13.5, p<0.0005), ventral pallidum (W3,27=6.3, p<0.01), medial globus pallidus (W3,27=4.4, p<0.05) and STN (W3,27=6.4, p<0.05). Post-hoc analysis showed significantly more c-Fos positive neurons in the lateral globus pallidus of ethanol withdrawal B6 mice. Of the 34 brain regions we examined, this is the only region that showed significantly greater c-Fos activation in ethanol withdrawn B6 vs. D2 mice.
Hypothalamus and thalamus
The paraventricular nucleus of the hypothalamus showed significant main effects of strain (W3,27=10.8, p<0.001) and treatment (W3,27=6.5, p=0.01). No significant effects were detected in the anterior paraventricular nucleus of the thalamus or the mediodorsal thalamus (Table 1).
Midbrain and hindbrain
In the ventral tegmental area there were significant effects of strain (W3,27=4.6, p<0.05) and treatment (W3,27=16.1, p<0.0001) but no strain × treatment interaction. The Edinger-Wesphal nucleus showed a significant main effect of treatment (W3,27=15.2, p<0.0001), but no main effect of strain or strain × treatment interaction.
DISCUSSION
Currently, the structures responsible for the onset, propagation, and cessation of generalized alcohol withdrawal convulsions are not known. Work in our laboratory has focused on identifying genes that contribute to genetically determined differences in predisposition to physical dependence and associated withdrawal following chronic ethanol exposure (Buck et al., 2002) and the neural circuitry by which the protein products of these genes influence ethanol dependence and withdrawal. The present studies address the latter using robust animal models, and are the first to begin to elucidate neural circuitry involved in genetically determined differences in chronic ethanol withdrawal severity. Our results suggest that behavioral differences between well-established mouse models of severe (D2) and mild (B6) chronic ethanol withdrawal are influenced by an extended limbic circuit, including the dentate gyrus and CA3 field of the hippocampal formation as well as the extended amygdala (basolateral and central nucleus), lateral septum, and prelimbic cortex in genotype-dependent differences in chronic ethanol withdrawal severity. Our findings lay the foundation to elucidate the neural mechanisms underlying the influence of individual QTLs on chronic ethanol withdrawal by regulating the activities in one or more of the identified brain regions and neurocircuits.
The region with the greatest degree of neuronal activation in ethanol withdrawal D2 mice was the dentate gyrus of the hippocampal formation. Although increased c-Fos expression in the hippocampus has been reported in some studies to be associated with overt seizures following chronic ethanol exposure (Dave et al., 1990; Wilce et al., 1994), it should be kept in mind that none of the mice in the present studies were tested for ethanol withdrawal signs (in order to avoid the potential confound of evoked convulsions on c-Fos immunostaining), nor were spontaneous seizures apparent in any of the animals. The dentate gyrus is composed primarily of granule cells which project along the mossy fiber pathway and form excitatory synapses in area CA3 of the hippocampus (Nadler, 2003), another region activated in the ethanol-withdrawn D2 mice. A reduction in seizure thresholds in models of limbic seizures is associated with loss of GABAergic interneurons in the hilus of the dentate gyrus, and formation of new recurrent excitatory circuits after mossy fiber sprouting (Dudek and Sutula, 2007). Similarly, a reduction in seizure threshold occurs during alcohol withdrawal and is associated with neuronal loss in the hilus of the dentate gyrus and area CA3 in rats (Scorza et al., 2003). Within extended limbic circuitry, limbic seizures originating in the entorhinal cortex propagate to the hippocampus via the perforant path-dentate gyrus route (Avoli et al., 2002), and this circuitry may play a similar role in ethanol withdrawal convulsions. We observed a trend for genotype-dependent activation of the entorhinal cortex in ethanol-withdrawn mice, and the prelimbic cortex, which influences dentate gyrus function through projections to the entorhinal cortex (Jones and Witter, 2007), showed significantly greater neuronal activation in D2 compared to B6 strain mice. Nuclei within the extended amygdala were also selectively activated during alcohol withdrawal in D2 mice, with enhanced c-Fos immunoreactivity in the basolateral and medial central nuclei of the amygdala. The amygdala is part of the medial temporal structures of the brain associated with human partial seizures (Rogawski et al., 2003). The extended amygdala has a role in ethanol withdrawal associated kindling, anxiety and negative affective states (Borlikova et al., 2006; Feng et al., 2007; Funk et al., 2006). Repeated ethanol withdrawal results in a progressive enhancement of convulsion activity known as kindling (Ballenger and Post, 1978; Becker and Hale, 1993) and is associated with greater c-Fos activation in the the central nucleus and basolateral amygdala (Borlikova et al., 2006). The amygdala also participates in generating tonic convulsions during generalized audiogenic seizures in ethanol withdrawn animals, which are attenuated by microinjection of 2-amino-7-phosphonoheptanoate (AP7), an NMDA receptor antagonist, into the central or lateral nuclei of the amygdala (Feng et al., 2007). The central nucleus of the amygdala also participates in ethanol consumption and preference (Dhaher et al., 2008), and administration of a CRF1 receptor antagonist administered into the central nucleus during ethanol withdrawal reduces voluntary consumption ofethanol self-administration in alcohol-dependent animals (Funk et al., 2006).
The initiation and propagation of limbic motor convulsions have been shown to involve the hippocampus and parahippocampal structures (e.g., amygdala and lateral septum; Lothman, 1994; Lothman et al., 1991). Connections between these regions primarily use glutamate as a neurotransmitter, whereas GABAergic interneurons modulate this circuitry (Mraovitch and Calando, 1999). The prelimbic cortex, which also showed genotype-dependent activation in ethanol withdrawn mice, sends glutamatergic projections to the hippocampus and basolateral amygdala (Mraovitch and Calando, 1999; Watson et al., 1985). Furthermore, the basolateral amygdala and the hippocampus both have excitatory glutamatergic projections (Nieuwenhuys, 1996), while the lateral septum sends inhibitory GABAergic projections (Nieuwenhuys, 1996), to the central nucleus of the amygdala. Alcohol exposure and withdrawal could induce neuroplasticity within this circuitry decreasing inhibitory GABAergic tone and enhancing excitatory glutamatergic drive and leading to an exacerbation of withdrawal severity in D2 compared to B6 mice. Future studies using site-directed pharmacological manipulations will be needed to further define this circuit in ethanol withdrawal.
The extended limbic circuit also may contribute to other behaviors associated with the withdrawal syndrome (i.e., tremors, depression-like behavior, anxiety-like behavior, and emotionality). Alterations in hippocamal function are associated with depression. Binge alcohol exposure decreases neurogenesis in the dentate gyrus (He et al., 2005; Herrera et al., 2003; Nixon and Crews, 2002), which is thought to be involved in the therapeutic efficacy of antidepressant treatment (Kempermann et al., 2008). Notably, D2 mice exhibit more severe ethanol withdrawal-associated depression-like behavior than B6 animals (L. Milner and K. Buck, unpublished results). Anxiety is another sign of ethanol withdrawal, and prelimbic cortical lesions increase anxiety-like behavior in rats (Jinks and McGregor, 1997). While many signs of the ethanol withdrawal syndrome are genetically correlated with convulsion (e.g., HIC) severity (i.e., tremors, hypoactivity, emotionality; Belknap et al., 1987; Feller et al., 1994; Kosobud and Crabbe, 1986) others are not (i.e., tail stiffness; Kosobud and Crabbe, 1986). It is well established that the amygdala plays a critical role in anxiety-like behavior in ethanol withdrawn animals (Koob and Le Moal, 2008). Additionally, it is well-documented that alcohol withdrawal HIC severity is genetically correlated with alcohol preference drinking (Hitzemann et al., 2008; Metten and Crabbe, 2005; Metten et al., 1998). The central nucleus of the amygdala has a prominent role in alcohol preference (Dhaher et al., 2008) and projects to the extended limbic nuclei i.e., dentate gyrus. Future studies will assess the contribution of this circuit to the relationship between ethanol preference and withdrawal.
Previously, we identified an extended basal ganglia circuit which is activated in acute ethanol withdrawn D2 mice (Kozell et al., 2005). This acute withdrawal paradigm represents the initial sensitivity to neural excitability following withdrawal from a single hypnotic dose of ethanol (4 g/kg, ip). In the present study the induction of ethanol dependence following chronic exposure to ethanol vapor shows activation of different brain circuitry and involves limbic structures in which activation was not apparent using the acute model. For example, in the present study using the chronic model, prominent activation was evident in ethanol-withdrawn D2 mice in the hippocampal formation, amygdala, septum and prelimbic cortex. In the acute model, there was only slight activation in these regions in ethanol-withdrawn D2 mice, contrasting with prominent activation within the basal ganglia, including the substantia nigra pars reticulata, subthalamic nucleus and ventral pallidum (Kozell et al., 2005). More recently, our laboratory has shown that lesions of the lateral substantia nigra pars reticulata, but not the subthalamic nucleus, reduce withdrawal severity following both acute and repeated ethanol exposures (Chen et al., 2008). The difference in the pattern of neural activation in acute vs. chronic ethanol withdrawal may reflect neuroadaptations that occur with the transition from acute physiological dependence and associated withdrawal to more severe dependence and withdrawal after chronic ethanol exposure. Additionally, previous study has shown a shift from c-Fos to other immediate early gene products (e.g., deltaFosB) in discrete brain regions when drugs are administrated from acutely to chronically, and this shift is involved in epigenic modification (Hope et al., 1994; Kumar et al., 2005; Young et al., 1991). This may also occur for the activation of basal ganglia circuit in acute and chronic ethanol withdrawal. It remains to be determined how enduring neuronal activation is in the acute and chronic models. It will be important for future studies to examine additional time points after withdrawal to address this issue, and better understand the neuroadaptations that occur from initial drug use to later stages of dependence (Kalivas and Volkow, 2005).
In summary, the present study, which assessed the pattern of neural activation associated with chronic ethanol withdrawal, points to the involvement of limbic circuitry in genetically determined differences in chronic ethanol withdrawal. Our results lay the groundwork for further characterization of this circuit in relation to ethanol dependence. Potential future studies to address whether neuronal activation in limbic circuitry is essential to chronic ethanol withdrawal severity include assessing neuronal activation using F2 intercross, heterogeneous stock (HS), and/or short-term selective breeding populations that differ in chronic ethanol withdrawal severity. The latter would be particularly useful because sufficient numbers of animals could be bred to assess the time course of c-Fos induction, as well as that of other immediate early gene products (e.g., ΔFOSB) associated with physiological dependence on ethanol and associated withdrawal. Finally, future site-directed lesion and neurochemical studies will be necessary to determine the influence of limbic nuclei and pathways on chronic ethanol withdrawal severity.
Acknowledgments
Acknowledgment of Research Support: We thank Drs. John Crabbe and Andrey Ryabinin for helpful suggestions on this project and a draft of this manuscript. Supported by PHS grants AA011114, AA13685, AA10760, DA05228, AA06243 and the Department of Veterans Affairs.
Footnotes
Publisher's Disclaimer: This is a PDF file of an unedited manuscript that has been accepted for publication. As a service to our customers we are providing this early version of the manuscript. The manuscript will undergo copyediting, typesetting, and review of the resulting proof before it is published in its final citable form. Please note that during the production process errors may be discovered which could affect the content, and all legal disclaimers that apply to the journal pertain.
References
- Avoli M, D’Antuono M, Louvel J, Kohling R, Biagini G, Pumain R, D’Arcangelo G, Tancredi V. Network and pharmacological mechanisms leading to epileptiform synchronization in the limbic system in vitro. Prog Neurobiol. 2002;68:167–207. doi: 10.1016/s0301-0082(02)00077-1. [DOI] [PubMed] [Google Scholar]
- Ballenger JC, Post RM. Kindling as a model for alcohol withdrawal syndromes. Br J Psychiatry. 1978;133:1–14. doi: 10.1192/bjp.133.1.1. [DOI] [PubMed] [Google Scholar]
- Becker HC, Hale RL. Repeated episodes of ethanol withdrawal potentiate the severity of subsequent withdrawal seizures: an animal model of alcohol withdrawal “kindling”. Alcohol Clin Exp Res. 1993;17:94–98. doi: 10.1111/j.1530-0277.1993.tb00731.x. [DOI] [PubMed] [Google Scholar]
- Belknap JK, Laursen SE, Crabbe JC. Ethanol and nitrous oxide produce withdrawal-induced convulsions by similar mechanisms in mice. Life Sci. 1987;41:2033–2040. doi: 10.1016/0024-3205(87)90477-2. [DOI] [PubMed] [Google Scholar]
- Borlikova GG, Le Merrer J, Stephens DN. Previous experience of ethanol withdrawal increases withdrawal-induced c-fos expression in limbic areas, but not withdrawal-induced anxiety and prevents withdrawal-induced elevations in plasma corticosterone. Psychopharmacology (Berl) 2006;185:188–200. doi: 10.1007/s00213-005-0301-3. [DOI] [PubMed] [Google Scholar]
- Buck KJ, Metten P, Belknap JK, Crabbe JC. Quantitative trait loci involved in genetic predisposition to acute alcohol withdrawal in mice. J Neurosci. 1997;17:3946–3955. doi: 10.1523/JNEUROSCI.17-10-03946.1997. [DOI] [PMC free article] [PubMed] [Google Scholar]
- Buck KJ, Rademacher BS, Metten P, Crabbe JC. Mapping murine loci for physical dependence on ethanol. Psychopharmacology (Berl) 2002;160:398–407. doi: 10.1007/s00213-001-0988-8. [DOI] [PubMed] [Google Scholar]
- Chang SL, Patel NA, Romero AA. Activation and desensitization of Fos immunoreactivity in the rat brain following ethanol administration. Brain Res. 1995;679:89–98. doi: 10.1016/0006-8993(95)00210-h. [DOI] [PubMed] [Google Scholar]
- Chen G, Kozell LB, Hitzemann R, Buck KJ. Involvement of the limbic basal ganglia in ethanol withdrawal convulsivity in mice is influenced by a chromosome 4 locus. J Neurosci. 2008;28:9840–9849. doi: 10.1523/JNEUROSCI.1713-08.2008. [DOI] [PMC free article] [PubMed] [Google Scholar]
- Crabbe JC. Provisional mapping of quantitative trait loci for chronic ethanol withdrawal severity in BXD recombinant inbred mice. J Pharmacol Exp Ther. 1998;286:263–271. [PubMed] [Google Scholar]
- Dave JR, Tabakoff B, Hoffman PL. Ethanol withdrawal seizures produce increased c-fos mRNA in mouse brain. Mol Pharmacol. 1990;37:367–371. [PubMed] [Google Scholar]
- De Witte P, Pinto E, Ansseau M, Verbanck P. Alcohol and withdrawal: from animal research to clinical issues. Neurosci Biobehav Rev. 2003;27:189–197. doi: 10.1016/s0149-7634(03)00030-7. [DOI] [PubMed] [Google Scholar]
- Demarest K, Hitzemann B, Mahjubi E, McCaughran J, Jr, Hitzemann R. Further evidence that the central nucleus of the amygdala is associated with the ethanol-induced locomotor response. Alcohol Clin Exp Res. 1998;22:153–11537. [PubMed] [Google Scholar]
- Dhaher R, Finn D, Snelling C, Hitzemann R. Lesions of the extended amygdala in C57BL/6J mice do not block the intermittent ethanol vapor-induced increase in ethanol consumption. Alcohol Clin Exp Res. 2008;32:197–208. doi: 10.1111/j.1530-0277.2007.00566.x. [DOI] [PubMed] [Google Scholar]
- Dudek FE, Sutula TP. Epileptogenesis in the dentate gyrus: a critical perspective. Prog Brain Res. 2007;163:755–773. doi: 10.1016/S0079-6123(07)63041-6. [DOI] [PubMed] [Google Scholar]
- Feller DJ, Bassir JM, Crabbe JC, Le Fevre CA. Audiogenic seizure susceptibility in WSP and WSR mice. Epilepsia. 1994;35:861–867. doi: 10.1111/j.1528-1157.1994.tb02524.x. [DOI] [PubMed] [Google Scholar]
- Feng HJ, Yang L, Faingold CL. Role of the amygdala in ethanol withdrawal seizures. Brain Res. 2007;1141:65–73. doi: 10.1016/j.brainres.2007.01.017. [DOI] [PubMed] [Google Scholar]
- Funk CK, O’Dell LE, Crawford EF, Koob GF. Corticotropin-releasing factor within the central nucleus of the amygdala mediates enhanced ethanol self-administration in withdrawn, ethanol-dependent rats. J Neurosci. 2006;26:11324–11332. doi: 10.1523/JNEUROSCI.3096-06.2006. [DOI] [PMC free article] [PubMed] [Google Scholar]
- He J, Nixon K, Shetty AK, Crews FT. Chronic alcohol exposure reduces hippocampal neurogenesis and dendritic growth of newborn neurons. Eur J Neurosci. 2005;21:2711–2720. doi: 10.1111/j.1460-9568.2005.04120.x. [DOI] [PubMed] [Google Scholar]
- Herrera DG, Yague AG, Johnsen-Soriano S, Bosch-Morell F, Collado-Morente L, Muriach M, Romero FJ, Garcia-Verdugo JM. Selective impairment of hippocampal neurogenesis by chronic alcoholism: protective effects of an antioxidant. Proc Natl Acad Sci USA. 2003;100:7919–7924. doi: 10.1073/pnas.1230907100. [DOI] [PMC free article] [PubMed] [Google Scholar]
- Hitzemann B, Hitzemann R. Genetics ethanol and the Fos response: a comparison of the C57BL/6J and DBA/2J inbred mouse strains. Alcohol Clin Exp Res. 1997;21:1497–1507. [PubMed] [Google Scholar]
- Hitzemann R, Edmunds S, Wu W, Malmanger B, Walter N, Belknap J, Darakjian P, McWeeney S. Detection of reciprocal quantitative trait loci for acute ethanol withdrawal and ethanol consumption in heterogeneous stock mice. Psychopharmacology (Berl) 2008 doi: 10.1007/s00213-008-1418-y. [DOI] [PMC free article] [PubMed] [Google Scholar]
- Hope BT, Nye HE, Kelz MB, Self DW, Iadarola MJ, Nakabeppu Y, Duman RS, Nestler EJ. Induction of a long-lasting AP-1 complex composed of altered Fos-like proteins in brain by chronic cocaine and other chronic treatments. Neuron. 1994;13:1235–1244. doi: 10.1016/0896-6273(94)90061-2. [DOI] [PubMed] [Google Scholar]
- Jinks AL, McGregor IS. Modulation of anxiety-related behaviours following lesions of the prelimbic or infralimbic cortex in the rat. Brain Res. 1997;772:181–190. doi: 10.1016/s0006-8993(97)00810-x. [DOI] [PubMed] [Google Scholar]
- Jones BF, Witter MP. Cingulate cortex projections to the parahippocampal region and hippocampal formation in the rat. Hippocampus. 2007;17:957–976. doi: 10.1002/hipo.20330. [DOI] [PubMed] [Google Scholar]
- Kang D, Schwartz JB, Verotta D. A sample size computation method for non-linear mixed effects models with applications to pharmacokinetics models. Stat Med. 2004;23:2551–2566. doi: 10.1002/sim.1695. [DOI] [PubMed] [Google Scholar]
- Kempermann G, Krebs J, Fabel K. The contribution of failing adult hippocampal neurogenesis to psychiatric disorders. Curr Opin Psychiatry. 2008;21:290–295. doi: 10.1097/YCO.0b013e3282fad375. [DOI] [PubMed] [Google Scholar]
- Koob GF, Le Moal M. Review. Neurobiological mechanisms for opponent motivational processes in addiction. Philos Trans R Soc Lond B Biol Sci. 2008;363:3113–3123. doi: 10.1098/rstb.2008.0094. [DOI] [PMC free article] [PubMed] [Google Scholar]
- Kosobud A, Crabbe JC. Ethanol withdrawal in mice bred to be genetically prone or resistant to ethanol withdrawal seizures. J Pharmacol Exp Ther. 1986;238:170–177. [PubMed] [Google Scholar]
- Kozell L, Hitzemann R, Buck K. Acute alcohol withdrawal is associated with c-Fos expression in the basal ganglia and associated circuitry: C57BL/6J and DBA/2J inbred mouse strain analyses. Alcohol Clin Exp Res. 2005;29:1939–1948. doi: 10.1097/01.alc.0000187592.57853.12. [DOI] [PubMed] [Google Scholar]
- Kumar A, Choi KH, Renthal W, Tsankova NM, Theobald DE, Truong HT, Russo SJ, Laplant Q, Sasaki TS, Whistler KN, et al. Chromatin remodeling is a key mechanism underlying cocaine-induced plasticity in striatum. Neuron. 2005;48:303–314. doi: 10.1016/j.neuron.2005.09.023. [DOI] [PubMed] [Google Scholar]
- Le F, Wilce PA, Hume DA, Shanley BC. Involvement of gamma-aminobutyric acid and N-methyl-D-aspartate receptors in the inhibitory effect of ethanol on pentylenetetrazole-induced c-fos expression in rat brain. J Neurochem. 1992;59:1309–1315. doi: 10.1111/j.1471-4159.1992.tb08442.x. [DOI] [PubMed] [Google Scholar]
- Levental M, Tabakoff B. Sodium-potassium-activated adenosine triphosphatase activity as a measure of neuronal membrane characteristics in ethanol-tolerant mice. J Pharmacol Exp Ther. 1980;212:315–319. [PubMed] [Google Scholar]
- Littleton J. Neurochemical mechanisms underlying alcohol withdrawal. Alcohol Health Res World. 1998;22:13–24. [PMC free article] [PubMed] [Google Scholar]
- Lothman EW. Seizure circuits in the hippocampus and associated structures. Hippocampus. 1994;4:286–290. doi: 10.1002/hipo.450040311. [DOI] [PubMed] [Google Scholar]
- Lothman EW, Bertram EH, 3rd, Stringer JL. Functional anatomy of hippocampal seizures. Prog Neurobiol. 1991;37:1–82. doi: 10.1016/0301-0082(91)90011-o. [DOI] [PubMed] [Google Scholar]
- McCabe JT, Desharnais RA, Pfaff DW. Graphical and statistical approaches to data analysis for in situ hybridization. Methods Enzymol. 1989;168:822–848. doi: 10.1016/0076-6879(89)68061-5. [DOI] [PubMed] [Google Scholar]
- Metten P, Crabbe JC. Alcohol withdrawal severity in inbred mouse (Mus musculus) strains. Behav Neurosci. 2005;119:911–925. doi: 10.1037/0735-7044.119.4.911. [DOI] [PubMed] [Google Scholar]
- Metten P, Phillips TJ, Crabbe JC, Tarantino LM, McClearn GE, Plomin R, Erwin VG, Belknap JK. High genetic susceptibility to ethanol withdrawal predicts low ethanol consumption. Mamm Genome. 1998;9:983–990. doi: 10.1007/s003359900911. [DOI] [PubMed] [Google Scholar]
- Morgan JI, Cohen DR, Hempstead JL, Curran T. Mapping patterns of c-fos expression in the central nervous system after seizure. Science. 1987;237:192–197. doi: 10.1126/science.3037702. [DOI] [PubMed] [Google Scholar]
- Morgan PF, Nadi NS, Karanian J, Linnoila M. Mapping rat brain structures activated during ethanol withdrawal: role of glutamate and NMDA receptors. Eur J Pharmacol. 1992;225:217–223. doi: 10.1016/0922-4106(92)90023-o. [DOI] [PubMed] [Google Scholar]
- Moy SS, Knapp DJ, Duncan GE, Breese GR. Enhanced ultrasonic vocalization and Fos protein expression following ethanol withdrawal: effects of flumazenil. Psychopharmacology (Berl) 2000;152:208–215. doi: 10.1007/s002130000507. [DOI] [PubMed] [Google Scholar]
- Mraovitch S, Calando Y. Interactions between limbic, thalamo-striatal-cortical, and central autonomic pathways during epileptic seizure progression. J Comp Neurol. 1999;411:145–161. [PubMed] [Google Scholar]
- Nadler JV. The recurrent mossy fiber pathway of the epileptic brain. Neurochem Res. 2003;28:1649–1658. doi: 10.1023/a:1026004904199. [DOI] [PubMed] [Google Scholar]
- Nieuwenhuys R. The greater limbic system, the emotional motor system and the brain. Prog Brain Res. 1996;107:551–580. doi: 10.1016/s0079-6123(08)61887-7. [DOI] [PubMed] [Google Scholar]
- Nixon K, Crews FT. Binge ethanol exposure decreases neurogenesis in adult rat hippocampus. J Neurochem. 2002;83:1087–1093. doi: 10.1046/j.1471-4159.2002.01214.x. [DOI] [PubMed] [Google Scholar]
- Olive MF, Mehmert KK, Nannini MA, Camarini R, Messing RO, Hodge CW. Reduced ethanol withdrawal severity and altered withdrawal-induced c-fos expression in various brain regions of mice lacking protein kinase C-epsilon. Neuroscience. 2001;103:171–179. doi: 10.1016/s0306-4522(00)00566-2. [DOI] [PubMed] [Google Scholar]
- Rogawski MA, Gryder D, Castaneda D, Yonekawa W, Banks MK, Lia H. GluR5 kainate receptors, seizures, and the amygdala. Ann N Y Acad Sci. 2003;985:150–162. doi: 10.1111/j.1749-6632.2003.tb07079.x. [DOI] [PubMed] [Google Scholar]
- Scorza FA, Arida RM, Cysneiros RM, Priel MR, de Albuquerque M, Cavalheiro EA. The effects of alcohol intake and withdrawal on the seizures frequency and hippocampal morphology in rats with epilepsy. Neurosci Res. 2003;47:323–328. doi: 10.1016/s0168-0102(03)00220-7. [DOI] [PubMed] [Google Scholar]
- Terdal ES, Crabbe JC. Indexing withdrawal in mice: matching genotypes for exposure in studies using ethanol vapor inhalation. Alcohol Clin Exp Res. 1994;18:542–547. doi: 10.1111/j.1530-0277.1994.tb00907.x. [DOI] [PubMed] [Google Scholar]
- Watson RE, Jr, Siegel HE, Siegel A. A [14C]2-deoxyglucose analysis of the functional neural pathways of the limbic forebrain in the rat. V The septal area. Brain Res. 1985;346:89–107. doi: 10.1016/0006-8993(85)91098-4. [DOI] [PubMed] [Google Scholar]
- Wilce P, Beckmann A, Shanley B, Matsumoto I. Gene expression during ethanol withdrawal. Alcohol Alcohol Suppl. 1994;2:97–102. [PubMed] [Google Scholar]
- Young ST, Porrino LJ, Iadarola MJ. Cocaine induces striatal c-fos-immunoreactive proteins via dopaminergic D1 receptors. Proc Natl Acad Sci USA. 1991;88:1291–1295. doi: 10.1073/pnas.88.4.1291. [DOI] [PMC free article] [PubMed] [Google Scholar]