Abstract
This study measured the pronation-supination torque, the flexion force, and the EMG activity in elbow flexor muscles during an isometric contraction in which a submaximal elbow flexion force was kept constant for as long as possible. Ten subjects performed the contraction at 20% of maximal voluntary contraction (MVC) torque until failure. Electromyographic (EMG) activity of the long and short heads of biceps brachii, brachialis, brachioradialis, and triceps brachii was recorded with surface and intramuscular electrodes. The mean time to failure was 8.2 ± 6.2 min. The fluctuations in flexion force and pronation-supination torque were correlated (r range: 0.68 to 0.92), and subjects exhibited a range of pronation-torque profiles that were not associated with the time to failure. Knowing the influence of concurrent actions about the pronation-supination axis during a submaximal fatiguing contraction with the elbow flexor muscles has implications for the design of workstations in ergonomic settings and in the prescription of activities for rehabilitation programs.
Keywords: isometric contraction, muscle activity, muscle fatigue, neural strategy
Introduction
When humans perform a submaximal fatiguing contraction, the duration that the task can be sustained is influenced by the capacity of the nervous system to activate the muscles required to produce the intended action.2 In addition to generating the requisite net muscle torque, the nervous system must also provide adequate postural support and minimize unwanted actions produced by the involved muscles. An inability to satisfy these requirements can limit the duration of a fatiguing contraction. For example, Le Bozec and Bouisset 9 found that the duration seated subjects could push against a rigid restraint at shoulder level and maintain a target force of 75% of maximum was limited by the activation of postural muscles (rectus abdominus and rectus femoris) and not that of the prime mover (serratus anterior). Similarly, Rudroff et al. 12 observed that the time to task failure for elbow flexors when they sustain an isometric contraction at 20% of the maximal voluntary contraction (MVC) force was limited by the more substantial activation of the rotator cuff (infraspinatus, supraspinatus, teres minor) and posterior deltoid muscles when the arm was in one position compared with another position.
A less obvious constraint is that associated with controlling the off-axis actions of the involved muscles.8 Due to differences in the locations of skeletal attachments, muscles can be synergists for one action but antagonists for another. For example, the biceps brachii can generate flexion torque about the elbow and supination torque about the forearm, whereas brachioradialis can exert flexion torque about the elbow and pronation or supination torque about the forearm.1,3,10,18 The purpose of the study was to determine the influence of the incidental pronation-supination torque on the duration that elbow flexor muscles could sustain a submaximal isometric contraction in the flexion direction. Because the duration that individuals can sustain a fatiguing contraction with the elbow flexor muscles can be limited by the ability to keep the forearm in a supinated position14, we hypothesized that the time to failure of a sustained submaximal contraction with the elbow flexor muscles and the forearm in a neutral position would be negatively associated with the magnitude of the pronation-supination torque. Some of these data have been presented previously in abstract form.17
Methods
Subjects and procedures
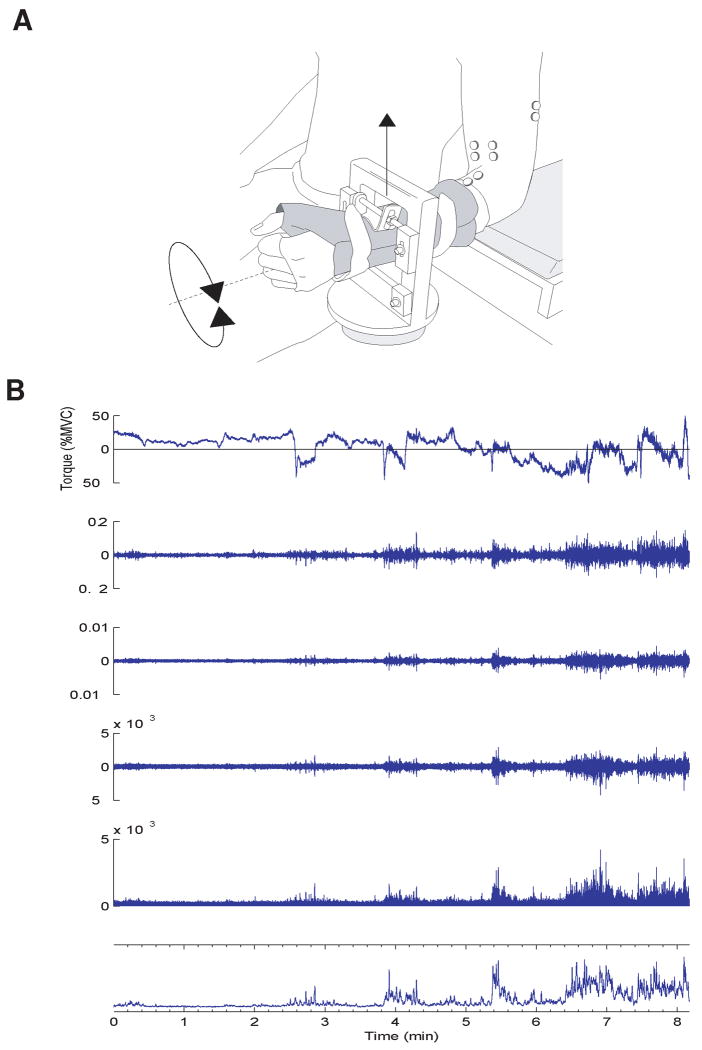
Ten healthy men (mean ± SD: age, 28.2 ± 3.6 years; mass, 72.5 ± 8.6 kg; height, 1.8 ± 0.1 m) who reported no neurological or cardiovascular disorders participated in the experiment. Informed written consent was obtained before participation in the study. The Human Subjects Committee at the University of Colorado approved the protocol. The experimental design (Figure 1) and procedures were similar to those described in previous studies.7,12
Figure 1.
Experimental arrangement and signal conditioning. (A) Subjects were seated in an adjustable chair with the left upper arm vertical and the lower arm horizontal. The hand and forearm were placed in a modified wrist-hand-thumb orthosis. The task involved generating an isometric flexion force with the arm. (B) To examine the association between the changes in force and torque, the signals were high-pass filtered at 1 Hz (second trace), differentiated (third trace), high-pass filtered at 10 Hz (fourth trace), rectified (fifth trace), and low-pass filtered at 1Hz (bottom trace). Similar conditioning was applied to the EMG signals to compare changes in amplitude.
MVCs were performed with the elbow flexor, extensor, supinator, and pronator muscles. Two to three MVCs were performed with each muscle group. Each trial comprised a 3-s increase in force from zero to maximum, and the maximal force was held for 2-3 s. The subjects were verbally encouraged to achieve maximal force. There was a ∼60-s rest between trials. The greatest force achieved by each subject was taken as the MVC force, and the peak value achieved with the elbow flexors was used to calculate the target force for the fatiguing contraction.
Subjects then performed a constant isometric contraction at 20% MVC force until task failure. The target force exerted in the upward direction was displayed on a monitor located in front of the subjects. The criterion for task termination was an inability to sustain the force within 5% of the target value for at least 5 s despite strong verbal encouragement. At task failure, the subject was instructed to relax and then to perform immediately (< 2 s) an MVC with the elbow flexors.
Mechanical recording
Subjects were seated with the left elbow joint flexed to a right angle and the upper arm aligned vertically (Figure1).6,12 The elbow was placed on a padded support that restrained downward and backward movements of the arm and forearm. The forearm was tightly fixed in a wrist-hand-thumb orthosis (Orthomerica, Newport Beach, CA, USA) that was attached to a force transducer (Force-Moment Sensor, JR-3, Woodland, California, USA) to measure the upward force at the wrist and the pronation-supination torque about the longitudinal axis of the forearm. Although the upward force was the result of torque generated by elbow flexor muscles about the elbow joint, it will be referred to as a flexion force because it was produced by the elbow flexors. The position of the arm and forearm was aligned with the principal directions of the force transducer so that an elbow flexion torque produced only upward force and torque about the longitudinal axis of the forearm produced only pronation-supination torque. Forces and torques were recorded using a Power 1401 analog-to-digital converter (1000 samples/s, 12-bit resolution) and Spike2 software (Version 5.02, Cambridge Electronics Design, Cambridge, UK). The flexion force was displayed on a 17-inch screen (1 % MVC/cm) that was located at eye height ∼1 m in front of the subjects. Subjects had to match the flexion force to the target force, which was indicated by a horizontal line on the monitor.
Electrical recording
Intramuscular and surface EMG activities were recorded from five muscles of the arm: long and short heads of biceps brachii, brachialis, brachioradialis, and triceps brachii. The EMG activity of the brachialis muscle and the long head of biceps brachii were measured with intramuscular bipolar wire electrodes. The intramuscular electrodes comprised two stainless steel wires (100-μm diameter) that were insulated with Formvar (California Fine Wire Company, Grover Beach, CA). A disposable 25-gauge hypodermic needle was used to insert the wires to a defined depth in each muscle. Based on previously obtained ultrasound images for each participant, the location of the two insertions was ∼5 cm proximal to the elbow joint, and the brachialis electrode was ∼0.5 cm medial to the electrode in the biceps brachii. The brachialis electrode was inserted to 1/3 of muscle depth and the biceps brachii electrode to 1/2 of muscle depth.15 Each needle was removed before the recordings began. Pairs of surface electrodes (Ag-AgCl, 8-mm diameter; 20-mm distance between electrodes) were attached over the long and short heads of biceps brachii and brachioradialis (2 cm distal to the elbow joint), and the lateral head of triceps brachii. Reference electrodes were placed over the clavicle or the acromion process. The electrodes for each muscle were placed distally between the innervation zone and the muscle tendon junction. The EMG signals were amplified (2000×) and band-pass filtered (13 -1000 Hz; Coulbourn Instruments, Allentown, PA) before being recorded directly to a computer using a Power1401 A-D converter (Version 5.02, Cambridge Electronics Design, Cambridge, UK) and displayed on an oscilloscope. The EMG signals were digitized at 2000 samples/s.
Data analysis
The data were analyzed with Matlab 7.2 (The Mathworks, Inc, Natick MA). Flexion force and pronation-supination torque were normalized to the respective MVC values, and the mean torques over the entire contraction were estimated. More rapid changes in the flexion force and pronation-supination torque were compared after both signals were high-pass filtered at 1 Hz (1st order Butterworth, bidirectional) prior to calculating the standard deviation (SD) at six times for a 30 s interval (start, 20, 40, 60, 80%, and end of contraction duration). Correlation coefficients between the magnitude of changes in flexion force and the pronation-supination torque (Figure 1B) were determined after both high-pass filtered (1 Hz) signals had been mathematically differentiated, high-pass filtered at 10 Hz, rectified, and low-pass filtered at 1 Hz (1st order Butterworth, bidirectional).
Similarly, the surface EMG signals were high-pass filtered at 10 Hz, rectified, and low-pass filtered at 1 Hz (both filters: 1st order Butterworth, bidirectional) and compared with correlation coefficients. Changes in pronation-supination torque and changes in the amplitude of the surface EMG for the long head of the biceps brachii muscle as a representative elbow flexor were compared with correlation coefficients after the two signals were mathematically differentiated (diff function), rectified, and low-pass filtered at 0.1 Hz (1st order Butterworth, bidirectional).
Statistics
Statistical analysis was performed with a significance level set at 5%. ANOVAs were completed in SPSS (SPSS 15.0; SPSS Inc., Chicago Ill, USA) with the following dependent variables: (1) SDs of flexion force and pronation-supination torque at different time points during the contraction (2 force, torque × 6 times); (2) EMG amplitudes at different time points (6 muscles × 6 times).
The association between selected variables was performed in Matlab (p-value of correlation coefficient): (1) Changes in flexion force compared to changes in pronation-supination torque; (2) The magnitude of change in pronation-supination torque compared to time to failure; (3) EMG amplitudes between six muscles; (4) Association between pairs of six EMG amplitudes within subjects; (5) Change of EMG amplitude (long head of biceps brachii) compared to change in pronation-supination torque, and (6) association between six EMG amplitudes compared to the association between changes in pronation-supination torque; (7) Association between the magnitude of changes of EMG amplitude and torque compared to time to failure.
Results
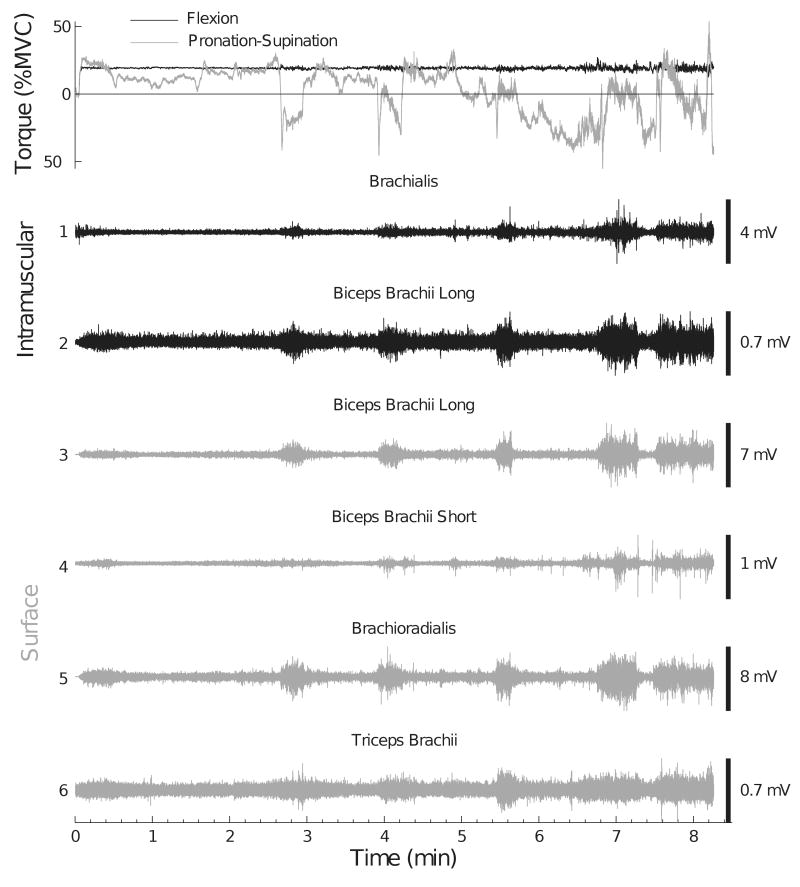
The MVC flexion force exerted at the wrist was 272 ± 76.6 N, which corresponded to an MVC flexor torque of 75.7 ± 18.8·N m. The time to task failure for the sustained contraction at 20% MVC force was 8.2 ± 6.2 min. At the end of the contraction the MVC flexor torque declined by 20.9% (P < 0.01) to a final value of 59.9 ± 9.5 N·m. The elbow flexor muscles exhibited bursts of activity in the surface and intramuscular EMG signals during the constant-force contraction (Figure 2). Although the flexion force was held constant, the pronation-supination torque varied considerably in magnitude and direction. The peak supination and pronation torques averaged 41.2 ± 27.9% MVC supination torque and 38.2 ± 32.2% MVC pronation torque, respectively. The mean torque during the contraction ranged from −25% MVC pronation to 33% MVC supination across subjects.
Figure 2.
Representative recordings of the flexion force and pronation-supination torque exerted at the wrist and EMG activity of selected elbow muscles for one subject (Subject 9) during an isometric contraction at 20% MVC force sustained until task failure. The upper panel shows flexion force and pronation-supination torque (pronation torque: negative values). Traces 1 and 2 correspond to intramuscular EMG recordings, and traces 3-6 denote surface EMG recordings. Subject 9 exhibited high correlations between the EMG amplitudes (Table 1 and Figure 6).
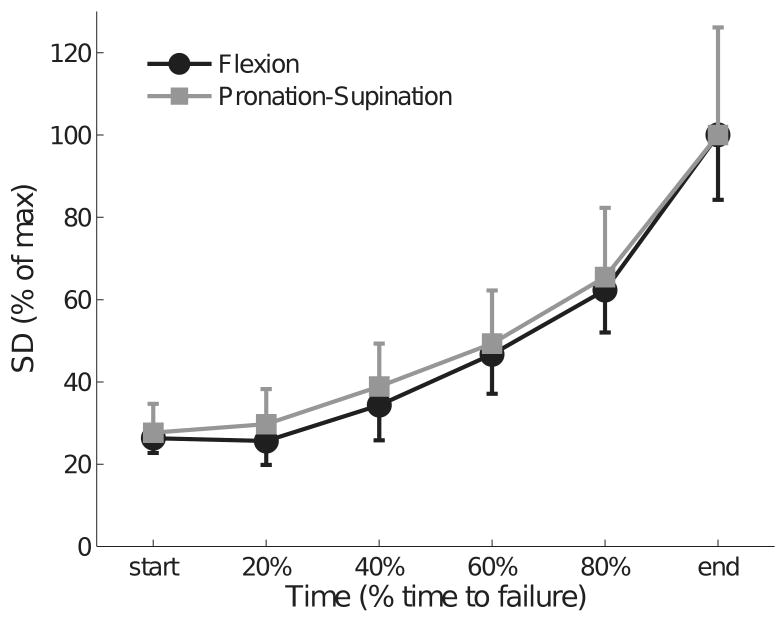
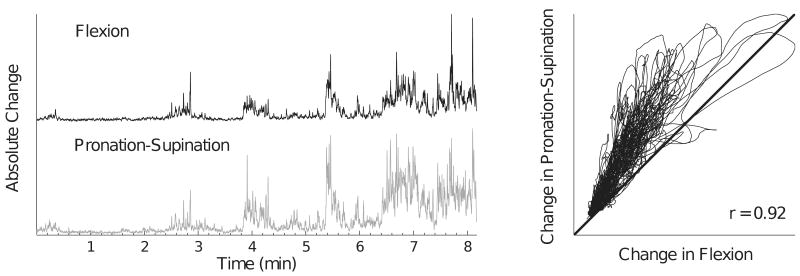
The SD of the flexion force and the pronation-supination torque increased at a similar rate (P < 0.001) and reached values that were 73% greater at the end of the task compared with the start of the contraction (Figure 3). There was a significant association between changes in the flexion force and the pronation-supination torque (r = 0.92 ± 0.07, P < 0.01) (Figure 4).
Figure 3.
Normalized standard deviations (SD) of flexion (flx) force and pronation-supination (sup) torque increased at a similar rate during the fatiguing contraction. SD was normalized to the mean SD obtained during the last 30 s of each contraction and averaged across subjects. The error bars indicate the standard error across subjects.
Figure 4.
Magnitude of the absolute changes (rectified and differentiated) in the flexion force and the pronation-supination torque for one subject (same as Figure 2; Subject 9) during the fatiguing contraction (left panel). The right panel shows the linear association (r = 0.92) between the changes in the flexion force and the supination torque.
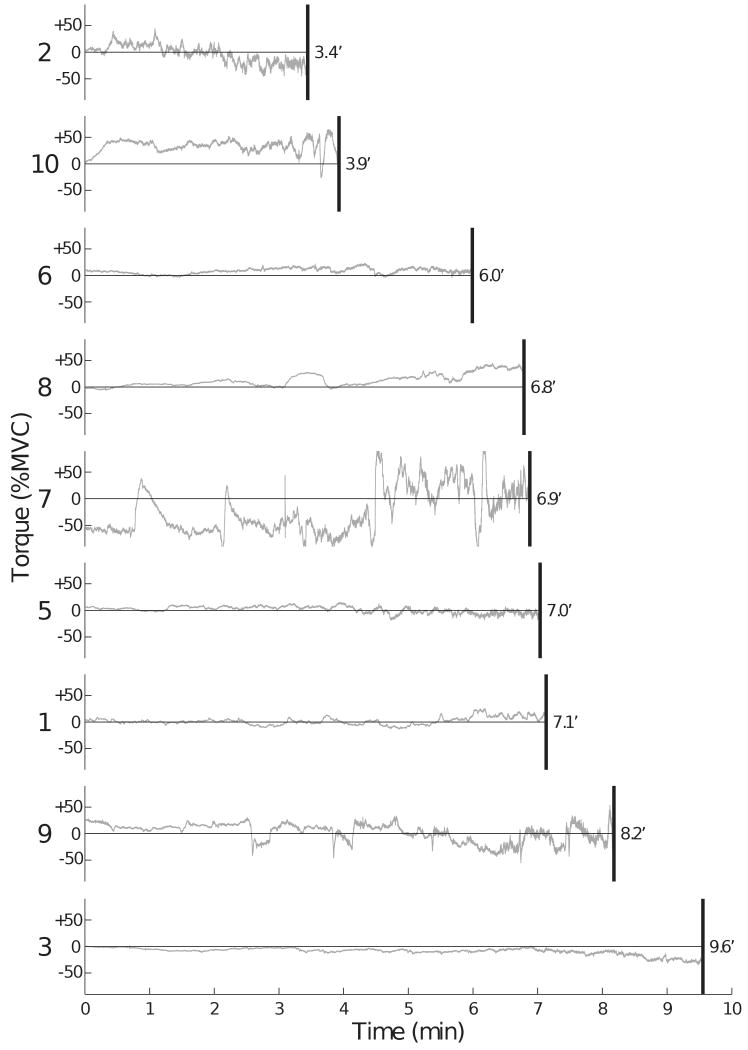
The subjects used a variety of pronation-supination torque profiles during the fatiguing contraction (Figure 5). Three subjects (3, 5, and 6) exerted a pronation-supination torque that remained close to zero for the entire duration of the contraction. Two subjects (3 and 8) generated a pronation-supination torque that was close to zero for most of the contraction, but then drifted to a net supination (Subject 8) or pronation (Subject 3) torque. Four subjects (2, 7, 9, and 10) produced a pronation-supination torque with more pronounced changes either around the zero value (Subjects 2 and 9) or with a significant bias (Subjects 7 and 10). There was no association between either the magnitude of change in the pronation-supination torque (P = 0.7) or the strategy used by the subject and the time to task failure.
Figure 5.
Traces of pronation-supination torques ranked based on the time to task failure for nine of the ten subjects showing time to task failure below 10 min. Subject numbers are indicated to the left of each trace. Subject 4 (not shown) sustained the contraction for 26 min and exhibited a supination torque profile that was similar to Subject 9. Positive and negative values are supination and pronation torques, respectively.
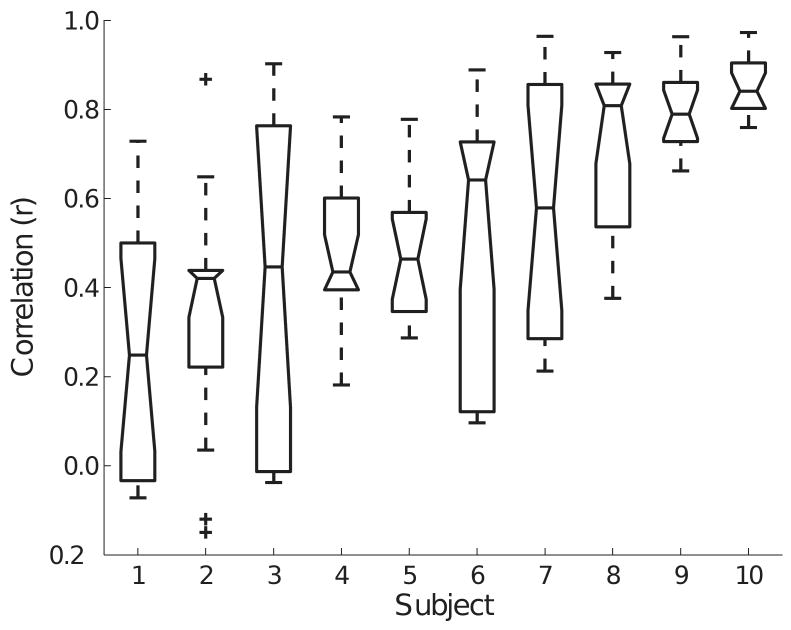
Average EMG amplitude increased similarly (P > 0.05) for the elbow flexor muscles from an initial value of 19.0 ± 14.0% at the start of the contraction to 32.8 ± 14.1% at the end. Despite the high correlations between the changes in flexion force and pronation-supination torque, the association between the amplitudes of the six EMG signals was highly variable across subjects (range: r = 0.26 ± 0.27 to 0.85 ± 0.08, P < 0.01) (Figure 6). For example, subject 10 exhibited greater common modulation of EMG amplitudes during the fatiguing contraction than did Subject 1 (Table 1). There was no association between the mean correlation coefficient for all muscles within a subject and the time to task failure.
Figure 6.
Ranked (mean) correlation values between EMG amplitudes for the six recordings (see Figure 1) for ten subjects. The data comprise the correlations between all pairs of EMG recordings for each subject. The middle line represents the median value, the error bars indicate the range, the lower and higher notched boxes denote the interquartile range, and the positive signs correspond to outliners. There was a statistical difference in the mean correlation values across subjects, which indicates that Subject 10 exhibited more common modulation of EMG amplitudes during the fatiguing contraction than Subject 1.
Table 1.
Ranked correlation coefficients of the six EMG amplitudes for all subjects and correlations between EMG2 and supination-pronation torque.
| subject | 1 | 2 | 3 | 4 | 5 | 6 | 7 | 8 | 9 | 10 | ||
|---|---|---|---|---|---|---|---|---|---|---|---|---|
| EMGi-EMGi | mean | range | ||||||||||
| 1-2 | 0.00 | 0.31 | -0.02 | 0.62 | 0.51 | 0.10 | 0.26 | 0.56 | 0.87 | 0.97 | 0.42 | 0.99 |
| 1-3 | 0.30 | -0.15 | 0.01 | 0.78 | 0.58 | 0.12 | 0.96 | 0.86 | 0.84 | 0.97 | 0.53 | 1.12 |
| 1-4 | -0.07 | 0.44 | 0.39 | 0.59 | 0.65 | 0.64 | 0.26 | 0.46 | 0.96 | 0.96 | 0.53 | 1.03 |
| 1-5 | 0.19 | -0.12 | -0.04 | 0.60 | 0.34 | 0.10 | 0.89 | 0.86 | 0.79 | 0.79 | 0.44 | 1.01 |
| 1-6 | -0.06 | 0.43 | 0.30 | 0.43 | 0.46 | 0.72 | 0.28 | 0.38 | 0.73 | 0.81 | 0.45 | 0.86 |
| 2-3 | 0.73 | 0.87 | 0.90 | 0.61 | 0.78 | 0.89 | 0.94 | 0.93 | 0.69 | 0.84 | 0.82 | 0.33 |
| 2-4 | 0.25 | 0.20 | -0.02 | 0.36 | 0.34 | 0.10 | 0.87 | 0.81 | 0.80 | 0.82 | 0.45 | 0.89 |
| 2-5 | -0.07 | 0.65 | 0.52 | 0.18 | 0.70 | 0.70 | 0.32 | 0.43 | 0.94 | 0.80 | 0.52 | 1.01 |
| 2-6 | 0.60 | 0.45 | 0.76 | 0.32 | 0.55 | 0.69 | 0.81 | 0.81 | 0.91 | 0.81 | 0.67 | 0.59 |
| 3-4 | 0.51 | 0.44 | 0.67 | 0.42 | 0.45 | 0.73 | 0.77 | 0.75 | 0.66 | 0.76 | 0.62 | 0.36 |
| 3-5 | 0.25 | 0.04 | -0.04 | 0.52 | 0.29 | 0.14 | 0.59 | 0.85 | 0.74 | 0.87 | 0.42 | 0.91 |
| 3-6 | -0.04 | 0.36 | 0.45 | 0.39 | 0.37 | 0.59 | 0.21 | 0.53 | 0.82 | 0.84 | 0.45 | 0.88 |
| 4-5 | 0.59 | 0.43 | 0.87 | 0.43 | 0.38 | 0.82 | 0.58 | 0.90 | 0.76 | 0.87 | 0.66 | 0.52 |
| 4-6 | 0.31 | 0.28 | 0.78 | 0.44 | 0.32 | 0.82 | 0.58 | 0.86 | 0.72 | 0.76 | 0.59 | 0.57 |
| 5-6 | 0.48 | 0.42 | 0.76 | 0.50 | 0.47 | 0.52 | 0.55 | 0.84 | 0.73 | 0.92 | 0.62 | 0.50 |
| mean | 0.26 | 0.34 | 0.42 | 0.48 | 0.48 | 0.51 | 0.59 | 0.72 | 0.80 | 0.85 | 0.55 | |
| range | 0.80 | 1.02 | 0.94 | 0.60 | 0.49 | 0.79 | 0.75 | 0.55 | 0.30 | 0.21 | 0.40 | |
| EMG2-Sup./Pro. | 0.37 | 0.29 | 0.26 | 0.12 | 0.18 | 0.31 | 0.73 | 0.29 | 0.51 | 0.36 | 0.34 | 0.61 |
Each row lists the correlation coefficients for one pair of EMG recordings, with the numbers corresponding to the traces in Figure 1: intramuscular recordings for brachialis (1) and the long head of biceps brachii (2), and surface recordings for the long (3) and short (4) heads of biceps brachii, brachioradialis (5), and triceps brachii (6). The last row shows the correlations between the change in EMG amplitude of biceps brachii long head and supination-pronation torque.
A significant difference in the correlation coefficients for pairs of EMG amplitudes was found within subjects (P = 0.04). The largest mean correlation coefficient across subjects (r = 0.82) was for the combination of the intramuscular and surface recordings for the long head of biceps brachii (Table 1: EMG2-EMG3). The next largest mean correlations were between the short and long heads of biceps brachii (r = 0.62) and all combinations of the antagonist muscle (triceps brachii) with the elbow flexor muscles (range: 0.45 to 0.67). Although there was minimal coactivation of triceps brachii during the fatiguing contraction (reaching 6.67 ± 4.39% of maximum at the end of task duration), its amplitude was modulated in parallel with those for the elbow flexor muscles. The mean correlation coefficient between triceps brachii and the elbow flexors was least for brachialis (r = 0.45) and greatest for the long head of biceps brachii (r = 0.67).
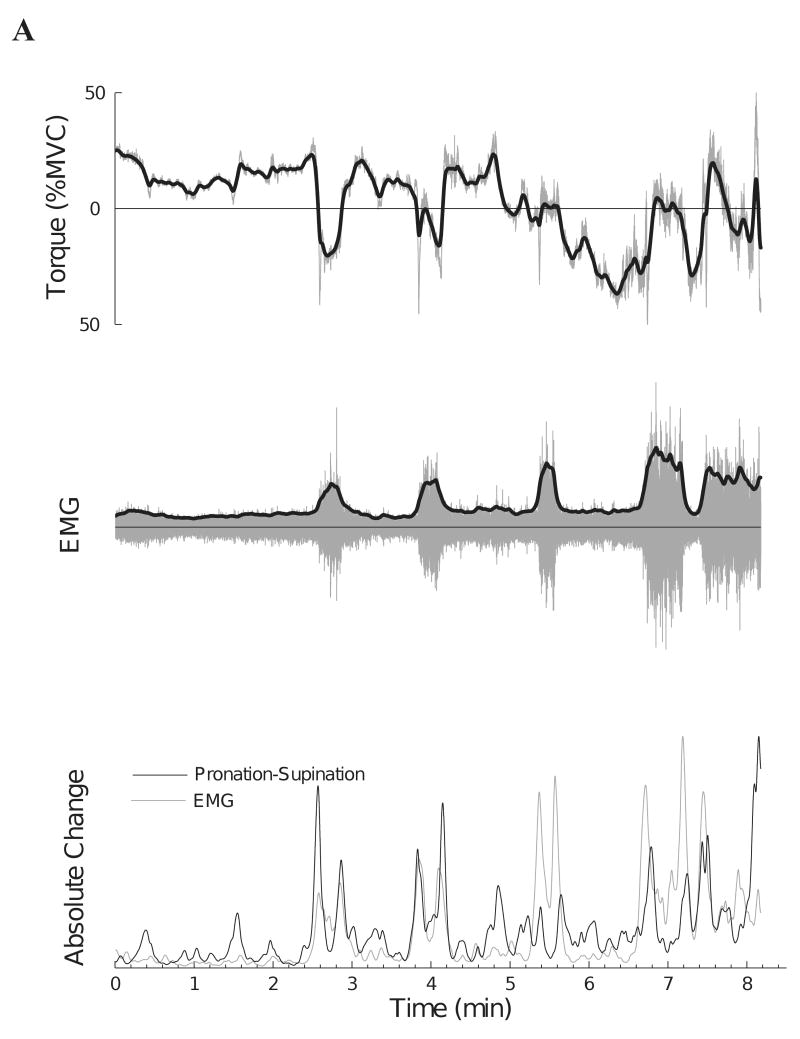
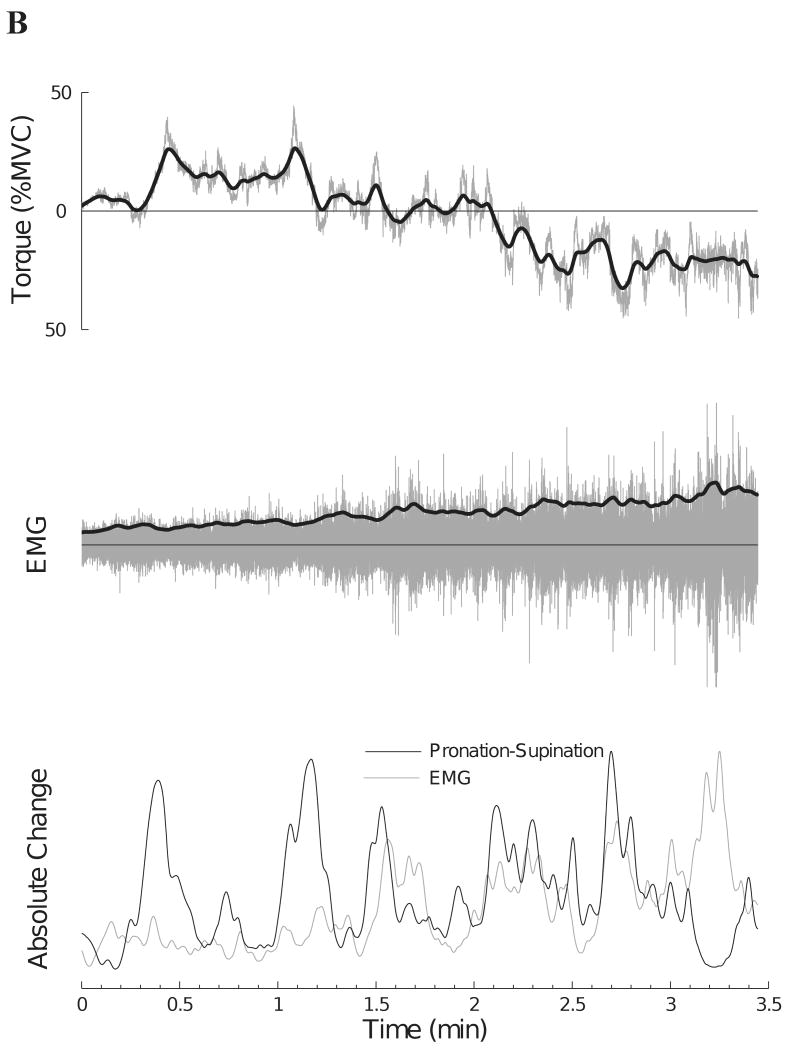
There was a modest correlation across subjects between the change in EMG amplitude and the change in the pronation-supination torque (mean: r = 0.34, range: r = 0.12 to 0.73, P < 0.01) (Table 1). One subject (Figure 6, Subject 9) who had a moderate correlation (r = 0.51) between the two signals exhibited pronounced changes in muscle activity that were associated with changes in the pronation-supination torque (Figure 7A). In contrast, Figure 7B shows another subject who had a low correlation (r = 0.12) between the two differentiated signals. Subjects with a stronger association between the six EMG amplitudes also showed a stronger association between the modulation of EMG amplitude (biceps brachii long head) and changes in pronation-supination torque (r = 0.84, P < 0.01). Nonetheless, there was no association (r = −0.11, P = 0.77) between the magnitude of the correlation for the two differentiated signals and the time to task failure.
Figure 7.
The relation between the pronation-supination torque and amplitude of the surface EMG for the long head of biceps brachii for two subjects. Upper traces indicate the original (gray line) and smoothed (dark line) pronation-supination torque (pronation torque: negative values). Middle traces indicate the interference EMG (gray line) and the rectified smoothed version (dark line) of the amplitude for the long head of biceps brachii muscle. Lower traces show the magnitude of the rectified and differentiated signals for the EMG amplitude and pronation-supination torque. A: Subject 9 in Figure 6 exhibited a higher correlation (r = 0.51) between the two differentiated signals. B: Subject 2 in Figure 6 produced a low correlation (r = 0.12) between the two differentiated signals.
Discussion
When subjects were asked to sustain a submaximal target force with the elbow flexor muscles for as long as possible, the involved muscles concurrently exerted torque about the pronation-supination axis of the forearm. Changes in the magnitude of pronation-supination torque were associated with changes in flexion force. A range of associations in the modulation of EMG amplitude was found for the six recordings, including a consistently moderate association between elbow flexor muscles and the antagonist muscle. Although some subjects exhibited a correlation between changes in pronation-supination torque and changes in the EMG amplitude, there was no association between the strategy used by a subject with the pronation-supination torque and the time to task failure.
Despite the many activation patterns that can be exhibited by elbow flexor muscles, the relative activation is quite stereotypical across subjects when they perform fatiguing contractions, although the pattern can differ with task and arm posture. For example, EMG amplitude for the long and short head of biceps brachii, brachialis, and brachioradialis increased in parallel when subjects sustained an isometric contraction at 20% MVC torque with the elbow flexed at a right angle and the forearm horizontal and in a neutral posture.7 In contrast, EMG amplitude for the short head of biceps brachii increased more rapidly when the same task was performed with the forearm vertical and in a supinated posture.14 Furthermore, EMG amplitude for brachialis increased less than the other elbow flexors when subjects performed intermittent contractions (6-s contraction, 4-s rest) to a target force of 50% MVC torque for as long as possible with the forearm horizontal and in a neutral posture.5 Nonetheless, the task-specific adjustments were consistent across subjects in those studies.
As with the range of pronation-supination torque profiles (Figure 5), the amount of correlation in EMG amplitude during the fatiguing contraction varied between pairs of muscles and across subjects (Table 1 and Figure 6). Some subjects used common modulation of EMG amplitude for most muscles (Subjects 9 and 10), whereas other subjects displayed more independent control of amplitude across the six EMG signals (Subjects 1 and 2). Due to the diversity of patterns across subjects and surface and intramuscular recordings, the correlations are unlikely to be contaminated too much by cross talk. Rather, the results demonstrate that stereotypical coordination of the muscles cannot be expected in all conditions.
Similar differences were observed across pairs of muscles. The biggest range of correlations in EMG amplitude across pairs of muscles involved brachialis and the other five EMG signals (Table 1). Presumably, this variability was due to the singular action of brachialis (flexion force) compared with the dual actions of the other elbow flexors (flexion force and pronation-supination torque). The association between changes in EMG activity and changes in pronation-supination torque also varied across subjects, as indicated by the relation between changes in torque and changes in the amplitude of the surface EMG for the long head of biceps brachii (Figure 7). The range of associations between the two differentiated signals suggests that the contributions of other muscles to the change in the pronation-supination torque, such as pronator quadratus, pronator teres, and supinator, 4,11,16 also varied across subjects.1
In contrast to the association between the amount of correlation for the EMG amplitudes and the time to failure, the pronation-supination torque profile did not influence the duration that the contraction could be sustained as hypothesized (see Figure 5). For example, subjects who generated the lowest pronation-supination torques did not consistently produce the longest contractions, and those with the greatest pronation-supination torques did not always have the shortest contractions. One explanation is that the absolute torques are relatively minor; for example, MVC torques are about 16 N·m for supination and 13 N·m for pronation,11 which contrasts with ∼80 N·m for elbow flexors. In the current study, the mean pronation-supination torques ranged from −25% MVC (pronation) to 33% MVC (supination). Although there was no association across subjects between the pronation-supination torque strategy and the time to failure, this does not preclude the possibility that within-subject changes in strategy might prolong the duration of the sustained contraction.
In summary, there was no association between the pronation-supination torques and the time to failure of a sustained elbow flexor contraction. Although some subjects demonstrated an association between changes in EMG amplitude for the long head of biceps brachii and fluctuations in the pronation-supination torque, this was not a consistent finding across subjects. Nonetheless, subjects who exhibited a high correlation between EMG amplitudes also demonstrated a high correlation between changes in EMG amplitude and changes in the pronation-supination torque. The results indicate that the duration an individual can sustain a submaximal elbow flexor torque was not impaired by the associated actions about the pronation-supination axis of the forearm, at least when the forearm was horizontal and in a neutral position. The findings have implications for the design of workstations in ergonomic settings and in the prescription of activities for rehabilitation programs.
Acknowledgments
The work was supported by an award (NS043275) from the National Institute of Neurological Disorders and Stroke (to R. M. Enoka) and an award (No. 115183) from the Swiss National Science Foundation (to D. Staudenmann).
Abbreviations
- aEMG
average electromyographic activity
- ANOVA
analysis of variance
- MVC
maximal voluntary contraction
References
- 1.Buchanan TS, Rovai GP, Rymer WZ. Strategies for muscle activation during isometric torque generation at the human elbow. J Neurophysiol. 1989;62:1201–1212. doi: 10.1152/jn.1989.62.6.1201. [DOI] [PubMed] [Google Scholar]
- 2.Enoka RM, Duchateau J. Muscle fatigue: what, why and how it influences muscle function. J Physiol. 2008;586:11–23. doi: 10.1113/jphysiol.2007.139477. [DOI] [PMC free article] [PubMed] [Google Scholar]
- 3.Gielen CC, Van Zuylen EJ. Coordination of arm muscles during flexion and supination: application of the tensor analysis approach. J Neurosci. 1986;17:527–539. doi: 10.1016/0306-4522(86)90028-x. [DOI] [PubMed] [Google Scholar]
- 4.Gordon KD, Pardo RD, Johnson JA, King GJ, Miller TA. Electromyographic activity and strength during maximum isometric pronation and supination efforts in healthy adults. J Orthop Res. 2004;22:208–213. doi: 10.1016/S0736-0266(03)00115-3. [DOI] [PubMed] [Google Scholar]
- 5.Hunter SK, Critchlow A, Shin IS, Enoka RM. Men are more fatigable than strength-matched women when performing intermittent submaximal contractions. J Appl Physiol. 2004;96:2125–2132. doi: 10.1152/japplphysiol.01342.2003. [DOI] [PubMed] [Google Scholar]
- 6.Hunter SK, Enoka RM. Changes in muscle activation can prolong the endurance time of a submaximal isometric contraction in humans. J Appl Physiol. 2003;94:108–118. doi: 10.1152/japplphysiol.00635.2002. [DOI] [PubMed] [Google Scholar]
- 7.Hunter SK, Ryan DL, Ortega JD, Enoka RM. Task differences with the same load torque alter the endurance time of submaximal fatiguing contractions in humans. J Neurophysiol. 2002;88:3087–3096. doi: 10.1152/jn.00232.2002. [DOI] [PubMed] [Google Scholar]
- 8.Lawrence JH, Nichols TR, English AW. Cat hindlimb muscles exert substantial torques outside the sagittal plane. J Neurophysiol. 1993;69:282–285. doi: 10.1152/jn.1993.69.1.282. [DOI] [PubMed] [Google Scholar]
- 9.Le Bozec S, Bouisset S. Do bimanual isometric push efforts in humans stop as a consequence of postural muscle exhaustion. Neurosci Let. 2004;356:61–65. doi: 10.1016/j.neulet.2003.09.052. [DOI] [PubMed] [Google Scholar]
- 10.Murray WM, Delp SL, Buchanan TS. Variation of muscle moment arms with elbow and forearm position. J Biomech. 1995;28:513–525. doi: 10.1016/0021-9290(94)00114-j. [DOI] [PubMed] [Google Scholar]
- 11.O'Sullivan LW, Gallwey TJ. Upper-limb electro-myography at maximum supination and pronation torques: the effect of elbow and forearm angle. J Electromyogr Kinesiol. 2002;12:275–285. doi: 10.1016/s1050-6411(02)00014-7. [DOI] [PubMed] [Google Scholar]
- 12.Rudroff T, Barry BK, Stone AL, Barry CJ, Enoka RM. Accessory muscle activity contributes to the variation in time to task failure for different arm postures and loads. J Appl Physiol. 2007a;102:1000–1006. doi: 10.1152/japplphysiol.00564.2006. [DOI] [PubMed] [Google Scholar]
- 13.Rudroff T, Christou EA, Poston B, Bojsen-Møller J, Enoka RM. Time to failure of a sustained contraction is predicted by target torque and initial electromyographic bursts in elbow flexor muscles. Muscle Nerve. 2007b;35:657–666. doi: 10.1002/mus.20752. [DOI] [PubMed] [Google Scholar]
- 14.Rudroff T, Poston B, Shin S, Bojsen-Møller J, Enoka RM. Net excitation of the motor unit pool varied with load type during fatiguing contractions. Muscle Nerve. 2005;29:78–87. doi: 10.1002/mus.20241. [DOI] [PubMed] [Google Scholar]
- 15.Rudroff T, Staudenmann D, Enoka RM. Electromyographic measures of muscle activation and changes in muscle architecture of human elbow flexors during fatiguing contractions. J Appl Physiol. doi: 10.1152/japplphysiol.01058.2007. in press. [DOI] [PubMed] [Google Scholar]
- 16.Sergio LE, Ostry DJ. Coordination of multiple muscles in two degrees of freedom elbow movements. Exp Brain Res. 1995;105:123–137. doi: 10.1007/BF00242188. [DOI] [PubMed] [Google Scholar]
- 17.Staudenmann D, Rudroff T, Enoka RM. Supination forces influence elbow flexor activity during submaximal fatiguing contractions. Soc Neurosci Abstr. 2007;621:3. [Google Scholar]
- 18.Zhang L, Butler J, Nishida T, Nuber G, Huang H, Rymer WZ. In vivo determination of the direction of rotation and moment-angle relationship of individual elbow muscles. J Biomech Eng. 1998;120:625–633. doi: 10.1115/1.2834754. [DOI] [PubMed] [Google Scholar]


