

Abstract
Background and Purpose
This study investigates the effects of statin treatment on experimental intracerebral hemorrhage (ICH) using behavioral, histological, and magnetic resonance imaging (MRI) measures of recovery.
Methods
Primary ICH was induced in rats. Simvastatin (2 mg/kg), atorvastatin (2 mg/kg) or phosphate-buffered saline (n=6/group) was given daily for 1 week. MRI studies were performed 2–3 days before ICH, and at 1–2 hours, and 1, 2, 7, 14 and 28 days post-ICH. The ICH evolution was assessed via hematoma volume measurements using susceptibility-weighted imaging (SWI) and tissue loss using T2 maps and hemotoxylin and eosin (H&E) histology. Neurobehavioral tests were done before ICH and at various time points post-ICH. Additional histological measures were performed with doublecortin and bromodeoxyuridine stainings.
Results
Initial ICH volumes determined by SWI were similar across all groups. Simvastatin significantly reduced hematoma volume at 4 weeks (P=0.002 versus control with acute volumes as baseline), whereas that for atorvastatin was marginal (P=0.09). MRI estimates of tissue loss (% of contralateral hemisphere) for treated rats were significantly lower (P=0.0003 and 0.001, respectively) than for control at 4 weeks. Similar results were obtained for H&E histology (P=0.0003 and 0.02, respectively). Tissue loss estimates between MRI and histology were well correlated (R2=0.764, P<0.0001). Significant improvement in neurological function was seen 2–4 weeks post-ICH with increased neurogenesis observed.
Conclusions
Simvastatin and atorvastatin significantly improved neurological recovery, decreased tissue loss, and increased neurogenesis when administered for 1 week post-ICH.
Keywords: Hematoma, statin, MRI, SWI, rat
Spontaneous intracerebral hemorrhage (ICH) is one of the most lethal forms of stroke that accounts for ~10% of all strokes, results in ~30–50% mortality and is often associated with debilitating neurological deficits in survivors.1,2 To date, surgical approaches for ICH treatment3 have not been very effective and no satisfactory drug treatment exists in clinical practice.
Cholesterol lowering drugs, such as 3-hydroxy-3-methyl-glutaryl-coenzyme A (HMG-CoA) reductase inhibitors, or statins, have been shown to have beneficial effects after various forms of experimental brain injury such as ischemic stroke,4,5 traumatic brain injury (TBI),6–8 subarachnoid hemorrhage,9 and ICH.10,11 Statins reduce inflammation, superoxide free radicals, and thrombus formation and increase cell survival, endothelial cell function, nitric oxide bioavailability, and ultimately angiogenesis, neurogenesis, and synaptogenesis.4,12–14 Following treatment of experimental ischemic stroke with atorvastatin, latent neural progenitor cells in the region of the subventricular zone (SVZ) generate neuroblasts and increase the signaling activity necessary for neurogenesis.4,11 Ischemic and hemorrhagic strokes exhibit several common injury-phenomena including blood-brain barrier (BBB) disruption, edema, oxidative injury, perilesional cellular and inflammatory processes, and excitatory injury.15,16 Statins increase blood flow and inhibit thrombus formation in ischemic stroke. Although the neuroprotective effects of statins on ICH are not well established, some studies of experimental ICH have shown improvement in functional recovery with atorvastatin treatment.10,11
Due to its multiparametric nature, MRI has become a standard imaging methodology for both ischemic and hemorrhagic stroke.17–19 It has high sensitivity for assessing the temporal evolution of intraparenchymal hemorrhage.19,20 After ICH onset, blood goes through sequential stages of degradation from oxyhemoglobin to deoxyhemoglobin, methemoglobin, and then hemosiderin, which can be identified using MRI. Deoxyhemoglobin, methemoglobin, and hemosiderin are paramagnetic and generate an inhomogeneity in magnetic fields.21 Depending on the time of study, the hematoma core and surrounding regions become hyperintense or hypointense in SWI and T2 weighted images relative to normal brain tissues as associated with the various states of hemoglobin.20 These types of MRIs can be used to assess ICH evolution.
Simvastatin, a fermentation-derived, natural statin and atorvastatin, a synthetic statin13 have different lipid solubility profiles, with simvastatin being more lipophilic.22 Since the putative neuroprotective actions of statins on the ICH model are little known, we used MRI, histology, and neurobehavioral tests in the present study to assess ICH evolution. We investigated two hypotheses: 1) that simvastatin and/or atorvastatin after ICH onset can reduce tissue loss and hematoma volume and promote neurological recovery in a rat model of ICH; and 2) that temporal MRI measurements can be used to generate tissue damage profiles in experimental ICH, which correlate favorably to histological results.
Materials and methods
ICH model
All studies were approved by the Institutional Animal Care and Use Committee. Wistar rats (270–330 g) were anesthetized using isofluorane (3.5% induction, 1.0–1.5% maintenance) in a 2:1 mixture of N2O/O2. Core temperature was maintained at 36–37°C throughout all surgical and MRI procedures. Primary ICH was induced by direct infusion of 100 μL of fresh (nonheparinized) autologous whole blood into the right striatum adjacent to the SVZ at a constant rate of 10 μL/min.11,20,23,24 For the acute post-ICH time point, the right femoral artery and vein were cannulated for monitoring of blood pressure and administration of Gd-DTPA (200 μmol/kg), respectively. For follow-up studies, the Gd-DTPA was administered through a tail vein.
Statin treatments
Eighteen healthy animals were subjected to ICH. At 24 hours post-ICH, the animals were randomly assigned to experimental groups (n=6/group). Group 1 received 2 mg/kg atorvastatin, group 2 received 2 mg/kg simvastatin, and group 3 (control group) received the same volume of phosphate buffered saline (PBS) daily for 1 week by oral gavage. The statin dosage was selected based on earlier studies.11
MR imaging
MRI measurements were performed using a 7 Tesla, 20-cm bore superconducting magnet (Magnex Scientific, Inc., Abingdon, UK) interfaced to a Bruker Advance console (Bruker Biospin MRI, Billerica, Massachusetts). A 3-plane scout imaging sequence was used to adjust the position of the animal’s head until the central slice was located at the level of the largest ICH area. After setup, a series of MR images including spin-spin (T2) relaxation weighted imaging, and susceptibility weighted imaging (SWI) were acquired. MR imaging was performed before ICH (baseline), 1–2 hours after ICH onset, and at 1, 2, 7, 14 and 28 days post-ICH.
T2 measurements
T2 was measured using a standard Carr-Purcell-Meiboom-Gill multi-slice (13 slices, 1-mm thick) multi-echo MRI sequence. Echo times (TEs) were 15,30, 45, 60, 75, and 90 ms, and repetition time (TR) was 5.0 s. Images were acquired using 128×64 matrix over a 32-mm field of view (FOV).
SWI measurements
The SWI measurements were done using a three-dimensional gradient recalled echo (3D-GRE) sequence that is sensitive to the presence of paramagnetic substances.17,18 SWI data were acquired using TR/TE=30ms/10ms, a 25° flip angle, averages=4, 256×256×96 matrix over a 32×32×24 mm3 FOV. After reconstruction, 128 coronal slices were generated (125×125×190 μm3 resolution).
MRI data analysis
The T2 weighted images were reconstructed using a 128×128 matrix and T2 maps were produced. Tissue loss in the ipsilateral hemisphere at 4 weeks post-ICH was estimated by measuring ipsilateral and contralateral hemisphere volumes (minus ventricular volumes) over all of the 1-mm thick T2 maps showing hematoma or ventricular expansion. The measurement was expressed as a percentage of the contralateral minus ipsilateral hemisphere volume divided by the contralateral hemisphere volume. The ICH lesion volume was estimated from SWI data.
Neurobehavioral testing
Functional outcome was assessed using a cornering test and modified neurological severity score (mNSS) at 1, 4, 7, 14, 21 and 28 days after ICH. The cornering test measures the number of times that an animal turns to the right or left when placed in a corner (the normal state being 50%).25 The mNSS is a composite score of motor, sensory, balance, and reflex measures that are used to assess neurological functions using a 0–18 scale, with higher scores implying greater neurological injury.26
Histology and immunohistochemistry
All rats received daily intraperitoneal (i.p.) injections of 100 mg/kg bromodeoxyuridine (BrdU) from 1 to 13 days post-ICH. After the 4-week post-ICH MRI study, the animals were anesthetized by i.p. injection of ketamine (44 mg/kg) and xylazine (13 mg/kg) and perfused transcardially with PBS, followed by 4% paraformaldehyde in PBS. Histopathological assessment was performed to estimate the degree of tissue injury and the percentage of ipsilateral tissue loss in a manner similar to that used for the MRI data.20
Sets of 6-μm thick coronal sections were taken at 0.5-mm intervals through the entire region of ICH and stained with hematoxylin and eosin (H&E). Additional adjacent sections were used for immunochemical staining as described elsewhere.23 Semiquantitative immunostaining measurements of BrdU (a marker for proliferation cells), doublecortin (DCX; a marker for migrating neuroblasts) and Neuronal Nuclei (NeuN, a marker for mature neurons) were performed. BrdU-positive cells were counted in the SVZ and dentate gyrus (DG). DCX-positive areas and BrdU-DCX co-labeled cells were estimated to determine the proportion within the ipsilateral SVZ. BrdU-NeuN immunoreactive cells were counted in the boundary zone.
Statistical analysis
All data analysts were blinded to the treatment. Estimates of tissue loss, reduction of hematoma volume, and neurobehavioral outcome at various times post-ICH between statin-treated and control groups were compared using Student’s t-tests. Correlational analysis between MRI and histological estimates of tissue loss was done by linear regression. Data are reported as mean±standard error of the mean (SEM). Statistical significance was inferred at P≤0.05.
Results
T2 and SWI images
Figure 1 shows T2 maps and SWI from the central ICH coronal slice of a representative animal brain from each treatment group for all MRI time points, and corresponding H&E histology image. In both image types, the core regions appeared dark at the acute stage. Inner and outer rims were visible on T2 maps at early time points after ICH and the core region became hyperintense at later time points. In contrast, the core on SWI became hyperintense from 1 day to 1 week and then reversed becoming dark again at 2 and 4 weeks. SWI is highly sensitive to the presence of deoxyhemoglobin at the acute time and other degraded hemoglobin products at later times. The hyperintense core region visible from 1 day to 2 weeks is believed to be due to the presence of extracellular methemoglobin.
Figure 1.

T2 maps (top row), corresponding susceptibility-weighted images (SWI) (bottom row) and H&E histology section (last column) of the central coronal slice from control (top), simvastatin-treated (middle) and atorvastatin-treated animals (bottom) at baseline, and 1–2 hours, 1 and 2 days, and 1, 2, and 4 weeks post-ICH. The T2 maps showed a dark central core region (low T2) acutely that reversed in intensity later. SWI showed low signal intensity in the core region at 1–2 hours, 2 and 4 weeks, and high intensity at 1, 2 and 7 days.
Neurobehavioral tests
Results for the cornering and mNSS tests are presented in Figure 2. All rats had normal scores for both neurobehavioral tests at baseline (Pre-ICH) and displayed similar neurological impairments at day 1 after ICH. No significant differences were found between treatment groups before 1 week post-ICH. Cornering scores for the simvastatin group improved marginally at 1 week (P=0.060) and significantly at 2 (P=0.008), 3 (P=0.015), and 4 (P=0.028) weeks post-ICH compared to the control group. The atorvastatin group showed significant improvement at 2 (P=0.044), 3 (P=0.016), and 4 (P =0.033) weeks. Similarly, improvement of mNSS was marginal at 1 week in the simvastatin group (P=0.057) and significant at 2 (P =0.027), 3 (P=0.027), and 4 (P=0.017) weeks post-ICH compared to the control group. The atorvastatin group showed significant improvement at 2 (P=0.030), 3 (P=0.040), and 4 (P=0.018) weeks post-ICH. Overall, the simvastatin group appeared to improve mildly better than the atorvastatin group, but was not statistically significant.
Figure 2.

Values (mean±SEM) of cornering test (A), and modified neurological severity scores (B) at baseline, days 1 and 4, and weeks 1, 2, 3 and 4 post-ICH. Both simvastatin and atorvastatin treated groups improved significantly 2 weeks post-ICH onwards (P<0.05, Student’s t-test).
Tissue loss measurements
Tissue loss estimates (% of contralateral hemisphere) for the simvastatin and atorvastatin groups were significantly smaller (P=0.0003 and 0.001, respectively from T2 maps and P=0.00035 and 0.019, respectively from H&E histology) than the control group at 4 weeks. The direct estimates of tissue volume loss results similarly showed significant reduction in the statin-treated groups. (simvastatin, 22.4±2.6 mm3; atorvastatin, 25.7±2.6 mm3; control, 37.9±3.4 mm3 using histology, and simvastatin, 10.70±1.68 mm3; atorvastatin, 13.86±1.73 mm3; control, 32.17±4.58 mm3 using MRI). Although the simvastatin group showed less tissue loss than the atorvastatin group, the difference was not significant. The tissue loss values of all three groups between MRI and H&E histology measurements were well correlated (R2=0.76, P<0.0001) (Figure 3).
Figure 3.
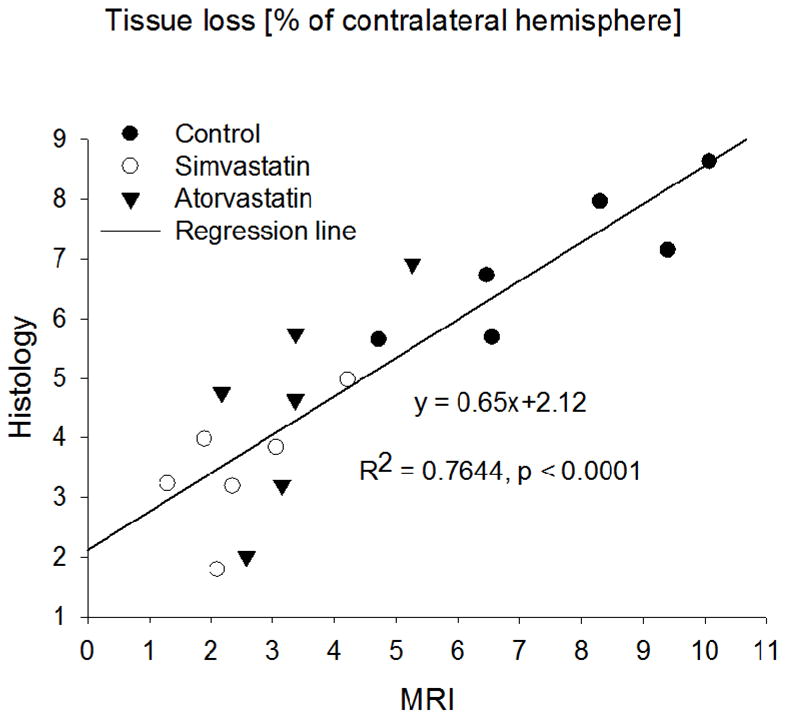
Percentage of ipsilateral hemispheric tissue loss, relative to the contralateral hemisphere, measured 4 weeks post-ICH from T2 maps and histology. The measurements plotted include all three-treatment groups (n=18); the solid line is the linear-regression fit. They were significantly correlated (P<0.0001).
Hematoma volume measurements
Hematoma volumes measured at 1–2 hours, 1 day and 4 weeks using SWI images are shown in Figure 4. Although the average hematoma volumes did not differ between treatment groups at 1–2 hours and 1 day post-ICH, the simvastatin group was significantly smaller than that of the control group at 4 weeks (P=0.002), considering the acute time (1–2 hours) hematoma volumes as the baseline. In contrast, the average hematoma volume of the atorvastatin group was slightly smaller than that of the control group at 4 weeks, but the difference was not significant (P=0.096).
Figure 4.
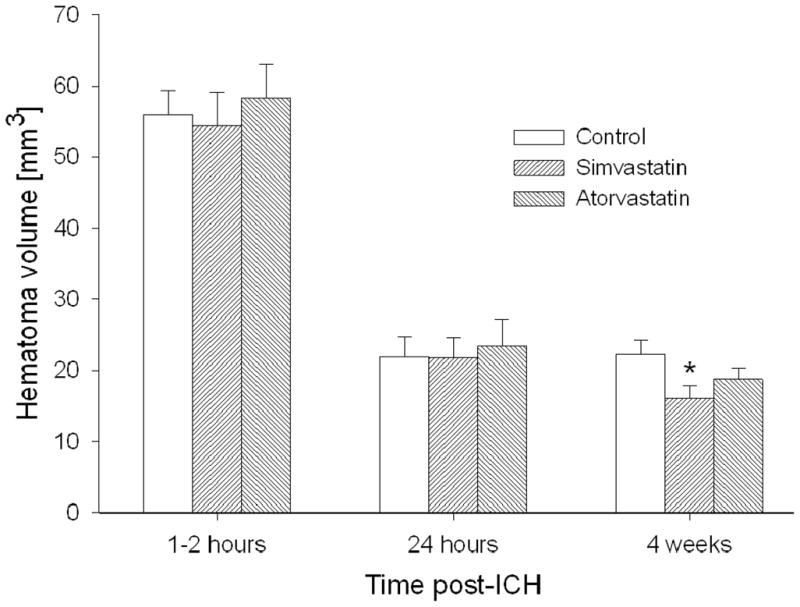
Hematoma volumes (mean±SEM) at 1–2 hours, 24 hours and 4 weeks after ICH onset. The hematoma volume of the simvastatin group was significantly reduced at 4 weeks, whereas that of the atorvastatin group decreased marginally (*P<0.05 vs control).
Cell proliferation and Neurogenesis
Recovery after ICH may be fostered by endogenous cell proliferation. To test the influence that statins may have on this process, BrdU immunostaining was performed. The ipsilateral SVZ demonstrated significant increase in the number of newly formed cells in the statin-treated groups at 28 days post-ICH, compared to the control group (P<0.05) (Figure 5). There were some proliferating cells found in the DG without significant difference between the treated and untreated groups (Table 1). Consistent with the tissue loss results, simvastatin treatment further influenced the number of BrdU-positive cells over the atorvastatin treatment, but it was not significantly different. DCX is a microtubule-associated protein that is expressed almost exclusively in immature neurons. Due to the nearly exclusive expression of DCX in developing neurons, the immunostaining of this protein was performed for assessing neurogenesis. DCX expression in both treated groups was significantly increased, suggesting that statins can enhance neuronal formation (P<0.05 versus control) (Figure 5). Double staining for BrdU-DCX and BrdU-NeuN revealed a subpopulation of cells that express neuronal markers while still dividing, and they were mostly localized within the boundary area around the hematoma, suggesting that the cells positive for immature and mature neuron markers are newly formed during the recovery stage (Table 1). The statin treatments significantly increase the number of co-labeled immunoreactive cells compared with control group. The percentages of the DCX-immunoreactive neurons were also labeled with BrdU as follows: simvastatin, 14%±1.5%, P <0.05; atorvastatin, 14.5±1.7%, P<0.05; and control, 14±1.5%, respectively. Consistent with the neurological functional studies, the simvastatin group exhibited stronger neurological immunostaining markers expression than the atorvastatin group.
Figure 5.
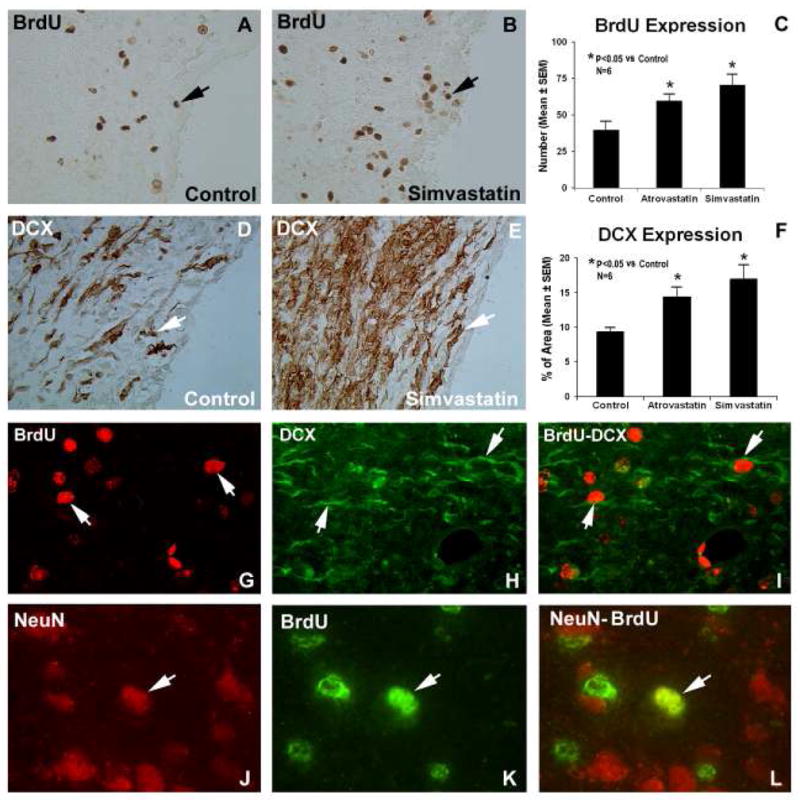
Examples of BrdU (A and B) and DCX (D and E) stained sections from the subventricular zone of control and simvastatin-treated animals, respectively. Quantitative immunoreactivities of the stainings are shown in C and F. Significantly higher expressions were observed for both stains in both statin-treated groups, compared to the control group.
Panels G-L show fluorescence microscopy images from a simvastatin-treated animal. Individual images are presented for BrdU (panels G and K), DCX (panel H) and NeuN (panel J) that were obtained for the BrdU-DCX and BrdU-NeuN double staining methods. The merged images for BrdU-DCX double staining in a subpopulation of cells is presented in panel I and double immunoreactive cell labeling with BrdU and NeuN near the injured site is shown in panel L. The arrows indicate co-localization of representative cells that stained positively for both BrdU-DCX and for NeuN-BrdU.
TABLE 1.
BrdU/DCX Expression
| BrdU+ |
BrdU+-DCX+ |
BrdU+-NeuN+ |
|||
|---|---|---|---|---|---|
| Groups | Ipsi SVZ | Cont SVZ | DG | Ipsi SVZ | Boundary Zone |
| Control | 39.83±6.09 | 16.83±1.82 | 3.83±1.17 | 4.17±1.01 | 0.83±0.31 |
| Atorvastatin | 59.67±4.38* | 19.17±4.04 | 6.50±1.23 | 8.83±1.62* | 3.17±0.79* |
| Simvastatin | 70.50±7.23* | 19.50±3.72 | 6.66±1.12 | 9.83±1.66* | 3.33±0.84* |
Values are mean ± SEM
p<0.05 vs control group
Discussion
We compared simvastatin and atorvastatin treatments in a rat ICH model. These two statins have some basic differences including that simvastatin crosses the BBB22 and that atorvastatin has a longer plasma life than simvastatin.14 Zacco et al. also reported that the rank order of neuroprotective potency was greater for simvastatin than atorvastatin,22 similar to that of our ICH treatments.
SWI is a powerful approach for visualizing hemorrhage in acute stroke compared to computed tomography (CT) and other conventional MRI methods.19 The reduced blood flow that accompanies ICH can deplete tissue oxygen within minutes.27 The transition of oxyhemoglobin to deoxyhemoglobin in the hematoma occurs within the first few hours and could be detected as low signal intensity on SWI before other MRI sequences.28,29 Atlas et al. suggest that the edges of the hemorrhage are the first to display the susceptibility effects of deoxygenated blood.28 SWI is also known to over estimate hematoma volume due to susceptibility effects.30 Estimates of hematoma volume provide a general framework for ICH prognosis, with increased hematoma volume associated with additional bleeding and neurological deterioration.31,32 In the present study, SWI showed a significant reduction of hematoma volumes at 4 weeks in rats treated with simvastatin and marginal improvement with atorvastatin as compared with control. Using a double injection ICH model, Belayev et al. reported that hematoma volumes were maximum at 0 hours post-ICH, minimum at 24 hours and then increased at 7 days for both control and albumin-treated groups.15 The mean hematoma volume 1–2 hours after ICH onset in the present study was ~56 μL.
The mass effects of a blood clot in the brain can produce edema formation, midline shift, and BBB disruption. Some of the injury after ICH is due to blood-derived factors and is different from cerebral ischemia.2 Such injuries may cause functional neurological deficits. Decreased hematoma volumes, tissue loss, and neurological deficits at 4 weeks post-ICH were associated with atorvastatin and simvastatin treatment. These findings suggest that the post-ICH neurological deficits might simply be attributed to tissue loss and the destruction of the normal tissues due to the hematoma volume. Conversely, tissue restoration and neuronal regeneration was associated with neurological recovery.
A previous study from our group showed that 2 mg/kg atorvastatin administered 1–7 days (early) and 20 mg/kg acutely (within 24 hours) after ICH significantly improved neurological outcome and hence enhanced neuroplasticity in rats.11 Atorvastatin also produced significant improvement in the functional recovery and neurogenesis in rats after TBI,6–8 and embolic middle cerebral artery occlusion.5 Lu et al. reported that simvastatin treatment of TBI provided a therapeutic effect superior to the same dose of atorvastatin.8 Behavioral scores in the present study also improved more for simvastatin than atorvastatin. Furthermore, although atorvastatin improved neurobehavioral results after 2 weeks in this study, it did not significantly influence hematoma size. This suggests that statin treatment of ICH may enhance neuroplasticity and promote functional recovery. This study also showed that only a few dead neurons were replaced by the newly formed cells at 4 weeks after ICH. However, the statin treatments significantly increased the cell proliferation and differentiation. The present investigation, using the same dose regimen for both statins, showed that the simvastatin cohort demonstrated equal or slightly better improvement than atorvastatin. It is possible, however, that the dose used was not optimal and the dose dependency of the treatment regimens should be investigated further in order to most effectively translate these findings toward human trials.
Several clinical studies have suggested the possible relationship of statins and low cholesterol values with intracerebral hemorrhage (ICH).33–35 However, this assertion is not definitive. Baigent et al reported no relationship between statin use and the occurrence of ICH in patients.36 While we did not directly measure cholesterol levels in this study, Chen et al. reported no significant differences for total serum cholesterol between Wistar rats given daily doses of 1, 3, or 8 mg/kg of atorvastatin for 7 days or control animals.4 In our study increases in cerebral bleeding or ICH size by MRI or histological measurements were not observed following statin treatment.
In conclusion, simvastatin and atorvastatin treatment for 1 week after ICH significantly improved neurological outcome and reduced hematoma volume and tissue loss at 4 weeks. Simvastatin was equal or slightly more effective than atorvastatin. The reduction of tissue loss with statin treatment of ICH was associated with increased neurogenesis. These findings also suggest that MRI is a reliable method to measure ICH volume and the volume of tissue loss after experimental ICH and may be useful for evaluating the efficacy of therapeutic interventions.
Acknowledgments
Special thanks to Susan MacPhee-Gray for editorial assistance.
Sources of Funding
Supported by: National Institute of Health grants RO1 NS058581-01A1 (D.M.S.).
Footnotes
Disclosure
None
References
- 1.American Heart Association. Heart disease and stroke statistics - 2008 update. Dallas, TX: American Heart Association; 2008. [Google Scholar]
- 2.Cannon JR, Xi G, Keep RF. Recent research on changes in genomic regulation and protein expression in intracerebral haemorrhage. Int J Stroke. 2007;2:265–269. doi: 10.1111/j.1747-4949.2007.00160.x. [DOI] [PubMed] [Google Scholar]
- 3.NINDS. Priorities for clinical research in intracerebral hemorrhage: Report from a national institute of neurological disorders and stroke workshop. Stroke. 2005;36:e23–41. doi: 10.1161/01.STR.0000155685.77775.4c. [DOI] [PubMed] [Google Scholar]
- 4.Chen J, Zhang ZG, Li Y, Wang Y, Wang L, Jiang H, Zhang C, Lu M, Katakowski M, Feldkamp CS, Chopp M. Statins induce angiogenesis, neurogenesis, and synaptogenesis after stroke. Ann Neurol. 2003;53:743–751. doi: 10.1002/ana.10555. [DOI] [PubMed] [Google Scholar]
- 5.Zhang L, Zhang ZG, Ding GL, Jiang Q, Liu X, Meng H, Hozeska A, Zhang C, Li L, Morris D, Zhang RL, Lu M, Chopp M. Multitargeted effects of statin-enhanced thrombolytic therapy for stroke with recombinant human tissue-type plasminogen activator in the rat. Circulation. 2005;112:3486–3494. doi: 10.1161/CIRCULATIONAHA.104.516757. [DOI] [PubMed] [Google Scholar]
- 6.Lu D, Mahmood A, Goussev A, Qu C, Zhang ZG, Chopp M. Delayed thrombosis after traumatic brain injury in rats. J Neurotrauma. 2004;21:1756–1766. doi: 10.1089/neu.2004.21.1756. [DOI] [PubMed] [Google Scholar]
- 7.Lu D, Mahmood A, Qu C, Goussev A, Lu M, Chopp M. Atorvastatin reduction of intracranial hematoma volume in rats subjected to controlled cortical impact. J Neurosurg. 2004;101:822–825. doi: 10.3171/jns.2004.101.5.0822. [DOI] [PubMed] [Google Scholar]
- 8.Lu D, Qu C, Goussev A, Jiang H, Lu C, Schallert T, Mahmood A, Chen J, Li Y, Chopp M. Statins increase neurogenesis in the dentate gyrus, reduce delayed neuronal death in the hippocampal CA3 region, and improve spatial learning in rat after traumatic brain injury. J Neurotrauma. 2007;24:1132–1146. doi: 10.1089/neu.2007.0288. [DOI] [PMC free article] [PubMed] [Google Scholar]
- 9.Lynch JR, Wang H, McGirt MJ, Floyd J, Friedman AH, Coon AL, Blessing R, Alexander MJ, Graffagnino C, Warner DS, Laskowitz DT. Simvastatin reduces vasospasm after aneurysmal subarachnoid hemorrhage: Results of a pilot randomized clinical trial. Stroke. 2005;36:2024–2026. doi: 10.1161/01.STR.0000177879.11607.10. [DOI] [PubMed] [Google Scholar]
- 10.Jung KH, Chu K, Jeong SW, Han SY, Lee ST, Kim JY, Kim M, Roh JK. HMG-CoA reductase inhibitor, atorvastatin, promotes sensorimotor recovery, suppressing acute inflammatory reaction after experimental intracerebral hemorrhage. Stroke. 2004;35:1744–1749. doi: 10.1161/01.STR.0000131270.45822.85. [DOI] [PubMed] [Google Scholar]
- 11.Seyfried D, Han Y, Lu D, Chen J, Bydon A, Chopp M. Improvement in neurological outcome after administration of atorvastatin following experimental intracerebral hemorrhage in rats. J Neurosurg. 2004;101:104–107. doi: 10.3171/jns.2004.101.1.0104. [DOI] [PubMed] [Google Scholar]
- 12.Vaughan CJ, Murphy MB, Buckley BM. Statins do more than just lower cholesterol. Lancet. 1996;348:1079–1082. doi: 10.1016/S0140-6736(96)05190-2. [DOI] [PubMed] [Google Scholar]
- 13.Furberg CD. Natural statins and stroke risk. Circulation. 1999;99:185–188. doi: 10.1161/01.cir.99.2.185. [DOI] [PubMed] [Google Scholar]
- 14.Endres M, Laufs U. Effects of statins on endothelium and signaling mechanisms. Stroke. 2004;35:2708–2711. doi: 10.1161/01.STR.0000143319.73503.38. [DOI] [PubMed] [Google Scholar]
- 15.Belayev L, Obenaus A, Zhao W, Saul I, Busto R, Wu C, Vigdorchik A, Lin B, Ginsberg MD. Experimental intracerebral hematoma in the rat: Characterization by sequential magnetic resonance imaging, behavior, and histopathology. Effect of albumin therapy. Brain Res. 2007;1157:146–155. doi: 10.1016/j.brainres.2007.04.077. [DOI] [PubMed] [Google Scholar]
- 16.Wagner KR, Sharp FR, Ardizzone TD, Lu A, Clark JF. Heme and iron metabolism: Role in cerebral hemorrhage. J Cereb Blood Flow Metab. 2003;23:629–652. doi: 10.1097/01.WCB.0000073905.87928.6D. [DOI] [PubMed] [Google Scholar]
- 17.Reichenbach JR, Venkatesan R, Yablonskiy DA, Thompson MR, Lai S, Haacke EM. Theory and application of static field inhomogeneity effects in gradient-echo imaging. J Magn Reson Imaging. 1997;7:266–279. doi: 10.1002/jmri.1880070203. [DOI] [PubMed] [Google Scholar]
- 18.Haacke EM, Brown RW, Thompson MR, Venkatesan R. Magnetic resonance imaging: Physical principles and sequence design. New York: A. John Wiley & Sons; 1999. [Google Scholar]
- 19.von Kummer R. Mri: The new gold standard for detecting brain hemorrhage? Stroke. 2002;33:1748–1749. doi: 10.1161/01.str.0000019882.06696.d6. [DOI] [PubMed] [Google Scholar]
- 20.Knight RA, Han Y, Nagaraja TN, Whitton P, Ding J, Chopp M, Seyfried DM. Temporal MRI assessment of intracerebral hemorrhage in rats. Stroke. 2008;39:2596–2602. doi: 10.1161/STROKEAHA.107.506683. [DOI] [PMC free article] [PubMed] [Google Scholar]
- 21.Cho KH, Kim JS, Kwon SU, Cho AH, Kang DW. Significance of susceptibility vessel sign on T2*-weighted gradient echo imaging for identification of stroke subtypes. Stroke. 2005;36:2379–2383. doi: 10.1161/01.STR.0000185932.73486.7a. [DOI] [PubMed] [Google Scholar]
- 22.Zacco A, Togo J, Spence K, Ellis A, Lloyd D, Furlong S, Piser T. 3-hydroxy-3-methylglutaryl coenzyme a reductase inhibitors protect cortical neurons from excitotoxicity. J Neurosci. 2003;23:11104–11111. doi: 10.1523/JNEUROSCI.23-35-11104.2003. [DOI] [PMC free article] [PubMed] [Google Scholar]
- 23.Seyfried D, Ding J, Han Y, Li Y, Chen J, Chopp M. Effects of intravenous administration of human bone marrow stromal cells after intracerebral hemorrhage in rats. J Neurosurg. 2006;104:313–318. doi: 10.3171/jns.2006.104.2.313. [DOI] [PubMed] [Google Scholar]
- 24.Yang S, Song S, Hua Y, Nakamura T, Keep RF, Xi G. Effects of thrombin on neurogenesis after intracerebral hemorrhage. Stroke. 2008;39:2079–2084. doi: 10.1161/STROKEAHA.107.508911. [DOI] [PubMed] [Google Scholar]
- 25.Zhang L, Schallert T, Zhang ZG, Jiang Q, Arniego P, Li Q, Lu M, Chopp M. A test for detecting long-term sensorimotor dysfunction in the mouse after focal cerebral ischemia. J Neurosci Methods. 2002;117:207–214. doi: 10.1016/s0165-0270(02)00114-0. [DOI] [PubMed] [Google Scholar]
- 26.Chen J, Li Y, Wang L, Zhang Z, Lu D, Lu M, Chopp M. Therapeutic benefit of intravenous administration of bone marrow stromal cells after cerebral ischemia in rats. Stroke. 2001;32:1005–1011. doi: 10.1161/01.str.32.4.1005. [DOI] [PubMed] [Google Scholar]
- 27.Nath FP, Kelly PT, Jenkins A, Mendelow AD, Graham DI, Teasdale GM. Effects of experimental intracerebral hemorrhage on blood flow, capillary permeability, and histochemistry. J Neurosurg. 1987:66. doi: 10.3171/jns.1987.66.4.0555. [DOI] [PubMed] [Google Scholar]
- 28.Atlas SW, Thulborn KR. MR detection of hyperacute parenchymal hemorrhage of the brain. AJNR Am J Neuroradiol. 1998;19:1471–1477. [PMC free article] [PubMed] [Google Scholar]
- 29.Patel MR, Edelman RR, Warach S. Detection of hyperacute primary intraparenchymal hemorrhage by magnetic resonance imaging. Stroke. 1996;27:2321–2324. doi: 10.1161/01.str.27.12.2321. [DOI] [PubMed] [Google Scholar]
- 30.Burgess RE, Warach S, Schaewe TJ, Copenhaver BR, Alger JR, Vespa P, Martin N, Saver JL, Kidwell CS. Development and validation of a simple conversion model for comparison of intracerebral hemorrhage volumes measured on CT and gradient recalled echo MRI. Stroke. 2008;39:2017–2020. doi: 10.1161/STROKEAHA.107.505719. [DOI] [PMC free article] [PubMed] [Google Scholar]
- 31.Broderick JP, Brott TG, Duldner JE, Tomsick T, Huster G. Volume of intracerebral hemorrhage. A powerful and easy-to-use predictor of 30-day mortality. Stroke. 1993;24:987–993. doi: 10.1161/01.str.24.7.987. [DOI] [PubMed] [Google Scholar]
- 32.Davis SM, Broderick J, Hennerici M, Brun NC, Diringer MN, Mayer SA, Begtrup K, Steiner T. Hematoma growth is a determinant of mortality and poor outcome after intracerebral hemorrhage. Neurology. 2006;66:1175–1181. doi: 10.1212/01.wnl.0000208408.98482.99. [DOI] [PubMed] [Google Scholar]
- 33.Iso H, Jacobs DR, Jr, Wentworth D, Neaton JD, Cohen JD. Serum cholesterol levels and six-year mortality from stroke in 350,977 men screened for the multiple risk factor intervention trial. N Engl J Med. 1989;320:904–910. doi: 10.1056/NEJM198904063201405. [DOI] [PubMed] [Google Scholar]
- 34.Sturgeon JD, Folsom AR, Longstreth WT, Jr, Shahar E, Rosamond WD, Cushman M. Risk factors for intracerebral hemorrhage in a pooled prospective study. Stroke. 2007;38:2718–2725. doi: 10.1161/STROKEAHA.107.487090. [DOI] [PubMed] [Google Scholar]
- 35.Bang OY, Saver JL, Liebeskind DS, Starkman S, Villablanca P, Salamon N, Buck B, Ali L, Restrepo L, Vinuela F, Duckwiler G, Jahan R, Razinia T, Ovbiagele B. Cholesterol level and symptomatic hemorrhagic transformation after ischemic stroke thrombolysis. Neurology. 2007;68:737–742. doi: 10.1212/01.wnl.0000252799.64165.d5. [DOI] [PubMed] [Google Scholar]
- 36.Bagient C, Keech A, Kearney PM, Blackwell L, Buck G, Pollicino C, Kirby A, Sourjina T, Peto R, Collins R, Simes R. Efficacy and safety of cholesterol-lowering treatment: Prospective meta-analysis of data from 90,056 participants in 14 randomised trials of statins. Lancet. 2005;366:1267–1278. doi: 10.1016/S0140-6736(05)67394-1. [DOI] [PubMed] [Google Scholar]