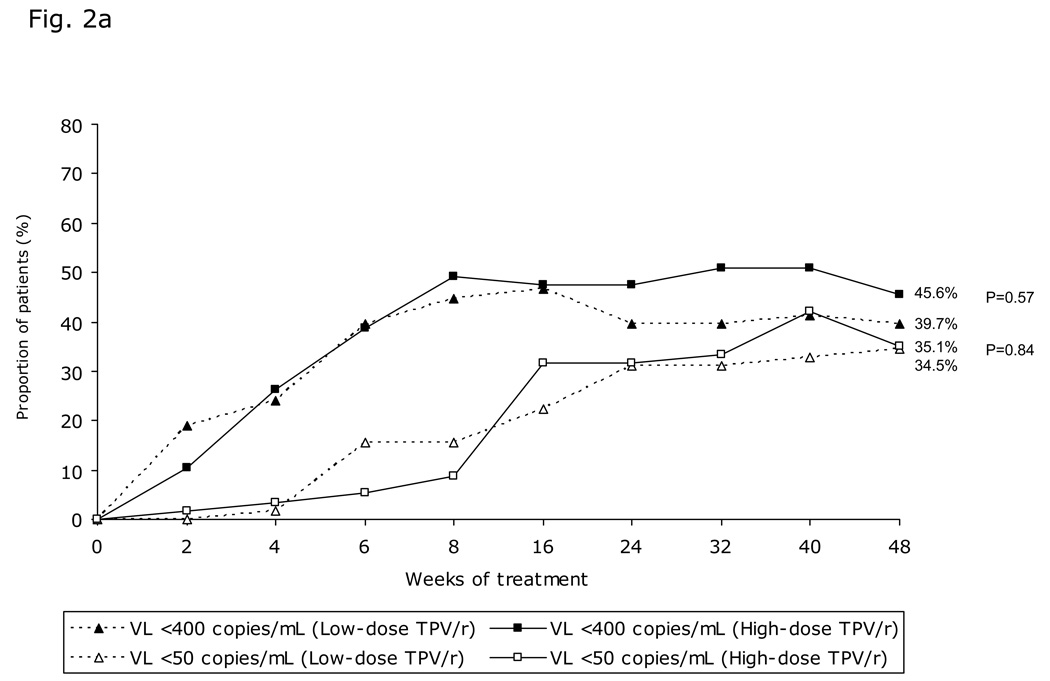
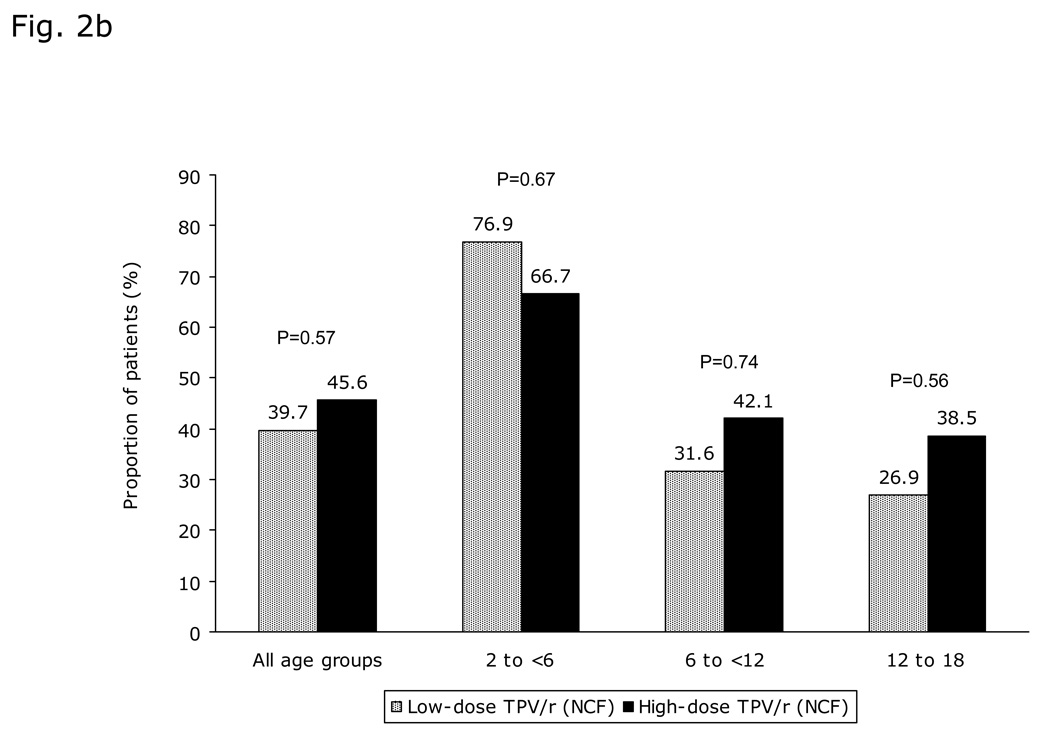
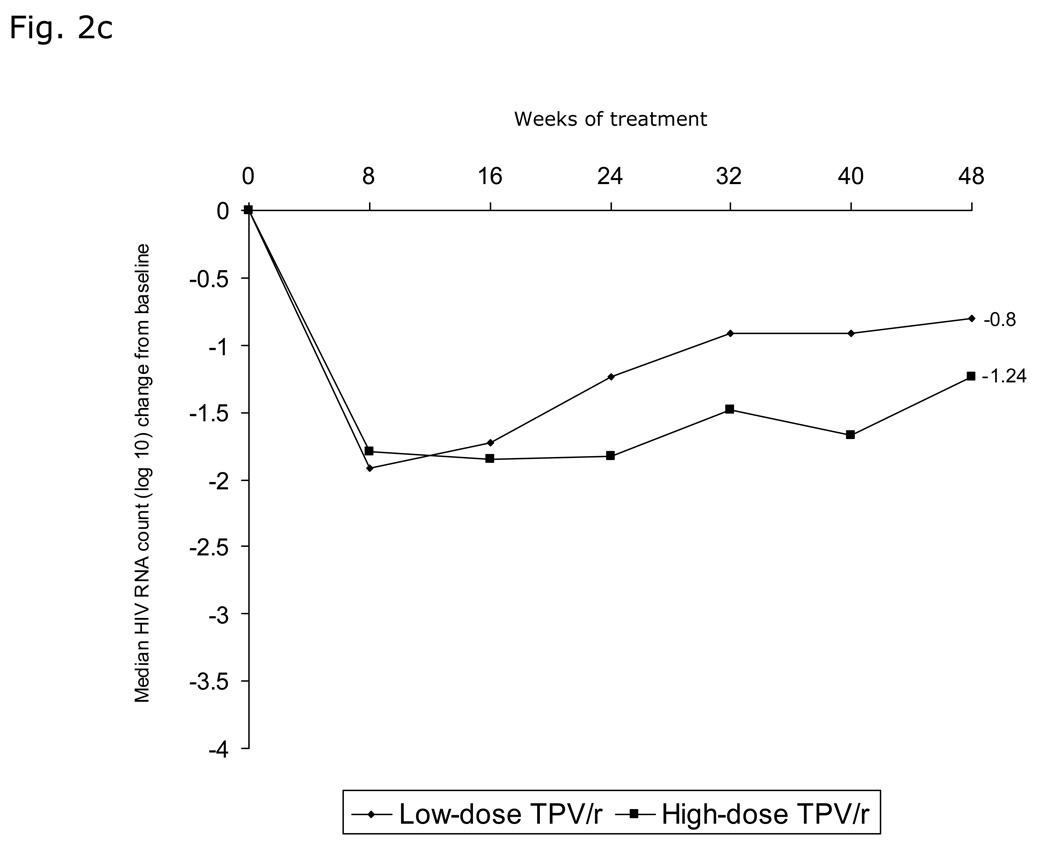
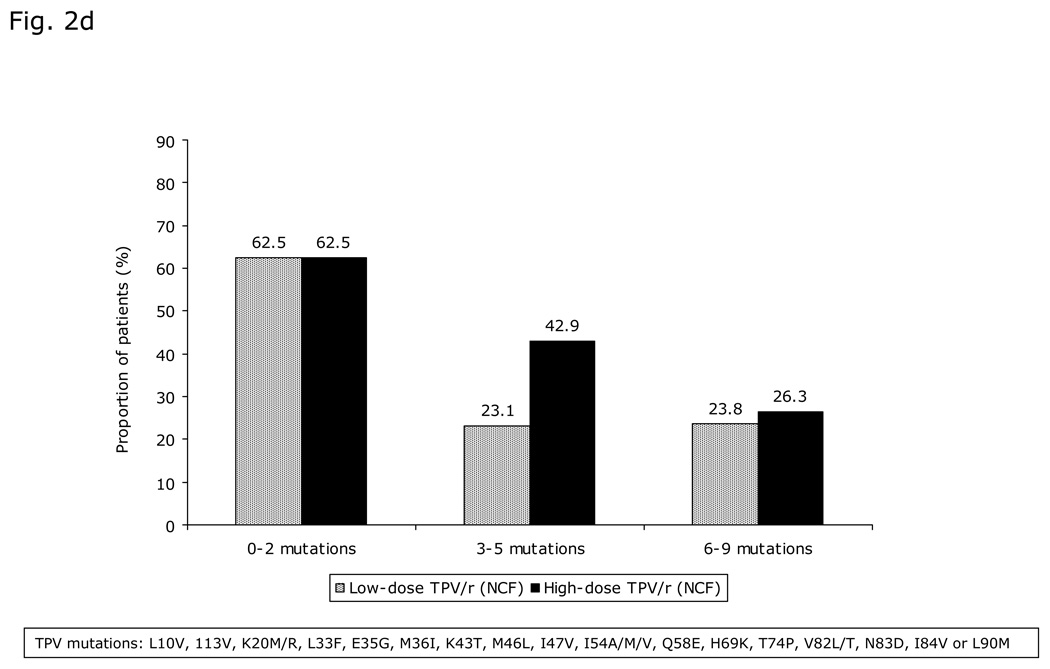
Fig. 2. Virologic responses through 48 weeks.
a) Proportion of patients with viral load (VL) <400 copies/mL and <50 copies/mL over time stratified by TPV/r treatment group; b) Virologic response (viral load [VL] <400 copies/mL) stratified by TPV/r treatment group and age group; c) Median decrease in viral load (VL, log10 copies/mL) over time stratified by TPV/r treatment group; d) Virologic response (viral load [VL] <400 copies/mL) based on LPV mutation score stratified by TPV/r treatment group.


